Proceedings Fonetik 2009 - Institutionen för lingvistik
Proceedings Fonetik 2009 - Institutionen för lingvistik
Proceedings Fonetik 2009 - Institutionen för lingvistik

You also want an ePaper? Increase the reach of your titles
YUMPU automatically turns print PDFs into web optimized ePapers that Google loves.
Department of Linguistics<strong>Proceedings</strong>FONETIK <strong>2009</strong>The XXII th Swedish Phonetics ConferenceJune 10-12, <strong>2009</strong>
<strong>Proceedings</strong>, FONETIK <strong>2009</strong>, Dept. of Linguistics, Stockholm UniversityPrevious Swedish Phonetics Conferences (from 1986)I 1986 Uppsala UniversityII 1988 Lund UniversityIII 1989 KTH StockholmIV 1990 Umeå University (Lövånger)V 1991 Stockholm UniversityVI 1992 Chalmers and Göteborg UniversityVII 1993 Uppsala UniversityVIII 1994 Lund University (Höör)- 1995 (XIII th ICPhS in Stockholm)IX 1996 KTH Stockholm (Nässlingen)X 1997 Umeå UniversityXI 1998 Stockholm UniversityXII 1999 Göteborg UniversityXIII 2000 Skövde University CollegeXIV 2001 Lund UniversityXV 2002 KTH StockholmXVI 2003 Umeå University (Lövånger)XVII 2004 Stockholm UniversityXVIII 2005 Göteborg UniversityXIX 2006 Lund UniversityXX 2007 KTH StockholmXXI 2008 Göteborg University<strong>Proceedings</strong> FONETIK <strong>2009</strong>The XXII th Swedish Phonetics Conference,held at Stockholm University, June 10-12, <strong>2009</strong>Edited by Peter Branderud and Hartmut TraunmüllerDepartment of LinguisticsStockholm UniversitySE-106 91 StockholmISBN 978-91-633-4892-1 printed versionISBN 978-91-633-4893-8 web version <strong>2009</strong>-05-28http://www.ling.su.se/fon/fonetik_<strong>2009</strong>/proceedings_fonetik<strong>2009</strong>.pdfThe new symbol for the Phonetics group at the Department of Linguistics,which is shown on the front page, was created by Peter Branderud andMikael Parkvall.© The Authors and the Department of Linguistics, Stockholm UniversityPrinted by Universitetsservice US-AB <strong>2009</strong>2
<strong>Proceedings</strong>, FONETIK <strong>2009</strong>, Dept. of Linguistics, Stockholm UniversityPrefaceThis volume contains the contributions to FONETIK <strong>2009</strong>, theTwentysecond Swedish Phonetics Conference, organized by the Phoneticsgroup of Stockholm University on the Frescati campus June 10-12 <strong>2009</strong>.The papers appear in the order in which they were given at the Conference.Only a limited number of copies of this publication was printed fordistribution among the authors and those attending the meeting. For accessto web versions of the contributions, please look underwww.ling.su.se/fon/fonetik_<strong>2009</strong>/.We would like to thank all contributors to the <strong>Proceedings</strong>. We are alsoindebted to <strong>Fonetik</strong>stiftelsen for financial support.Stockholm in May <strong>2009</strong>On behalf of the Phonetics groupPeter Branderud Francisco Lacerda Hartmut Traunmüller3
<strong>Proceedings</strong>, FONETIK <strong>2009</strong>, Dept. of Linguistics, Stockholm UniversityContentsPhonology and Speech ProductionF0 lowering, creaky voice, and glottal stop:Jan Gauffin’s account of how the larynx works in speechBjörn LindblomEskilstuna as the tonal key to DanishTomas RiadFormant transitions in normal and disordered speech:An acoustic measure of articulatory dynamicsBjörn Lindblom, Diana Krull, Lena Hartelius and Ellika SchallingEffects of vocal loading on the phonation and collision thresholdpressuresLaura Enflo, Johan Sundberg and Friedemann Pabst8121824Posters P1Experiments with synthesis of Swedish dialectsJonas Beskow and Joakim GustafsonReal vs. rule-generated tongue movements as an audio-visual speechperception supportOlov Engwall and Preben WikAdapting the Filibuster text-to-speech system for Norwegian bokmålKåre Sjölander and Christina TånnanderAcoustic characteristics of onomatopoetic expressions in childdirectedspeechUlla Sundberg and Eeva Klintfors28303640Swedish DialectsPhrase initial accent I in South SwedishSusanne Schötz and Gösta BruceModelling compound intonation in Dala and Gotland SwedishSusanne Schötz, Gösta Bruce and Björn GranströmThe acoustics of Estonian Swedish long close vowels as compared toCentral Swedish and Finland SwedishEva Liina Asu, Susanne Schötz and Frank KüglerFenno-Swedish VOT: Influence from Finnish?Catherine Ringen and Kari Suomi424854604
<strong>Proceedings</strong>, FONETIK <strong>2009</strong>, Dept. of Linguistics, Stockholm UniversityProsodyGrammaticalization of prosody in the brainMikael Roll and Merle HorneFocal lengthening in assertions and confirmationsGilbert AmbrazaitisOn utterance-final intonation in tonal and non-tonal dialects ofKammuDavid House, Anastasia Karlsson, Jan-Olof Svantesson and DamrongTayaninReduplication with fixed tone pattern in KammuJan-Olof Svantesson, David House, Anastasia Mukhanova Karlssonand Damrong Tayanin66727882Posters P2Exploring data driven parametric synthesisRolf Carlson, Kjell GustafsonUhm… What’s going on? An EEG study on perception of filledpauses in spontaneous Swedish speechSebastian Mårback, Gustav Sjöberg, Iris-Corinna Schwarz and RobertEklundHöraTal – a test and training program for children who havedifficulties in perceiving and producing speechAnne-Marie Öster869296Second LanguageTransient visual feedback on pitch variation for Chinese speakers ofEnglishRebecca Hincks and Jens EdlundPhonetic correlates of unintelligibility in Vietnamese-accented EnglishUna CunninghamPerception of Japanese quantity by Swedish speaking learners: Apreliminary analysisMiyoko InoueAutomatic classification of segmental second language speech qualityusing prosodic featuresEero Väyrynen, Heikki Keränen, Juhani Toivanen and Tapio Seppänen1021081121165
<strong>Proceedings</strong>, FONETIK <strong>2009</strong>, Dept. of Linguistics, Stockholm UniversitySpeech DevelopmentChildren’s vocal behaviour in a pre-school environment and resultingvocal functionMechtild Tronnier and Anita McAllisterMajor parts-of-speech in child language – division in open and closeclass wordsEeva Klintfors, Francisco Lacerda and Ulla SundbergLanguage-specific speech perception as mismatch negativity in 10-month-olds’ ERP dataIris-Corinna Schwarz, Malin Forsén, Linnea Johansson, CatarinaLång, Anna Narel, Tanya Valdés, and Francisco LacerdaDevelopment of self-voice recognition in childrenSofia Strömbergsson120126130136Posters P3Studies on using the SynFace talking head for the hearing impairedSamer Al Moubayed, Jonas Beskow, Ann-Marie Öster, GiampieroSalvi, Björn Granström, Nic van Son, Ellen Ormel and Tobias HerzkeOn extending VTLN to phoneme-specific warping in automatic speechrecognitionDaniel Elenius and Mats BlombergVisual discrimination between Swedish and Finnish among L2-learners of SwedishNiklas Öhrström, Frida Bulukin Wilén, Anna Eklöf and JoakimGustafsson140144150Speech PerceptionEstimating speaker characteristics for speech recognitionMats Blomberg and Daniel EleniusAuditory white noise enhances cognitive performance under certainconditions: Examples from visuo-spatial working memory anddichotic listening tasksGöran G. B. W. Söderlund, Ellen Marklund, and Francisco LacerdaFactors affecting visual influence on heard vowel roundedness:Web experiments with Swedes and TurksHartmut Traunmüller1541601666
<strong>Proceedings</strong>, FONETIK <strong>2009</strong>, Dept. of Linguistics, Stockholm UniversityVoice and Forensic PhoneticsBreathiness differences in male and female speech. Is H1-H2 anappropriate measure?Adrian P. SimpsonEmotions in speech: an interactional framework for clinicalapplicationsAni Toivanen and Juhani ToivanenEarwitnesses: The effect of voice differences in identification accuracyand the realism in confidence judgmentsElisabeth Zetterholm, Farhan Sarwar and Carl Martin AllwoodPerception of voice similarity and the results of a voice line-upJonas Lindh172176180186Posters P4Project presentation: Spontal – multimodal database of spontaneousspeech dialogJonas Beskow, Jens Edlund, Kjell Elenius, Kahl Hellmer, David Houseand Sofia StrömbergssonA first step towards a text-independent speaker verification Praat pluginusing Mistral/Alize toolsJonas LindhModified re-synthesis of initial voiceless plosives by concatenation ofspeech from different speakersSofia Strömbergsson190194198Special TopicsCross-modal clustering in the acoustic – articulatory spaceG. Ananthakrishnan and Daniel M. NeibergSwedish phonetics 1939-1969Paul TouatiHow do Swedish encyclopedia users want pronunciation to bepresented?Michaël StenbergLVA-technology – The illusion of “lie detection”F. Lacerda202208214220Author Index 2267
<strong>Proceedings</strong>, FONETIK <strong>2009</strong>, Dept. of Linguistics, Stockholm UniversityF0 lowering, creaky voice, and glottal stop: Jan Gauffin’saccount of how the larynx works in speechBjörn LindblomDepartment of Linguistics, Stockholm UniversityAbstractF0 lowering, creaky voice, Danish stød andglottal stops may at first seem like a group ofonly vaguely related phenomena. However, atheory proposed by Jan Gauffin (JG) almostforty years ago puts them on a continuum ofsupralaryngeal constriction. The purpose of thepresent remarks is to briefly review JG:s workand to summarize evidence from current researchthat tends to reinforce many of his observationsand lend strong support to his viewof how the larynx is used in speech. In a companionpaper at this conference, Tomas Riadpresents a historical and dialectal account ofrelationships among low tones, creak and stødin Swedish and Danish that suggests that thedevelopment of these phenomena may derivefrom a common phonetic mechanism. JG:s supralaryngealconstriction dimension with F0lowering ⇔ creak ⇔ glottal stop appears likea plausible candidate for such a mechanism.How is F0 lowered?In his handbook chapter on “Investigating thephysiology of laryngeal structures” Hirose(1997:134) states: “Although the mechanism ofpitch elevation seems quite clear, the mechanismof pitch lowering is not so straightforward.The contribution of the extrinsic laryngeal musclessuch as sternohyoid is assumed to be significant,but their activity often appears to be aresponse to, rather than the cause of, a changein conditions. The activity does not occur priorto the physical effects of pitch change.”Honda (1995) presents a detailed review ofthe mechanisms of F0 control mentioning severalstudies of the role of the extrinsic laryngealmuscles motivated by the fact that F0 loweringis often accompanied by larynx lowering. Howeverhis conclusion comes close to that of Hirose.At the end of the sixties Jan Gauffin beganhis experimental work on laryngeal mechanisms.As we return to his work today we willsee that, not only did he acknowledge the incompletenessof our understanding of F0 lowering,he also tried to do something about it.Jan Gauffin’s accountJG collaborated with Osamu Fujimura at RILPat the University of Tokyo. There he had an opportunityto make films of the vocal folds usingfiber optics. His data came mostly from Swedishsubjects. He examined laryngeal behaviorduring glottal stops and with particular attentionto the control of voice quality. Swedishword accents provided an opportunity to investigatethe laryngeal correlates of F0 changes(Lindqvist-Gauffin 1969, 1972).Analyzing the laryngoscopic images JG becameconvinced that laryngeal behavior inspeech involves anatomical structures not onlyat the glottal level but also above it. He becameparticularly interested in the mechanism knownas the ‘aryepiglottic sphincter’. The evidencestrongly suggested that this supraglottal structureplays a significant role in speech, both inarticulation and in phonation. [Strictly speakingthe ‘ary-epiglottic sphincter’ is not a circularmuscle system. It invokes several muscularcomponents whose joint action can functionallybe said to be ‘sphincter-like’.]In the literature on comparative anatomy JGdiscovered the use of the larynx in protectingthe lungs and the lower airways and its keyroles in respiration and phonation (Negus1949). The throat forms a three-tiered structurewith valves at three levels (Pressman 1954):The aryepiglottic folds, ventricular folds andthe true vocal folds. JG found that protectiveclosure is brought about by invoking the “aryepiglotticmuscles, oblique arytenoid muscles,and the thyroepiglottic muscles. The closureoccurs above the glottis and is made betweenthe tubercle of the epiglottis, the cuneiform cartilages,and the arytenoid cartilages”.An overall picture started to emerge bothfrom established facts and from data that he gatheredhimself. He concluded that the traditionalview of the function of the larynx in speechneeded modification. The information conveyedby the fiberoptic data told him that in speech8
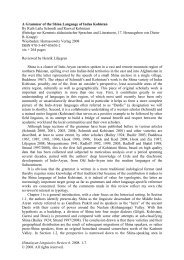
<strong>Proceedings</strong>, FONETIK <strong>2009</strong>, Dept. of Linguistics, Stockholm Universitythe larynx appears to be constricted in twoways: at the vocal folds and at the aryepiglotticfolds. He hypothesized that the two levels “areindependent at a motor command level and thatdifferent combinations of them may be used asphonatory types of laryngeal articulations indifferent languages”. Figure 1 presents JG’s 2-dimensional model applied to selected phonationtypes.In the sixties the standard description ofphonation types was the one proposed by Ladefoged(1967) which placed nine distinct phonationtypes along a single dimension.In JG’s account a third dimension was alsoenvisioned with the vocalis muscles operatingfor pitch control in a manner independent ofglottal abduction and laryngealization.Figure 1. 2-D account of selected phonation types(Lindqvist-Gauffin 1972). Activity of the vocalismuscles adds a third dimension for pitch controlwhich is independent of adduction/abduction andlaryngealization.JG’s proposal was novel in several respects:Figure 2. Sequence of images of laryngeal movementsfrom deep inspiration to the beginning ofphonation. Time runs in a zig-zag manner from topto bottom of the figure. Phonation begins at thelower right of the matrix. It is preceded by a glottalstop which is seen to involve a supraglottal constriction.Not only does the aryepiglottic sphincter mechanismreduce the inlet of the larynx. It alsoparticipates in decreasing the distance betweenarytenoids and the tubercle of the epiglottis thusshortening and thickening the vocal folds.When combined with adducted vocal folds thisaction results in lower and irregular glottal vibrationsin other words, in lower F0 and increaky voice.(i)(ii)(iii)(iv)There is more going on than mere adjustmentsof vocal folds along a singleadduction-abduction continuum: Thesupralaryngeal (aryepiglottic sphincter)structures are involved in both phonatoryand articulatory speech gestures;These supralaryngeal movements createa dimension of ‘laryngeal constriction’.They play a key role in the productionof the phonation types of the languagesof the world.Fiberoptic observations show that laryngealizationis used to lower the fundamentalfrequency.The glottal stop, creaky voice and F0lowering differ in terms of degree of laryngealconstriction.Figure 3. Laryngeal states during the productionhigh and low fundamental frequencies and with thevocal folds adducted and abducted. It is evident thatthe low pitch is associated with greater constrictionat the aryepiglottic level in both cases.9
<strong>Proceedings</strong>, FONETIK <strong>2009</strong>, Dept. of Linguistics, Stockholm UniversityEvaluating the theoryThe account summarized above was developedin various reports from the late sixties and earlyseventies. In the tutorial chapter by Hirose(1997) cited in the introduction, supraglottalconstrictions are but briefly mentioned in connectionwith whispering, glottal stop and theproduction of the Danish stød. In Honda (1995)it is not mentioned at all.In 2001 Ladefoged contributed to an updateon the world’s phonation types (Gordon & Ladefoged2001) without considering the factsand interpretations presented by JG. In fact theauthors’ conclusion is compatible with Ladefoged’searlier one-dimensional proposal from1967: “Phonation differences can be classifiedalong a continuum ranging from voiceless,through breathy voiced, to regular, modal voicing,and then on through creaky voice to glottalclosure……”.JG did not continue to pursue his researchon laryngeal mechanisms. He got involved inother projects without ever publishing enoughin refereed journals to make his theory morewidely known in the speech community. Thereis clearly an important moral here for both seniorand junior members of our field.The question also arises: Was JG simplywrong? No, recent findings indicate that hiswork is still relevant and in no way obsolete.Figure 4. Effect of stød on F0 contour. Minimalpair of Danish words. Adapted from Fischer-Jørgensen’s (1989). Speaker JROne of the predictions of the theory is that theoccurrence of creaky voice ought to be associatedwith a low F0. Monsen and Engebretson(1977) asked five male and five female adultsto produce an elongated schwa vowel usingnormal, soft, loud, falsetto and creaky voice. Aspredicted every subject showed a consistentlylower F0 for the creaky voice (75 Hz for male,100 Hz for female subjects).Another expectation is that the Danish stødshould induce a rapid lowering of the F0 contour.Figure 4 taken from Fischer-Jørgensen’s(1989) article illustrates a minmal pair that conformsto that prediction.The best way of assessing the merit of JG’swork is to compare it with at the phonetic researchdone during the last decade by John Eslingwith colleagues and students at the Universityof Victoria in Canada. Their experimentalobservations will undoubtedly change and expandour understanding of the role played bythe pharynx and the larynx in speech. Evidentlythe physiological systems for protective closure,swallowing and respiration are re-used in articulationand phonation to an extent that is notyet acknowledged in current standard phoneticframeworks ((Esling 1996, 2005, Esling & Harris2005, Moisik 2008, Moisik & Esling 2007,Edmondson & Esling 2006)). For further refssee http://www.uvic.ca/ling/research/phonetics .In a recent thesis by Moisik (2008), an analysiswas performed of anatomical landmarks inlaryngoscopic images. To obtain a measure ofthe activity of the aryepiglottic sphincter mechanismMoisik used an area bounded by thearyepiglottic folds and epiglottic tubercle (redregion (solid outline) top of Figure 5). Hisquestion was: How does it vary across variousphonatory conditions? The two diagrams in thelower half of the figure provide the answer.Along the ordinate scales: the size of theobserved area (in percent relative to maximumvalue). The phonation types and articulationsalong the x-axes have been grouped into twosets: Left: conditions producing large areas thusindicating little or no activity in the aryepiglotticsphincter; Right: a set with small area valuesindicating strong degrees of aryepiglottic constriction.JG’s observations appear to matchthese results closely.ConclusionsJG hypothesized that “laryngealization in combinationwith low vocalis activity is used as amechanism for producing a low pitch voice”and that the proposed relationships between“low tone, laryngealization and glottal stopmay give a better understanding of dialectalvariations and historical changes in languagesusing low tone”.10
<strong>Proceedings</strong>, FONETIK <strong>2009</strong>, Dept. of Linguistics, Stockholm UniversityCurrent evidence lends strong support to hisview of how the larynx works in speech. Hisobservations and analyses still appear worthy ofbeing further explored and tested. In particularwith regard to F0 control. JG would have enjoyedRiad (<strong>2009</strong>).Figure 5. Top: Anatomical landmarks in laryngoscopicimage. Note area bounded by the aryepiglotticfolds and epiglottic tubercle (red region (solidoutline). Bottom part: Scales along y-axes: Size ofthe observed area (in percent relative to maximumvalue). Left: conditions with large areas indicatinglittle activity in the aryepiglottic sphincter; Right:Small area values indicating stronger of aryepiglotticconstriction. Data source: Moisik (2008).AcknowledgementsI am greatly indebted to John Esling and ScottMoisik of the University of Victoria for permissionto use their work.ReferencesEsling J H (1996): “Pharyngeal consonants andthe aryepiglottic sphincter”, Journal of theInternational Phonetic Association 26:65-88.Esling J H (2005): “There are no back vowels:the laryngeal articulator model”, CanadianJournal of Linguistics/Revue canadienne delinguistique 50(1/2/3/4): 13–44Esling J H & Harris J H (2005): “States of theglottis: An articulatory phonetic modelbased on laryngoscopic observations”, 345-383 in Hardcastle W J & Mackenzie Beck J(eds): A Figure of Speech: A Festschrift forJohn Laver, LEA:New Jersey.Edmondson J A & Esling J H (2006): “Thevalves of the throat and their functioning intone, vocal register and stress: laryngoscopiccase studies”, Phonology 23, 157–191Fischer-Jørgensen E (1989): “Phonetic analysisof the stød in Standard Danish”, Phonetica46: 1–59.Gordon M & Ladefoged P (2001): “Phonationtypes: a cross-linguistic overview”, J Phonetics29:383-406.Ladefoged P (1967): Preliminaries to linguisticphonetics, University of Chicago Press:Chicago.Lindqvist-Gauffin J (1969): "Laryngeal mechanismsin speech", STL-QPSR 2-3 26-31.Lindqvist-Gauffin J (1972): “A descriptivemodel of laryngeal articulation in speech”,STL-QPSR 13(2-3) 1-9.Moisik S R (2008): A three-dimensional Modelof the larynx and the laryngeal constrictormechanism:, M.A thesis, University of Victoria,Canada.Moisik S R & Esling J H (2007): "3-D auditory-articulatorymodeling of the laryngealconstrictor mechanism", in J. Trouvain &W.J. Barry (eds): <strong>Proceedings</strong> of the 16thInternational Congress of PhoneticSciences, vol. 1 (pp. 373-376), Saarbrücken:Universität des Saarlandes.Monsen R B & Engebretson A M (1977):“Study of variations in the male and femaleglottal wave”, J Acoust Soc Am vol 62(4),981-993.Negus V E (1949): The Comparative Anatomyand Physiology of the Larynx, Hafner:NY.Negus V E (1957): ”The mechanism of the larynx”,Laryngoscope, vol LXVII No 10,961-986.Pressman J J (1954): ” Sphincters of the larynx”,AMA Arch Otolaryngol 59(2):221-36.Riad T (<strong>2009</strong>): “Eskilstuna as the tonal key toDanish”, <strong>Proceedings</strong> FONETIK <strong>2009</strong>,Dept. of Linguistics, Stockholm University11
<strong>Proceedings</strong>, FONETIK <strong>2009</strong>, Dept. of Linguistics, Stockholm UniversityEskilstuna as the tonal key to DanishTomas RiadDepartment of Scandinavian languages, Stockholm UniversityAbstractThis study considers the distribution ofcreak/stød in relation to the tonal profile in thevariety of Central Swedish (CSw) spoken inEskilstuna. It is shown that creak/stød correlateswith the characteristic HL fall at the endof the intonation phrase and that this fall hasearlier timing in Eskilstuna, than in the standardvariety of CSw. Also, a tonal shift at theleft edge in focused words is seen to instantiatethe beginnings of the dialect transition to theDalabergslag (DB) variety. These features fitinto the general hypothesis regarding the originof Danish stød and its relation to surroundingtonal dialects (Riad, 1998a). A laryngealmechanism, proposed by Jan Gauffin, whichrelates low F0, creak and stød is discussed byBjörn Lindblom in a companion paper (thisvolume).BackgroundAccording to an earlier proposal (Riad, 1998a;2000ab), the stød that is so characteristic ofStandard Danish has developed from a previoustonal system, which has central properties incommon with present-day Central Swedish, asspoken in the Mälardal region. This diachronicorder has long been the standard view (Kroman,1947; Ringgaard, 1983; Fischer-Jørgensen, 1989; for a different view, cf.Libermann, 1982), but serious discussion regardingthe phonological relation between thetonal systems of Swedish and Norwegian onthe one hand, and the Danish stød system onthe other, is surprisingly hard to find. Presumably,this is due to both the general lack of pan-Scandinavian perspective in earlier Norwegianand Swedish work on the tonal dialectology(e.g. Fintoft et al., 1978; Bruce and Gårding,1978), and the reification of stød as a non-tonalphonological object in the Danish research tradition(e.g. Basbøll 1985; 2005).All signs, however, indicate that stød shouldbe understood in terms of tones, and this goesfor phonological representation, as well as fororigin and diachronic development. There arethe striking lexical correlations between thesystems, where stød tends to correlate with accent1 and absence of stød with accent 2. Thereis the typological tendency for stød to occur inthe direct vicinity of tonal systems (e.g. Baltic,SE Asian, North Germanic). Also, the phoneticconditioning of stød (Da. stød basis), that is,sonority and stress, resembles that of some tonalsystems, e.g. Central Franconian (Gussenhovenand van der Vliet, 1999; Peters, 2007).Furthermore, there is the curious markednessreversal as the lexically non-correlating stødand accent 2 are usually considered the markedmembers of their respective oppositions. 1 Thisindicates that the relation between the systemsis not symmetrical. Finally, there is phoneticwork that suggests a close relationship betweenF0 lowering, creak and stød (Gauffin, 1972ab),as discussed in Lindblom (this volume).The general structure of the hypothesis aswell as several arguments are laid out in somedetail in Riad (1998a; 2000ab), where it isclaimed that all the elements needed to reconstructthe origin of Danish stød can be found inthe dialects of the Mälardal region in Sweden:facultative stød, loss of distinctive accent 2, anda tonal shift from double-peaked to singlepeakedaccent 2 in the neighbouring dialects.The suggestion, then, is that the Danish systemwould have originated from a tonal dialect typesimilar to the one spoken today in EasternMälardalen. The development in Danish is dueto a slightly different mix of the crucial features.In particular, the loss of distinctive accent2 combined with the grammaticalization of stødin stressed syllables.The dialect-geographic argument supportsparallel developments. The dialects of Dalabergslagenand Gotland are both systematicallyrelated to the dialect of Central Swedish. Whilethe tonal grammar is the same, the tonal makeupis different and this difference can be understoodas due to a leftward tonal shift (Riad,1998b). A parallel relation would hold betweenthe original, but now lost, tonal dialect of Sjællandin Denmark and the surrounding dialects,which remain tonal to this day: South Swedish,South Norwegian and West Norwegian. Theseare all structurally similar tonal types. It is uncontested,historically and linguistically, thatSouth Swedish and South Norwegian have receivedmany of their distinctive characteristicsfrom Danish, and the prosodic system is no ex-12
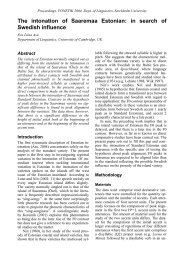
<strong>Proceedings</strong>, FONETIK <strong>2009</strong>, Dept. of Linguistics, Stockholm Universityception to that development. Furthermore, thetonal system of South Swedish, at least, is sufficientlydifferent from its northern neighbours,the Göta dialects, to make a direct prosodicconnection unlikely (Riad, 1998b; 2005). Thisexcludes the putative alternative hypothesis.In this contribution, I take a closer look atsome of the details regarding the relationshipbetween creak/stød and the constellation oftones. The natural place to look is the dialect ofEskilstuna, located to the west of Stockholm,which is key to the understanding of the phoneticdevelopment of stød, the tonal shift in thedialect transition from CSw to DB, and thegeneralization of accent 2. I have used part ofthe large corpus of interviews collected byBengt Nordberg and his co-workers in the 60’s,and by Eva Sundgren in the 90’s, originally forthe purpose of large-scale sociolinguistic investigation(see e.g. Nordberg, 1969; Sundgren,2002). All examples in this article are takenfrom Nordberg’s recordings (cf. Pettersson andForsberg, 1970). Analysis has been carried outin Praat (Boersma and Weenink, <strong>2009</strong>).Creak/stød as a correlate of HLFischer-Jørgensen’s F0 graphs of minimalstød/no-stød pairs show that stød cooccurs witha sharp fall (1989, appendix IV). We take HLto be the most likely tonal configuration for theoccurrence of stød, the actual correlate being aL target tone. When the HL configuration occursin a short space of time, i.e. under compression,and with a truly low target for the Ltone, creak and/or stød may result. A hypothesisfor the phonetic connection between thesephenomena has been worked out by Jan Gauffin(1972ab), cf. Lindblom (<strong>2009</strong>a; this volume).The compressed HL contour, the extra lowL and the presence of creak/stød are all propertiesthat are frequent in speakers of theEskilstuna variety of Central Swedish. Bleckert(1987, 116ff.) provides F0 graphs of the sharptonal fall, which is known as ‘Eskilstuna curl’(Sw. eskilstunaknorr) in the folk terminology.Another folk term, ‘Eskilstuna creak’ (Sw.eskilstunaknarr), picks up on the characteristiccreak. These terms are both connected with theHL fall which is extra salient in Eskilstuna aswell as several other varieties within the socalled‘whine belt’ (Sw. gnällbältet), comparedwith the eastward, more standard CentralSwedish varieties around Stockholm. Clearly,part of the salience comes directly from themarked realizational profile of the fall, butthere are also distributional factors that likelyadd to the salience, one of which is the veryfact that the most common place for curl is inphrase final position, in the fall from the focalH tone to the boundary L% tone.Below are a few illustrations of typical instancesof fall/curl, creak and stød. Informantsare denoted with ‘E’ for ‘Eskilstuna’ and anumber, as in Pettersson and Forsberg (1970,Table 4), with the addition of ‘w’ or ‘m’ for‘woman’ and ‘man’, respectively.Pitch (Hz)5004003002001000ba- ge- ˈri- et’the bakery’L H L , , , ,0 0.7724Time (s)Figure 1. HL% fall/curl followed by creak (marked‘, , ,’ on the tone tier). E149w: bage 1ˈriet ‘the bakery’.Pitch (Hz)5004003002001000jo de tyc- ker ja ä ˈkul’yes, I think that’s fun’H , , L , ,0 1.125Time (s)Figure 2. HL% fall interrupted by creak. E106w:1ˈkul ‘fun’.Pitch (Hz)5004003002001000å hadd en ˈbä- lg’and had (a) bellows’H o L0 1.439Time (s)Figure 3. HL% fall interrupted by stød (marked by‘o’ on the tone tier). E147w: 1ˈbälg ‘bellows’.13
<strong>Proceedings</strong>, FONETIK <strong>2009</strong>, Dept. of Linguistics, Stockholm UniversityAs in Danish, there is often a tonal ’rebound’after the creak/stød, visible as a resumedF0, but not sounding like rising intonation.A striking case is given in Figure 4, wherethe F0 is registered as rising to equally highfrequency as the preceding H, though the auditoryimpression and phonological interpretationis L%.Pitch (Hz)5004003002001000till exempel ke- ˈmi’for example chemistry’H , , L , ,0 1.222Time (s)Figure 4. HL% fall with rebound after creak.E106w: ke 1ˈmi ‘chemistry’.Creaky voice is very common in the speechof several informants, but both creak and stødare facultative properties in the dialect. UnlikeDanish, then, there is no phonologization ofstød in Eskilstuna. Also, while the most typicalcontext for creak/stød is the HL% fall from focalto boundary tone, there are instances whereit occurs in other HL transitions. Figure 5 illustratesa case where there are two instances ofcreak/stød in one and the same word.5004003002001000dä e nog skillnad kanskeom man får sy på (...) ˈhe- la’there’s a difference perhaps if you get to sew on (...) the whole thing’H, ,L, , H o L0 2.825Time (s)Figure 5. Two HL falls interrupted by creak andstød. E118w: 2ˈhela ‘the whole’. Stød in an unstressedsyllable.It is not always easy to make a categoricaldistinction between creak and stød in thevowel. Often, stød is followed by creaky voice,and sometimes creaky voice surrounds a glottalclosure. This is as it should be, if we, followingGauffin (1972ab), treat stød and creak as adjacenton a supralaryngeal constriction continuum.Note in this connection that the phenomenonof Danish stød may be realized both as acreak or with a complete closure (Fischer-Jørgensen 1989, 8). In Gauffin’s proposal, thesupralaryngeal constriction, originally a propertyused for vegetative purposes, could beused also to bring about quick F0 lowering, cf.Lindblom (<strong>2009</strong>a; this volume). For our purposesof connecting a tonal system with a stødsystem, it is important to keep in mind thatthere exists a natural connection between Ltone, creaky voice and stød.The distribution of HL%The HL% fall in Eskilstuna exhibits some distributionaldifferences compared with standardCentral Swedish. In the standard variety ofCentral Swedish (e.g. the one described inBruce, 1977; Gussenhoven, 2004), the tonalstructure of accent 1 is LHL% where the first Lis associated in the stressed syllable. The sametonal structure holds in the latter part of compounds,where the corresponding L is associatedin the last stressed syllable. This is schematicallyillustrated in Figure 6.1ˈm å l e t2ˈm e l l a n ˌm å l e t‘the goal’‘the snack’Figure 6. The LHL% contour in standard CSw accent1 simplex and accent 2 compounds.In both cases the last or only stress beginsL, after which there is a HL% fall. In theEskilstuna variety, the timing of the final falltends to be earlier than in the more standardCSw varieties. Often, it is not the first L ofLHL% which is associated, but rather the Htone. This holds true of both monosyllabic simplexforms and compounds.Pitch (Hz)5004003002001000då va ju nästan hela ˈstan eh’then almost the entire town was...eh’H L , , ,0 2.231Time (s)Figure 7. Earlier timing of final HL% fall in simplexaccent 1. E8w: 1ˈstan ‘the town’.14
<strong>Proceedings</strong>, FONETIK <strong>2009</strong>, Dept. of Linguistics, Stockholm UniversityPitch (Hz)5004003002001000såna därsom intehade nå ˈhus- ˌrum’such people who did not have a place to stay’L H , , L , ,0 2.128Time (s)Figure 8. Earlier timing of final HL% fall in compoundaccent 2. E8w: 2ˈhusˌrum ‘place to stay’Another indication of the early timing ofHL% occurs in accent 2 trisyllabic simplexforms, where the second peak occurs with greatregularity in the second syllable.5004003002001000den var så ˈgri- pan- de (...) hela ˈhand- ling-en å så där’it was so moving (...) the entire plot and so on’H L H L H LH L , , ,0 3.14Time (s)Figure 9. Early timing of HL% in trisyllabic accent2 forms. E106w: 2ˈgripande ‘moving’, 2ˈhandlingen‘the plot’.In standard CSw the second peak is variablyrealized in either the second or third syllable(according to factors not fully worked out), afeature that points to a southward relationshipwith the Göta dialects, where the later realizationis rule.The compression and leftward shift at theend of the focused word has consequences alsofor the initial part of the accent 2 contour. Thelexical or postlexical accent 2 tone in CSw isH. In simplex forms, this H tone is associatedto the only stressed syllable (e.g. Figure 5 2ˈhela‘the whole’), and in compounds the H tone isassociated to the first stressed syllable (Figure6). In some of the informants’ speech, there hasbeen a shift of tones at this end of the focusdomain, 2ˈhusˌrumtoo. We can see this in the compound‘place to stay’ in Figure 8. The firststress of the compound is associated to a L tonerather than the expected H tone of standardCSw. In fact, the H tone is missing altogether.Simplex accent 2 exhibits the same property,cf. Figure 10.Pitch (Hz)5004003002001000där åkte vi <strong>för</strong>r nn å ˈba- da’we went there back then to swim’, , , L H L0 2.271Time (s)Figure 10. Lexical L tone in the main stress syllableof simplex accent 2. Earlier timing of final HL%fall. E8w: 2ˈbada ‘swim’.Listening to speaker E8w (Figures 7, 8, 10,11), one clearly hear some features that arecharacteristic of the Dalabergslag dialect (DB),spoken northwestward of Eskilstuna. In thisdialect, the lexical/post-lexical tone of accent 2is L, and the latter part of the contour is HL%.However, it would not be right to simply classifythis informant and others sounding muchlike her as DB speakers, as the intonation incompounds is different from that of DB proper.In DB proper there is a sharp LH rise on theprimary stress of compounds, followed by aplateau (cf. Figure 12). This is not the case inthis Eskilstuna variety where the rise does notoccur until the final stress. 2 The pattern is thesame in longer compounds, too, as illustrated inFigure 11.Pitch (Hz)4003002001000i kö flera timmar <strong>för</strong> att få enˈpalt-ˌbröds-ˌka- ka’in a queue for several hours to get a palt bread loaf’L H , ,L, ,0 2.921Time (s)Figure 11. Postlexical L tone in the main stress syllableof compound accent 2. E8w: 2ˈpaltˌbrödsˌkaka‘palt bread loaf’.Due to the extra space afforded by a finalunstressed syllable in Figure 11, the final fall islater timed than in Figure 8, but equally abrupt.15
<strong>Proceedings</strong>, FONETIK <strong>2009</strong>, Dept. of Linguistics, Stockholm UniversityVariation in Eskilstuna and the reconstructionof DanishThe variation among Eskilstuna speakers withregard to whether they sound more like theCSw or DB dialect types can be diagnosed in asimple way by looking at the lexical/postlexicaltone of accent 2. In CSw it is H (cf. Figure5), in DB it is L (cf. Figure 10). Interestingly,this tonal variation appears to co-varywith the realization of creak/stød, at least forthe speakers I have looked at so far. The generalizationappears to be that the HL% fall ismore noticeable with the Eskilstuna speakersthat sound more Central Swedish, that is,E106w, E47w, E147w, E67w and E118w. Thespeakers E8w, E8m and E149w sound morelike DB and they exhibit less pronounced falls,and less creak/stød. This patterning can be understoodin terms of compression.According to the general hypothesis, the DBvariety as spoken further to the northwest ofEskilstuna is a response to the compression instantiatedby curl, hence that the DB varietyspoken has developed from an earlierEskilstuna-like system (Riad 2000ab). By shiftingthe other tones of the focus contour to theleft, the compression is relieved. As a consequence,creak/stød should also be expected tooccur less regularly. The relationship betweenthe dialects is schematically depicted for accent2 simplex and compounds in Figure 12. Arrowsindicate where things have happened relative tothe preceding variety.SimplexStandard CSwEskilstuna CSwEskilstuna DBDB properCompoundFigure 12. Schematic picture of the tonal shift inaccent 2 simplex and compounds.The tonal variation within Eskilstuna thusallows us to tentatively propose an order of diachronicevents, where the DB variety should beseen as a development from a double-peak systemlike the one in CSw, i.e. going from top tobottom in Figure 12. Analogously, we wouldassume a similar relationship between the formertonal dialect in Sjælland and the surroundingtonal dialects of South Swedish, SouthNorwegian and West Norwegian.The further development within SjællandDanish, involves the phonologization of stødand the loss of the tonal distinction. The reconstructionof these events finds support in thephenomenon of generalized accent 2, alsofound in Eastern Mälardalen. Geographically,the area which has this pattern is to the east ofEskilstuna. The border between curl and generalizedaccent 2 is crisp and the tonal structure isclearly CSw in character. The loss of distinctiveaccent 2 by generalization of the pattern toall relevant disyllables can thus also be connectedto a system like that found in Eskilstuna,in particular the variety with compression andrelatively frequent creak/stød (Eskilstuna CSwin Figure 12). For further aspects of the hypothesisand arguments in relation to Danish,cf. Riad (1998a, 2000ab).ConclusionThe tonal dialects within Scandinavia are quitetightly connected, both as regards tonal representationand tonal grammar, a fact that ratherlimits the number of possible developments(Riad 1998b). This makes it possible to reconstructa historical development from a now losttonal system in Denmark to the present-daystød system. We rely primarily on the rich tonalvariation within the Eastern Mälardal region,where Eskilstuna and the surrounding varietiesprovide several phonetic, distributional, dialectological,geographical and representationalpieces of the puzzle that prosodic reconstructioninvolves.AcknowledgementsI am indebted to Bengt Nordberg for providingme with cds of his 1967 recordings inEskilstuna. Professor Nordberg has been of invaluablehelp in selecting representative informantsfor the various properties that I waslooking for in this dialect.Notes1. For a different view of the markedness issue,cf. Lahiri, Wetterlin, and Jönsson-Steiner(2005)2. There are other differences (e.g. in the realizationof accent 1), which are left out of thispresentation.16
<strong>Proceedings</strong>, FONETIK <strong>2009</strong>, Dept. of Linguistics, Stockholm UniversityReferencesBasbøll H. (1985) Stød in Modern Danish.Folia Linguistica XIX.1–2, 1–50.Basbøll H. (2005) The Phonology of Danish(The Phonology of the World’s Languages).Oxford: Oxford University Press.Bleckert L. (1987) Centralsvensk diftongeringsom satsfonetiskt problem. (Skrifter utgivnaav institutionen <strong>för</strong> nordiska språk vid Uppsalauniversitet 21) Uppsala.Boersma P. and Weenink D. (<strong>2009</strong>) Praat: doingphonetics by computer (Version 5.1.04)[Computer program]. Retrieved in April<strong>2009</strong> from http://www.praat.org/.Bruce G. and Gårding E. (1978) A prosodic typologyfor Swedish dialects. In Gårding E.,Bruce G., and Bannert R. (eds) Nordic prosody.Papers from a symposium (Travaux del‘Institut de Linguistique de Lund 13) LundUniversity, 219–228.Fintoft K., Mjaavatn P.E., Møllergård E., andUlseth B. (1978) Toneme patterns in Norwegiandialects. In Gårding E., Bruce G.,and Bannert R. (eds) Nordic prosody. Papersfrom a symposium (Travaux del‘Institut de Linguistique de Lund 13) LundUniversity, 197–206.Fischer-Jørgensen E. (1989) A Phonetic studyof the stød in Standard Danish. Universityof Turku. (revised version of ARIPUC 21,56–265).Gauffin [Lindqvist] J. (1972) A descriptivemodel of laryngeal articulation in speech.Speech Transmission Laboratory QuarterlyProgress and Status Report (STL-QPSR)(Dept. of Speech Transmission, Royal Instituteof Technology, Stockholm) 2–3/1972,1–9.Gauffin [Lindqvist] J. (1972) Laryngeal articulationstudied on Swedish subjects. STL-QPSR 2–3, 10–27.Gussenhoven C. (2004) The Phonology ofTone and Intonation. Cambridge: CambridgeUniversity Press.Gussenhoven C. and van der Vliet P. (1999)The phonology of tone and intonation in theDutch dialect of Venlo. Journal of Linguistics35, 99–135.Kroman, E. (1947) Musikalsk akcent i dansk.København: Einar Munksgaard.Lahiri A., Wetterlin A., and Jönsson-Steiner E.(2005) Lexical specification of tone inNorth Germanic. Nordic Journal of Linguistics28, 1, 61–96.Liberman, A. (1982) Germanic Accentology.Vol. I: The Scandinavian languages. Minneapolis:University of Minnesota Press,.Lindblom B. (to appear) Laryngeal machanismsin speech: The contributions of Jan Gauffin.Logopedics Phoniatrics Vocology. [acceptedfor publication]Lindblom B. (this volume) F0 lowering, creakyvoice, and glottal stop: Jan Gauffin’s accountof how the larynx is used in speech.Nordberg B. (1969) The urban dialect ofEskilstuna, methods and problems. FUMSRapport 4, Uppsala University.Peters J. (2007) Bitonal lexical pitch accents inthe Limburgian dialect of Borgloon, InRiad, T. and Gussenhoven C. (eds) Tonesand Tunes, vol 1. Typological Studies inWord and Sentence Prosody, 167–198.(Phonology and Phonetics). Berlin: Moutonde Gruyter.Pettersson P. and Forsberg K. (1970) Beskrivningoch register över Eskilstunainspelningar.FUMS Rapport 10, Uppsala University.Riad T. (1998a) Curl, stød and generalized accent2. <strong>Proceedings</strong> of <strong>Fonetik</strong> 1998 (Dept.of Linguistics, Stockholm University) 8–11.Riad T. (1998b) Towards a Scandinavian accenttypology. In Kehrein W. and Wiese R.(eds) Phonology and Morphology of theGermanic Languages, 77–109 (LinguistischeArbeiten 386) Tübingen: Niemeyer.Riad T. (2000a) The origin of Danish stød. InLahiri A. (ed) Analogy, Levelling andMarkedness. Principles of change in phonologyand morphology. Berlin/New York:Mouton de Gruyter, 261–300.Riad T. (2000b) Stöten som aldrig blev av –generaliserad accent 2 i Östra Mälardalen.Folkmålsstudier 39, 319–344.Riad T. (2005) Historien om tonaccenten. InFalk C. and Delsing L.-O. (eds), Studier isvensk språkhistoria 8, Lund: Studentlitteratur,1–27.Ringgaard K. (1983) Review of Liberman(1982). Phonetica 40, 342–344.Sundgren E. (2002) Återbesök i Eskilstuna. Enundersökning av morfologisk variation och<strong>för</strong>ändring i nutida talspråk. (Skrifter utgivnaav <strong>Institutionen</strong> <strong>för</strong> nordiska språk vidUppsala universitet 56) Uppsala.17
<strong>Proceedings</strong>, FONETIK <strong>2009</strong>, Dept. of Linguistics, Stockholm UniversityFormant transitions in normal and disordered speech:An acoustic measure of articulatory dynamicsBjörn Lindblom 1 , Diana Krull 1 , Lena Hartelius 2 & Ellika Schalling 31 Department of Linguistics, Stockholm University2 Institute of Neuroscience and Physiology, University of Gothenburg3 Department of Logopedics and Phoniatrics, CLINTEC, Karolinska Institute, Karolinska UniversityHospital, HuddingeAbstract.This paper presents a method for numericallyspecifying the shape and speed of formant trajectories.Our aim is to apply it to groups ofnormal and dysarthric speakers and to use it tomake comparative inferences about the temporalorganization of articulatory processes.To illustrate some of the issues it raises we herepresent a detailed analysis of speech samplesfrom a single normal talker. The procedureconsists in fitting damped exponentials to transitionstraced from spectrograms and determiningtheir time constants. Our first results indicatea limited range for F2 and F3 time constants.Numbers for F1 are more variable andindicate rapid changes near the VC and CVboundaries. For the type of speech materialsconsidered, time constants were found to be independentof speaking rate. Two factors arehighlighted as possible determinants of the patterningof the data: the non-linear mappingfrom articulation to acoustics and the biomechanicalresponse characteristics of individualarticulators. When applied to V-stop-V citationforms the method gives an accurate descriptionof the acoustic facts and offers a feasible wayof supplementing and refining measurements ofextent, duration and average rate of formantfrequency change.Background issuesSpeaking rateOne of the issues motivating the present studyis the problem of how to define the notion of‘speaking rate’. Conventional measures ofspeaking rate are based on counting the numberof segments, syllables or words per unit time.However, attempts to characterize speech ratein terms of ‘articulatory movement speed’ appearto be few, if any. The question arises: Arevariations in the number of phonemes persecond mirrored by parallel changes in ‘rate ofarticulatory movement’? At present it does notseem advisable to take a parallelism betweenmovement speed and number of phonetic unitsper second for granted.Temporal organization: Motor control innormal and dysarthric speechMotor speech disorders (dysarthrias) exhibit awide range of articulatory difficulties: There aredifferent types of dysarthria depending on thespecific nature of the neurological disorder.Many dysarthric speakers share the tendency toproduce distorted vowels and consonants, tonasalize excessively, to prolong segments andthereby disrupt stress patterns and to speak in aslow and labored way (Duffy 2005). For instance,in multiple sclerosis and ataxic dysarthria,syllable durations tend to be longer andequal in duration (‘scanning speech’). Furthermoreinter-stress intervals become longer andmore variable (Hartelius et al 2000, Schalling2007).Deviant speech timing has been reported tocorrelate strongly with the low intelligibility indysarthric speakers. Trying to identify theacoustic bases of reduced intelligibility, investigatorshave paid special attention to the behaviorof F2 examining its extent, duration andrate of change (Kent et al 1989, Weismer et al1992, Hartelius et al 1995, Rosen et al 2008).Dysarthric speakers show reduced transitionextents, prolonged transitions and hence loweraverage rates of formant frequency change (flattertransition slopes).In theoretical and clinical phonetic work itwould be useful to be able to measure speakingrate defined both as movement speed and interms of number of units per second. Thepresent project attempts to address this objectivebuilding on previous acoustic analyses ofdysarthric speech and using formant pattern rateof change as an indirect window on articulatorymovement.18
<strong>Proceedings</strong>, FONETIK <strong>2009</strong>, Dept. of Linguistics, Stockholm UniversityMethodThe method is developed from observing thatformant frequency transitions tend to followsmooth curves roughly exponential in shape(Figure 1). Other approaches have been used inthe past (Broad & Fertig 1970). Stevens et al(1966) fitted parabolic curves to vowel formanttracks. Ours is similar to the exponential curvefitting procedure of Talley (1992) and Park(2007).Figure 1. Spectrogram of syllable [ga]. White circlesrepresent measurements of the F2 and F3 transitions.The two contours can be described numericallyby means of exponential curves (Eqs (1 and2).Mathematically the F2 pattern of Figure 1 canbe approximated by:F2(t) = (F2 L -F2 T )*e -αt + F2 T (1)where F2(t) is the observed course of the transition,F2 L and F2 T represent the starting point(‘F2 locus’) and the endpoint (‘F2 target’) respectively.The term e -αt starts out from a valueof unity at t=0 and approaches zero as t getslarger. The α term is the ‘time constant’ in thatit controls the speed with which e -αt approacheszero.At t=0 the value of Eq (1) is (F2 L -F2 T ) +F2 T = F2 L . When e-αt is near zero, F2(t) is takento be equal to F2 T .To capture patterns like the one for F3 inFigure 1 a minor modification of Eq (1) is requiredbecause F3 frequency increases ratherthan decays. This is done by replacing e -αt by itscomplement (1- e -αt ). We then obtain the followingexpression:F3(t) = (F3 L -F3 T )*(1-e -αt ) + F3 T (2)Speech materialsAt the time of submitting this report recordingsand analyses are ongoing. Our intention is toapply the proposed measure to both normal anddysarthric speakers. Here we present some preliminarynormal data on consonant and vowelsequences occurring in V:CV and VC:V frameswith V=[i ɪ e ɛ a ɑ ɔ o u] and C=[b d g]. As aninitial goal we set ourselves the task of describinghow the time constants for F1, F2 and F3vary as a function of vowel features, consonantplace (articulator) and formant number.The first results come from a normal malespeaker of Swedish reading lists with randomizedVC:V and VC:V words each repeatedfive times. No carrier phrase was used.Since one of the issues in the project concernsthe relationship between ‘movementspeed’ (as derived from formant frequency rateof change) and ‘speech rate’ (number of phonemesper second) we also had subjects producerepetitions of a second set of test words: dag,dagen, Dagobert [ˈdɑ:gɔbæʈ], dagobertmacka.This approach was considered preferable toasking subjects to “vary their speaking rate”.Although this instruction has been used frequentlyin experimental phonetic work it hasthe disadvantage of leaving the speaker’s use of‘over-‘ and ‘underarticulation’ - the ‘hyperhypo’dimension –uncontrolled (Lindblom1990). By contrast the present alternative is attractivein that the selected words all have thesame degree of main stress (‘huvudtryck’) onthe first syllable [dɑ:(g)-]. Secondly speakingrate is implicitly varied by means of the ‘wordlength effect’ which has been observed in manylanguages (Lindblom et al 1981). In the presenttest words it is manifested as a progressiveshortening of the segments of [dɑ:(g)-] whenmore and more syllables are appended.Determining time constantsTo measure transition time constants the followingprotocole was followed.The speech samples were digitized and examinedwith the aid of wide-band spectrographicdisplays in Swell. [FFT points 55/1024,Bandwidth 400 Hz, Hanning window 4 ms].19
<strong>Proceedings</strong>, FONETIK <strong>2009</strong>, Dept. of Linguistics, Stockholm UniversityFor each sample the time courses of F1, F2 andF3 were traced by clicking the mouse along theformant tracks. Swell automatically produced atwo-column table with the sample’s time andfrequency values.The value of α was determined after rearrangingand generalizing Eq (1) as follows:(F n (t) - F nT )/(F nL - F nT ) = e -αt (3)and taking the natural logarithm of both sideswhich produces:ln[(F n (t) - F nT )/(F nL - F nT )] = -αt (4)Eq (4) suggests that, by plotting the logarithmof the Fn(t) data – normalized to vary between1 and zero – against time, a linear cluster of datapoints would be obtained (provided that thetransition is exponential).A straight line fitted to the points so that itruns through the origin would have a slope of α.This procedure is illustrated in Figure 2.Figure 3. Measured data for 5 repetitions of [da](black dots) produced by male speaker. In red: Exponentialcurves derived .from the average formantspecificvalues of locus and target frequencies andtime constants.ResultsHigh r squared scores were observed (r2>0.90)indicating that exponential curves were goodapproximations to the formant transitions.Figure 2. Normalized formant transition: Top: linearscale running between 1.0 and zero; (Bottom):Same data on logarithmic scale. The straight-linepattern of the data points allows us to compute theslope of the line. This slope determines the value ofthe time constant.Figure 3 gives a representative example of howwell the exponential model fits the data. Itshows the formant transitions in [da]. Measurementsfrom 5 repetitions of this syllablewere pooled for F1, F2 and F3. Time constantswere determined and plugged into the formantequations to generate the predicted formanttracks (shown in red).Figure 4. Formant time constants in V:CV andVC:V words plotted as a function of formant frequency(kHz). F1 (open triangles), F2 (squares) andF3 (circles). Each data point is the value derivedfrom five repetitions.The overall patterning of the time constants isillustrated in Figure 4. The diagram plots timeconstant values against frequency in all V:CVand VC:V words. Each data point is the valuederived from five repetitions by a single maketalker. Note that, since decaying exponentialsare used, time constants come out as negativenumbers and all data points end up below thezero line.20
<strong>Proceedings</strong>, FONETIK <strong>2009</strong>, Dept. of Linguistics, Stockholm UniversityF1 shows the highest negative values and thelargest range of variation. F2 and F3 are seen tooccupy a limited range forming a horizontalpattern independent of frequency.A detailed analysis of the F1 transition suggestspreliminarily that VC transitions tend tobe somewhat faster than CV transitions; VC:data show larger values than VC measurements.Figure 5.Vowel duration (left y-axis) and .F2 timeconstants (right y-axis) plotted as a function ofnumber of syllables per word.Figure 5 shows how the duration of the vowel[ɑ:] in [dɑ:(g)-] varies with word length. Usingthe y-axis on the left we see that the duration ofthe stressed vowel decreases as a function ofthe number of syllables that follow. This compressioneffect implies that the ‘speaking rateincreases with word length.The time constant for F2 is plotted along theright ordinate. The quasi-horizontal pattern ofthe open square symbols indicates that timeconstant values are not influenced by the rateincrease.DiscussionNon-linear acoustic mappingIt is important to point out that the proposedmeasure can only give us an indirect estimate ofarticulatory activity. One reason is the nonlinearrelationship between articulation andacoustics which for identical articulatorymovement speeds could give rise to differenttime constant values.The non-linear mapping is evident in thehigh negative numbers observed for F1. Do weconclude that the articulators controlling F1(primarily jaw opening and closing) move fasterthan those tuning F2 (the tongue front-backmotions)? The answer is no.Studies of the relation between articulationand acoustics (Fant 1960) tell us that rapid F1changes are to be expected when the vocal tractgeometry changes from a complete stop closureto a more open vowel-like configuration. Suchabrupt frequency shifts exemplify the nonlinearnature of the relation between articulationand acoustics. Quantal jumps of this kind lie atthe heart of the Quantal Theory of Speech (Stevens1989). Drastic non-linear increases canalso occur in other formants but do not necessarilyindicate faster movements.Such observations may at first appear tomake the present method less attractive. On theother hand, we should bear in mind that thetransformation from articulation to acoustics isa physical process that constrains both normaland disordered speech production. Accordingly,if identical speech samples are compared itshould nonetheless be possible to draw validconclusions about differences in articulation.Figure 6: Same data as in Figure 4. Abscissa: Extentof F1, F2 or F3 transition (‘locus’–‘target’ distance).Ordinate: Average formant frequency rate ofchange during the first 15 msec of the transition.Formant frequency rates of change arepredictable from transition extents.As evident from the equations the determinationof time constants involves a normalizationthat makes them independent of the extent ofthe transition. The time constant does not sayanything about the raw formant frequency rateof change in kHz/seconds. However, the dataon formant onsets and targets and time constantsallow us to derive estimates of that dimensionby inserting the measured values intoEqs (1) and (2) and calculating ∆Fn/∆t at transitiononsets for a time window of ∆t=15 milliseconds.21
<strong>Proceedings</strong>, FONETIK <strong>2009</strong>, Dept. of Linguistics, Stockholm UniversityThe result is presented in Figure 6 with ∆F n /∆tplotted against the extent of the transition (locus-targetdistance). All the data from threeformants have been included. It is clear thatformant frequency rates of change form a fairlytight linear cluster of data points indicating thatrates for F2 and F3 can be predicted with goodaccuracy from transition extents. Some of datapoints for F1 show deviations from this trend.Those observations help us put the patternof Figure 3 in perspective. It shows that, wheninterpreted in terms of formant frequency rateof change (in kHz/seconds), the observed timeconstant patterning does not disrupt a basicallylawful relationship between locus-target distancesand rates of frequency change. A majorfactor behind this result is the stability of F2and F3 time constants.Figure 6 is interesting in the context of the‘gestural’ hypothesis which has recently beengiven a great deal of prominence in phonetics.It suggests that information on phonetic categoriesmay be coded in terms of formant transitiondynamics (e.g., Strange 1989). From the vantagepoint of a gestural perspective one mightexpect the data of the present project to showdistinct groupings of formant transition timeconstants in clear correspondence with phoneticcategories (e.g., consonant place, vowel features).As the findings now stand, that expectationis not borne out. Formant time constantsappear to provide few if any cues beyond thosepresented by the formant patterns sampled attransition onsets and endpoints.Articulatory processes in dysarthriaWhat would the corresponding measurementslook like for disordered speech? Previousacoustic phonetic work has highlighted a sloweraverage rate of F2 change in dysarthric speakers.For instance, Weismer et al (1992) investigatedgroups of subjects with amyotrophic lateralsclerosis and found that they showed loweraverage F2 slopes than normal: the more severethe disorder the lower the rate.The present type of analyses could supplementsuch reports by determining either howtime constants co-vary with changes in transitionextent and duration, or by establishing thatnormal time constants are maintained in dysarthricspeech. Whatever the answers providedby such research we would expect them topresent significant new insights into both normaland disordered speech motor processes.Clues from biomechanicsTo illustrate the meaning of the numbers inFigure 3 we make the following simplifiedcomparison. Assume that, on the average, syllableslast for about a quarter of a second. Furtherassume that a CV transition, or VC transition,each occupies half of that time. So formanttrajectories would take about 0.125seconds to complete. Mathematically a decayingexponential that covers 95% of its amplitudein 0.125 seconds has a time constant ofabout -25. This figure falls right in the middleof the range of values observed for F2 and F3 inFigure 3.The magnitude of that range of numbersshould be linked to the biomechanics of thespeech production system. Different articulatorshave different response times and the speechwave reflects the interaction of many articulatorycomponents. So far we know little about theresponse times of individual articulators.In normal subjects both speech and nonspeechmovements exhibit certain constant characteristics.Figure 7: Diagram illustrating the normalized ‘velocityprofile’ associated with three point-to-pointmovements of different extents.In the large experimental literature on voluntarymovement there is an extensively investigatedphenomenon known as “velocity profiles” (Figure7). For point-to-point movements (includinghand motions (Flash & Hogan 1985) andarticulatory gestures (Munhall et al 1985)) theseprofiles tend to be smooth and bell-shaped. Apparentlyvelocity profiles retain their geometricshape under a number of conditions: “…theform of the velocity curve is invariant undertransformations of movement amplitude, path,rate, and inertial load” (Ostry et al 1987:37).22
<strong>Proceedings</strong>, FONETIK <strong>2009</strong>, Dept. of Linguistics, Stockholm UniversityFigure 7 illustrates an archetypical velocity profilefor three hypothetical but realistic movements.The displacement curves have the sameshape but differ in amplitude. Hence, whennormalized with respect to displacement, theirvelocity variations form a single “velocity profile”which serves as a biomechanical “signature”of a given moving limb or articulator.What the notion of velocity profiles tells usthat speech and non-speech systems are stronglydamped and therefore tend to producemovements that are s-shaped. Also significantis the fact that the characteristics of velocityprofiles stay invariant despite changes in experimentalconditions. Such observations indicatethat biomechanical constancies are likely toplay a major role in constraining the variationof formant transition time constants both innormal and disordered speech.However, our understanding of the biomechanicalconstraints on speech is still incomplete.We do not yet fully know the extent towhich they remain fixed, or can be tuned andadapted to different speaking conditions, or aremodified in speech disorders (cf Forrest et al1989). It is likely that further work on comparingformant dynamics in normal and dysarthricspeech will throw more light on these issues.ReferencesBroad D J & Fertig R (1970): "Formantfrequencytrajectories in selected CVC syllablenuclei", J Acoust Soc Am 47, 1572-1582.Duffy J R (1995): Motor speech disorders:Substrates, differential diagnosis, and management,Mosby: St. Louis, USA.Fant G (1960): Acoustic theory of speech production,Mouton:The Hague.Forrest K, Weismer G & Turner G S (1989):"Kinematic, acoustic, and perceptual analysesof connected speech produced by Parkinsonianand normal geriatric adults", JAcoust Soc Am 85(6), 2608-2622.Hartelius L, Nord L & Buder E H (1995):“Acoustic analysis of dysarthria associatedwith multiple sclerosis”, Clinical Linguistics& Phonetics, Vol 9(2):95-120Flash T & Hogan N (1985): “The coordinationof arm movements: An experimentally confirmedmathematical model’”, J NeuroscienceVol 5(7). 1688-1703.Lindblom B, Lyberg B & Holmgren K (1981):Durational patterns of Swedish phonology:Do they reflect short-term memoryprocesses?, Indiana University LinguisticsClub, Bloomington, Indiana.Lindblom B (1990): "Explaining phonetic variation:A sketch of the H&H theory", inHardcastle W & Marchal A (eds): SpeechProduction and Speech Modeling, 403-439,Dordrecht:Kluwer.Munhall K G, Ostry D J & Parush A (1985):“Characteristics of velocity profiles ofspeech movements”, J Exp Psychology:Human Perception and Performance Vol11(4):457-474Ostry D J, Cooke J D & Munhall K G (1987):”Velocity curves of human arm and speechmovements”, Exp Brain Res 68:37-46Park S-H (2007): Quantifying perceptual contrast:The dimension of place of articulation,Ph D dissertation, University of Texasat AustinRosen K M, Kent R D, Delaney A L & Duffy JR (2006): “Parametric quantitative acousticanalysis of conversation produced by speakerswith dysarthria and healthy speakers”,JSLHR 49:395–411.Schalling E (2007): Speech, voice, languageand cognition in individuals with spinocerebellarataxia (SCA), Studies in Logopedicsand Phoniatrics No 12, Karolinska Institutet,Stockholm, SwedenStevens K N, House A S & Paul A P (1966):“Acoustical description of syllabic nuclei:an interpretation in terms of a dynamicmodel of articulation”, J Acoust Soc Am40(1), 123-132.Stevens K N (1989): “On the quantal nature ofspeech,” J Phonetics 17:3-46.Strange W (1989): “Dynamic specification ofcoarticulated vowels spoken in sentencecontext”, J Acoust Soc Am 85(5):2135-2153.Talley J (1992): "Quantitative characterizationof vowel formant transitions", J Acoust SocAm 92(4), 2413-2413.Weismer G, Martin R, Kent R D & Kent J F(1992): “Formant trajectory characteristicsof males with amyotrophic lateral sclerosis”,J Acoust Sec Am 91(2):1085-1098.23
<strong>Proceedings</strong>, FONETIK <strong>2009</strong>, Dept. of Linguistics, Stockholm UniversityEffects of vocal loading on the phonation and collisionthreshold pressuresLaura Enflo 1 , Johan Sundberg 1 and Friedemann Pabst 21 Department of Speech, Music & Hearing, Royal Institute of Technology, KTH, Stockholm, Sweden2 Hospital Dresden Friedrichstadt, Dresden, GermanyAbstractPhonation threshold pressures (PTP) havebeen commonly used for obtaining a quantitativemeasure of vocal fold motility. However, asthese measures are quite low, it is typically difficultto obtain reliable data. As the amplitudeof an electroglottograph (EGG) signal decreasessubstantially at the loss of vocal foldcontact, it is mostly easy to determine the collisionthreshold pressure (CTP) from an EGGsignal. In an earlier investigation (Enflo &Sundberg, forthcoming) we measured CTP andcompared it with PTP in singer subjects. Resultsshowed that in these subjects CTP was onaverage about 4 cm H 2 O higher than PTP. ThePTP has been found to increase during vocalfatigue. In the present study we compare PTPand CTP before and after vocal loading insinger and non-singer voices, applying a loadingprocedure previously used by co-authorFP. Seven subjects repeated the vowel sequence/a,e,i,o,u/ at an SPL of at least 80 dB @0.3 m for 20 min. Before and after the loadingthe subjects’ voices were recorded while theyproduced a diminuendo repeating the syllable/pa/. Oral pressure during the /p/ occlusionwas used as a measure of subglottal pressure.Both CTP and PTP increased significantly afterthe vocal loading.IntroductionSubglottal pressure, henceforth P sub , is one ofthe basic parameters for control of phonation. Ittypically varies with fundamental frequency ofphonation F0 (Ladefoged & McKinney, 1963& Cleveland & Sundberg, 1985). Titze (1992)derived an equation describing how the minimalP sub required for producing vocal fold oscillation,the phonation threshold pressure(PTP) varied with F0. He approximated thisvariation as:PTP = a + b*(F0 / MF0 ) 2 (1)where PTP is measured in cm H 2 O and MF0 isthe mean F0 for conversational speech (190 Hzfor females and 120 Hz for males). The constanta = 0.14 and the factor b = 0.06.Titze’s equation has been used in severalstudies. These studies have confirmed that vocalfold stiffness is a factor of relevance to PTP.Hence, it is not surprising that PTP tends to riseduring vocal fatigue (Solomon & DiMattia,2000 & Milbrath & Solomon, 2003 & Chang &Karnell, 2004). A lowered PTP should reflectgreater vocal fold stiffness, which is a clinicallyrelevant property; high motility must be associatedwith a need for less phonatory effort for agiven degree of vocal loudness.Determining PTP is often complicated. Onereason is the difficulty of accurately measuringlow values. Another complication is that severalindividuals find it difficult to produce theirvery softest possible sound. As a consequence,the analysis is mostly time-consuming and thedata are often quite scattered (Verdolini-Marston et al., 1990).At very low subglottal pressures, i.e. in verysoft phonation, the vocal folds vibrate, but withan amplitude so small that the folds never collide.If subglottal pressure is increased, however,vocal fold collision normally occurs. LikePTP, the minimal pressure required to initiatevocal fold collision, henceforth the collisionthreshold pressure (CTP), can be assumed toreflect vocal fold motility.CTP should be easy to identify by means ofan electroglottograph (EGG). During vocal foldcontact, the EGG signal can pass across theglottis, resulting in a high EGG amplitude.Conversely, the amplitude is low when the vocalfolds fail to make contact. In a previousstudy we measured PTP and CTP in a group ofsingers before and after vocal warm-up. Theresults showed that both PTP and CTP tendedto drop after the warm-up, particularly for themale voices (Enflo & Sundberg, forthcoming).The purpose of the present study was to explore24
<strong>Proceedings</strong>, FONETIK <strong>2009</strong>, Dept. of Linguistics, Stockholm Universitythe potential of the CTP measure in female andmale subjects before and after vocal loading.MethodExperimentSeven subjects, two female (F) and five male(M), were recruited as subjects. One female andone male were amateur singers, one of themales had some vocal training while the remainingsubjects all lacked vocal training.Their task was to repeat the syllable [pa:] withgradually decreasing vocal loudness and continuinguntil voicing had ceased, avoiding emphasisof the consonant /p/. The oral pressureduring the occlusion for the consonant /p/ wasaccepted as an approximation of Psub. The subjectsrepeated this task three to six times on allpitches of an F major triad that fitted into theirpitch range. The subjects were recorded in sittingposition in a sound treated booth.Two recording sessions were made, one beforeand one after vocal loading. This loadingconsisted of phonating the vowel sequence/a,e,i,o,u/ at an SPL of at least 80 dB @ 0.3 mduring 20 min. All subjects except the twosingers reported clear symptoms of vocal fatigueafter the vocal loading.Audio, oral pressure and EGG signals wererecorded, see Figure 1. The audio was pickedup at 30 cm distance by a condenser microphone(B&K 4003), with a power supply (B&K2812), set to 0 dB and amplified by a mixer,DSP Audio Interface Box from (Nyvalla DSP).Oral pressure was recorded by means of a pressuretransducer (Gaeltec Ltd, 7b) which thesubject held in the corner of the mouth. TheEGG was recorded with a two-channel electroglottograph(Glottal Enterprises EG 2), usingthe vocal fold contact area output and a lowfrequency limit of 40 Hz. This signal wasmonitored on an oscilloscope. Contact gel wasapplied to improve the skin contact. Each ofthese three signals was recorded on a separatetrack of a computer by means of the SoundswellSignal Workstation TM software (Core 4.0,Hitech Development AB, Sweden).Figure 1: Experimental setup used in the recordings.The audio signal was calibrated by recording asynthesized vowel sound, the sound pressurelevel (SPL) of which was determined by meansof a sound level recorder (OnoSokki) held nextto the recording microphone. The pressure signalwas calibrated by recording it while thetransducer was (1) held in free air and (2) immersedat a carefully measured depth in a glasscylinder filled with water.AnalysisThe analysis was performed using the SoundswellSignal Workstation. As the oral pressuretransducer picked up some of the oral sound,this signal was LP filtered at 50 Hz.After a 90 Hz HP filtering the EGG signalwas full-wave rectified, thus facilitating amplitudecomparisons. Figure 2 shows an exampleof the signals obtained.Figure 2: Example of the recordings analyzed showingthe audio, the HP filtered and rectified EGG andthe oral pressure signals (top, middle and bottomcurves). The loss of vocal fold contact, reflected asa sudden drop in the EGG signal amplitude, ismarked by the frame in the EGG and pressure signals.25
<strong>Proceedings</strong>, FONETIK <strong>2009</strong>, Dept. of Linguistics, Stockholm UniversityAs absence of vocal fold contact produces agreat reduction of the EGG signal amplitude,such amplitude reductions were easy to identifyin the recording. The subglottal pressures appearingimmediately before and after a suddenamplitude drop were assumed to lie just aboveand just below the CTP, respectively, so theaverage of these two pressures was accepted asthe CTP. For each subject, CTP was determinedin at least three sequences for each pitchand the average of these estimates was calculated.The same method was applied for determiningthe PTP.ResultsBoth thresholds tended to increase with F0, asexpected, and both were mostly higher after theloading. Figure 3 shows PTP and CTP beforeand after vocal loading for one of the untrainedmale subjects. The variation with F0 was lessevident and less systematic for some subjects.Table 1 lists the mean and SD across F0 of theafter-to-before ratio for the subjects. The F0range produced by the subjects was slightlynarrower than one and a half octave for themale subjects and two octaves for the trainedfemale but only 8 semitones for the untrainedfemale. The after-to-before ratio for CTP variedbetween 1.32 and 1.06 for the male subjects.The corresponding variation for PTP was 1.74and 0.98. The means across subjects were similarfor CTP and PTP. Vocal loading caused astatistically significant increase of both CTPand PTP (paired samples t-test, p
<strong>Proceedings</strong>, FONETIK <strong>2009</strong>, Dept. of Linguistics, Stockholm Universityrather good approximations of the average CTPbefore and after warm-up. However, the untrainedsubjects in the present experimentshowed an irregular variation with F0, so approximatingtheir CTP curves with modifiedversions of Titze’s equation seemed pointless.A limitation of the CTP is that, obviously, itcannot be measured when the vocal folds fail tocollide. This often happens in some dysphonicvoices in the upper part of the female voicerange, and in male falsetto phonation.The main finding of the present investigationwas that CTP increased significantly after vocalloading. For the two trained subjects, the effectwas minimal, and these subjects did not experienceany vocal fatigue after the vocal loading.On average, the increase was similar for CTPand PTP. This supports the assumption thatCTP reflects similar vocal fold characteristicsas the PTP.Our results suggest that the CTP may be usedas a valuable alternative or complementation tothe PTP, particularly in cases where it is difficultto determine the PTP accurately.ConclusionsThe CTP seems a promising alternative or complementto the PTP. The task of phonating atphonation threshold pressure seems more difficultfor subjects than the task of phonating atthe collision threshold. The information representedby the CTP would correspond to thatrepresented by the PTP. In the future, it wouldbe worthwhile to test CTP in other applications,e.g., in a clinical setting with patients beforeand after therapy.ReferencesChang A. and Karnell M.P. (2004) PerceivedPhonatory Effort and Phonation ThresholdPressure Across a Prolonged Voice LoadingTask: A Study of Vocal Fatigue. J Voice 18,454-66.Cleveland T. and Sundberg J. (1985) Acousticanalyses of three male voices of differentquality. In A Askenfelt, S Felicetti, E Jansson,J Sundberg, editors. SMAC 83. <strong>Proceedings</strong>of the Stockholm Internat MusicAcoustics Conf, Vol. 1 Stockholm: Roy SwAcad Music, Publ. No. 46:1, 143-56.Enflo L. and Sundberg J. (forthcoming) VocalFold Collision Threshold Pressure: An Alternativeto Phonation Threshold Pressure?Ladefoged P. and McKinney NP. (1963) Loudness,sound pressure, and subglottal pressurein speech. J Acoust Soc Am 35, 454-60.Milbrath R.L. and Solomon N.P. (2003) DoVocal Warm-Up Exercises Alleviate VocalFatigue?, J Speech Hear Res 46, 422-36.Solomon N.P. and DiMattia M.S. (2000) Effectsof a Vocally Fatiguing Task and SystematicHydration on Phonation ThresholdPressure. J Voice 14, 341-62.Titze I. (1992) Phonation threshold pressure: Amissing link in glottal aerodynamics. JAcoust Soc Am 91, 2926-35.Verdolini-Marston K., Titze I. and Druker D.G.(1990) Changes in phonation threshold pressurewith induced conditions of hydration. JVoice 4, 142-51.AcknowledgementsThe kind cooperation of the subjects is gratefullyacknowledged. This is an abbreviatedversion of a paper which has been submitted tothe Interspeech conference in Brighton, September<strong>2009</strong>.27
<strong>Proceedings</strong>, FONETIK <strong>2009</strong>, Dept. of Linguistics, Stockholm UniversityExperiments with Synthesis of Swedish DialectsBeskow, J. and Gustafson, J.Department of Speech, Music & Hearing, School of Computer Science & Communication, KTHAbstractWe describe ongoing work on synthesizingSwedish dialects with an HMM synthesizer. Aprototype synthesizer has been trained on alarge database for standard Swedish read by aprofessional male voice talent. We have selecteda few untrained speakers from each ofthe following dialectal region: Norrland, Dala,Göta, Gotland and South of Sweden. The planis to train a multi-dialect average voice, andthen use 20-30 minutes of dialectal speech fromone speaker to adapt either the standard Swedishvoice or the average voice to the dialect ofthat speaker.IntroductionIn the last decade, most speech synthesizershave been based on prerecorded pieces ofspeech resulting in improved quality, but withlack of control in modifying prosodic patterns(Taylor, <strong>2009</strong>). The research focus has been directedtowards how to optimally search andcombine speech units of different lengths.In recent years HMM based synthesis hasgained interest (Tokuda et al., 2000). In this solutionthe generation of the speech is based on aparametric representation, while the graphemeto-phonemeconversion still relies on a largepronunciation dictionary. HMM synthesis hasbeen successfully applied to a large number oflanguages, including Swedish (Lundgren,2005).Dialect SynthesisIn the SIMULEKT project (Bruce et al., 2007)one goal is to use speech synthesis to gain insightinto prosodic variation in major regionalvarieties of Swedish. The aim of the presentstudy is to attempt to model these Swedish varietiesusing HMM synthesis.HMM synthesis is an entirely data-drivenapproach to speech synthesis and as such itgains all its knowledge about segmental, intonationaland durational variation in speech fromtraining on an annotated speech corpus. Giventhat the appropriate features are annotated andmade available to the training process, it ispossible to synthesize speech with high quality,at both segmental and prosodic levels. Anotherimportant feature of HMM synthesis, thatmakes it an interesting choice in studying dialectalvariation, is that it is possible to adapt avoice trained on a large data set (2-10 hours ofspeech) to a new speaker with only 15-30 minutesof transcribed speech (Watts et al., 2008).In this study we will use 20-30 minutes of dialectalspeech for experiments on speaker adaptionof the initially trained HMM synthesisvoice.Data descriptionThe data we use in this study are from the NorwegianSpråkbanken. The large speech synthesisdatabase from a professional speaker ofstandard Swedish was recorded as part of theNST (Nordisk Språkteknologi) synthesis development.It was recorded in stereo, with thevoice signal in one channel, and signal from alaryngograph in the second channel.The corpus contains about 5000 read sentences,which add up to about 11 hours ofspeech. The recordings manuscript was basedon NST’s corpus, and the selection was done tomake them phonetically balanced and to ensurediphone coverage. The manuscripts are not prosodicallybalanced, but there are different typesof sentences that ensure prosodic variation, e.g.statements, wh-questions, yes/no questions andenumerations.The 11 hour speech database has beenaligned on the phonetic and word levels usingour Nalign software (Sjölander & Heldner,2004) with the NST dictionary as pronunciationdictionary. This has more than 900.000 itemsthat are phonetically transcribed with syllableboundaries marked. The text has been part-ofspeechtagged using a TNT tagger trained onthe SUC corpus (Megyesi, 2002).From the NST database for training ofspeech recognition we selected a small numberof unprofessional speakers from the followingdialectal areas: Norrland, Dala, Göta, Gotlandand South of Sweden. The data samples areconsiderably smaller than the speech synthesisdatabase: they range from 22 to 60 minutes,28
<strong>Proceedings</strong>, FONETIK <strong>2009</strong>, Dept. of Linguistics, Stockholm Universitycompared to the 11 hours from the professionalspeaker.HMM Contextual FeaturesThe typical HMM synthesis model (Tokuda etal., 2000) can be decomposed into a number ofdistinct layers:• At the acoustic level, a parametricsource-filter model (MLSA-vocoder) isresponsible for signal generation.• Context dependent HMMs, containingprobability distributions for the parametersand their 1 st and 2 nd order derivatives,are used for generation of controlparameter trajectories.• In order to select context dependentHMMs, a decision tree is used, that usesinput from a large feature set to clusterthe HMM models.In this work, we are using the standard modelfor acoustic and HMM level processing, andfocus on adapting the feature set for the decisiontree for the task of modeling dialectal variation.The feature set typically used in HMM synthesisincludes features on segment, syllable,word, phrase and utterance level. Segment levelfeatures include immediate context and positionin syllable; syllable features include stress andposition in word and phrase; word features includepart-of-speech tag (content or functionword), number of syllables, position in phraseetc., phrase features include phrase length interms of syllables and words; utterance levelincludes length in syllables, words and phrases.For our present experiments, we have alsoadded a speaker level to the feature set, sincewe train a voice on multiple speakers. The onlyfeature in this category at present is dialectgroup, which is one of Norrland, Dala, Svea,Göta, Gotland and South of Sweden.In addition to this, we have chosen to add tothe word level a morphological feature statingwhether or not the word is a compound, sincecompound stress pattern often is a significantdialectal feature in Swedish (Bruce et al.,2007). At the syllable level we have added explicitinformation about lexical accent type (accentI, accent II or compound accent).Training of HMM voices with these featuresets is currently in progress and results will bepresented at the conference.AcknowledgementsThe work within the SIMULEKT project isfunded by the Swedish Research Council 2007-<strong>2009</strong>. The data used in this study comes fromNorsk Språkbank (http://sprakbanken.uib.no)ReferencesBruce, G., Schötz, S., & Granström, B. (2007).SIMULEKT – modelling Swedish regionalintonation. <strong>Proceedings</strong> of <strong>Fonetik</strong>, TMH-QPSR, 50(1), 121-124.Lundgren, A. (2005). HMM-baserad talsyntes.Master's thesis, KTH, TMH, CTT.Megyesi, B. (2002). Data-Driven SyntacticAnalysis - Methods and Applications forSwedish. Doctoral dissertation, KTH, Departmentof Speech, Music and Hearing,KTH, Stockholm.Sjölander, K., & Heldner, M. (2004). Wordlevel precision of the NALIGN automaticsegmentation algorithm. In Proc of TheXVIIth Swedish Phonetics Conference, <strong>Fonetik</strong>2004 (pp. 116-119). Stockholm University.Taylor, P. (<strong>2009</strong>). Text-To-Speech Synthesis.Cambridge University Press.Tokuda, K., Yoshimura, T., Masuko, T., Kobayashi,T., & Kitamura, T. (2000). Speechparameter generation algorithms for hmmbasedspeech synthesis. In <strong>Proceedings</strong> ofCASSP 2000 (pp. 1315-1318).Watts, O., Yamagishi, J., Berkling, K., & King,S. (2008). HMM-Based Synthesis of ChildSpeech. <strong>Proceedings</strong> of The 1st Workshopon Child, Computer and Interaction.29
<strong>Proceedings</strong>, FONETIK <strong>2009</strong>, Dept. of Linguistics, Stockholm UniversityReal vs. rule-generated tongue movements as an audiovisualspeech perception supportOlov Engwall and Preben WikCentre for Speech Technology, CSC, KTHengwall@kth.se, preben@kth.seAbstractWe have conducted two studies in which animationscreated from real tongue movementsand rule-based synthesis are compared. Wefirst studied if the two types of animations weredifferent in terms of how much support theygive in a perception task. Subjects achieved asignificantly higher word recognition rate insentences when animations were shown comparedto the audio only condition, and a significantlyhigher score with real movementsthan with synthesized. We then performed aclassification test, in which subjects should indicateif the animations were created frommeasurements or from rules. The results showthat the subjects as a group are unable to tell ifthe tongue movements are real or not. Thestronger support from real movements henceappears to be due to subconscious factors.IntroductionSpeech reading, i.e. the use of visual cues in thespeaker’s face, in particular regarding the shapeof the lips (and hence the often used alternativeterm lip reading), can be a very importantsource of information if the acoustic signal isinsufficient, due to noise (Sumby & Pollack,1954; Benoît & LeGoff, 1998) or a hearingimpairment(e.g., Agelfors et al., 1998; Siciliano,2003). This is true even if the face is computeranimated. Speech reading is much morethan lip reading, since information is also givenby e.g., the position of the jaw, the cheeks andthe eye-brows. For some phonemes, the tip ofthe tongue is visible through the mouth openingand this may also give some support. However,for most phonemes, the relevant parts of thetongue are hidden, and “tongue reading” istherefore impossible in human-human communication.On the other hand, with a computeranimatedtalking face it is possible to maketongue movements visible, by removing partsin the model that hide the tongue in a normalview, thus creating an augmented reality (AR)display, as exemplified in Fig. 1.Since the AR view of the tongue is unfamiliar,it is far from certain that listeners are ableto make use of the additional information in asimilar manner as for animations of the lips.Badin et al. (2008) indeed concluded that thetongue reading abilities are weak and that subjectsget more support from a normal view ofthe face, where the skin of the cheek is showninstead of the tongue, even though less informationis given. Wik & Engwall (2008) similarlyfound that subjects in general found littleadditional support when an AR side-view as theone in Fig. 1 was added to a normal front view.There is nevertheless evidence that tonguereading is possible and can be learned explicitlyor implicitly. When the signal-to-noise ratiowas very low or the audio muted in the studyby Badin et al. (2008), subjects did start tomake use of information given by the tonguemovements – if they had previously learnedhow to do it. The subjects were presented VCVwords in noise, with either decreasing or increasingsignal-to-noise ratio (SNR). The groupwith decreasing SNR was better in low SNRconditions when tongue movements were displayed,since they had been implicitly trainedon the audiovisual relationship for stimuli withhigher SNR. The subjects in Wik & Engwall(2008) started the word recognition test in sentenceswith acoustically degraded audio by afamiliarization phase, where they could listento, and look at, training stimuli with both nor-Figure 1. Augmented reality view of the face.30
<strong>Proceedings</strong>, FONETIK <strong>2009</strong>, Dept. of Linguistics, Stockholm Universitymal and degraded audio. Even though the totalresults were no better with the AR view thanwith a normal face, the score for some sentenceswas higher when the tongue was visible.Grauwinkel et al. (2007) also showed that subjectswho had received explicit training, in theform of a video that explained the intra-oral articulatormovement for different consonants,performed better in the VCV recognition taskin noise than the group who had not receivedthe training and the one who saw a normal face.An additional factor that may add to the unfamiliarityof the tongue movements is thatthey were generated with a rule-based visualspeech synthesizer in Wik & Engwall (2008)and Graunwinkel et al. (2007). Badin etal. (2008) on the other hand created the animationsbased on real movements, measured withElectromagnetic Articulography (EMA). In thisstudy, we investigate if the use of real movementsinstead of rule-generated ones has anyeffect on speech perception results.It could be the case that rule-generatedmovements give a better support for speechperception, since they are more exaggeratedand display less variability. It could howeveralso be the case that real movements give a bettersupport, because they may be closer to thelisteners’ conscious or subconscious notion ofwhat the tongue looks like for different phonemes.Such an effect could e.g., be explainedby the direct realist theory of speech perception(Fowler, 2008) that states that articulatory gesturesare the units of speech perception, whichmeans that perception may benefit from seeingthe gestures. The theory is different from, butclosely related to, and often confused with, thespeech motor theory (Liberman et al, 1967;Liberman & Mattingly, 1985), which stipulatesthat speech is perceived in terms of gesturesthat translate to phomenes by a decoder linkedto the listener's own speech production. It hasoften been criticized (e.g., Traunmüller, 2007)because of its inability to fully explain acousticspeech perception. For visual speech perception,there is on the other hand evidence (Skipperet al., 2007) that motor planning is indeedactivated when seeing visual speech gestures.Speech motor areas in the listener’s brain areactivated when seeing visemes, and the activitycorresponds to the areas activated in thespeaker when producing the same phonemes.We here investigate audiovisual processing ofthe more unfamiliar visual gestures of thetongue, using a speech perception and a classificationtest. The perception test analyzes thesupport given by audiovisual displays of thetongue, when they are generated based on realmeasurements (AVR) or synthesized by rules(AVS). The classification test investigates ifsubjects are aware of the differences betweenthe two types of animations and if there is anyrelation between scores in the perception testand the classification test.ExperimentsBoth the perception test (PT) and the classificationtest (CT) were carried out on a computerwith a graphical user interface consisting of oneframe showing the animations of the speechgestures and one response frame in which thesubjects gave their answers. The acoustic signalwas presented over headphones.The Augmented Reality displayBoth tests used the augmented reality side-viewof a talking head shown in Fig. 1. Movementsof the three-dimensional tongue and jaw havebeen made visible by making the skin at thecheek transparent and representing the palateby the midsagittal outline and the upper incisor.Speech movements are created in the talkinghead model using articulatory parameters, suchas jaw opening, shift and thrust; lip rounding;upper lip raise and retraction; lower lip depressionand retraction; tongue dorsum raise, bodyraise, tip raise, tip advance and width. Thetongue model is based on a component analysisof data from Magnetic Resonance Imaging(MRI) of a Swedish subject producing staticvowels and consonants (Engwall, 2003).Creating tongue movementsThe animations based on real tongue movements(AVR) were created directly from simultaneousand spatially aligned measurements ofthe face and the tongue for a female speaker ofSwedish (Beskow et al., 2003). The MovetrackEMA system (Branderud, 1985) was employedto measure the intraoral movements, usingthree coils placed on the tongue, one on the jawand one on the upper incisor. The movementsof the face were measured with the Qualisysmotion capture system, using 28 reflectors attachedto the lower part of the speaker’s face.The animations were created by adjusting theparameter values of the talking head to optimallyfit the Qualisys-Movetrack data (Beskowet al., 2003).31
<strong>Proceedings</strong>, FONETIK <strong>2009</strong>, Dept. of Linguistics, Stockholm UniversityThe animations with synthetic tonguemovements (AVS) were created using a rulebasedvisual speech synthesizer developed forthe face (Beskow, 1995). For each viseme, targetvalues may be given for each parameter(i.e., articulatory feature). If a certain feature isunimportant for a certain phoneme, the target isleft undecided, to allow for coarticulation.Movements are then created based on the specifiedtargets, using linear interpolation andsmoothing. This signifies that a parameter thathas not been given a target for a phoneme willmove from and towards the targets in the adjacentphonemes. This simple coarticulationmodel has been shown to be adequate for facialmovements, since the synthesized face gesturessupport speech perception (e.g., Agelfors et al.1998; Siciliano et al., 2003). However, it is notcertain that the coarticulation model is sufficientto create realistic movements for thetongue, since they are more rapid and more directlyaffected by coarticulation processes.StimuliThe stimuli consisted of short (3-6 words long)simple Swedish sentences, with an “everydaycontent”, e.g., “Flickan hjälpte till i köket” (Thegirl helped in the kitchen). The acoustic signalhad been recorded together with the Qualisys-Movetrack measurements, and was presentedtime-synchronized with the animations.In the perception test, 50 sentences werepresented to the subjects: 10 in acoustic only(AO) condition (Set S1), and 20 each in AVRand AVS condition (Sets S2 and S3). All sentenceswere acoustically degraded using anoise-excited three-channel vocoder (Siciliano,2003) that reduces the spectral details and createsa speech signal that is amplitude modulatedand bandpass filtered. The signal consistsof multiple contiguous channels of white noiseover a specified frequency range.In the classification test, 72 sentences wereused, distributed evenly over the four conditionsAVR or AVS with normal audio (AVRn,AVSn) and AVR or AVS with vocoded audio(AVRv, AVSv), i.e. 18 sentences per condition.SubjectsThe perception test was run with 30 subjects,divided into three groups I, II and III. The onlydifference between groups I and II was thatthey saw the audiovisual stimuli in oppositeconditions (i.e., group I saw S2 in AVS and S3in AVR; group II S2 in AVR and S3 in AVS).Group III was a control group that was presentedall sets in AO.The classification test was run with 22 subjects,11 of whom had previously participatedin the perception test. The subjects were dividedinto two groups I and II, again with theonly difference being that they saw each sentencein opposite condition (AVR or AVS).All subjects were normal-hearing, nativeSwedes, aged 17 to 67 years old (PT) and 12 to81 years (CT). 18 male and 12 female subjectsparticipated in the perception test and 11 ofeach sex in the classification test.Experimental set-upBefore the perception test, the subjects werepresented a short familiarization session, consistingof five VCV words and five sentencespresented four times, once each with AVRv,AVRn, AVSv and AVSn. The subjects in theperception test were unaware of the fact thatthere were two different types of animations.The stimuli order was semi-random (PT) orrandom (CT), but the same for all groups,which means that the relative AVR-AVS conditionorder was reversed between groups I andII. The order was semi-random (i.e., the threedifferent conditions were evenly distributed) inthe perception test to avoid that learning effectsaffected the results.Each stimulus was presented three times inthe perception test and once in the classificationtest. For the latter, the subjects could repeat theanimation once. The subjects then gave theiranswer by typing in the perceived words in theperception test, and by pressing either of twobuttons (“Real” or “Synthetic”) in the classificationtest. After the classification test, but beforethey were given their classification score,the subjects typed in a short explanation onhow they had decided if an animation was fromreal movements or not.The perception test lasted 30 minutes andthe classification test 10 minutes.Data analysisThe word accuracy rate was counted manuallyin the perception test, disregarding spelling andword alignment errors. To assure that the differentgroups were matched and remove differencesthat were due to subjects rather than conditions,the results of the control group on setsS2 and S3 were weighted, using a scale factordetermined on set S1 by adjusting the average32
<strong>Proceedings</strong>, FONETIK <strong>2009</strong>, Dept. of Linguistics, Stockholm Universityof group III so that the recognition score on thisset was the same as for the group I+II.For the classification test, two measures μand ∆ were calculated for all subjects. The classificationscore μ is the average proportion ofcorrectly classified animations c out of N presentations.The discrimination score ∆ insteadmeasures the proportion of correctly separatedanimations by disregarding if the label was corrector not. The measures are in the range0≤μ≤1 and 0.5≤∆≤1, with {μ, ∆}=0.5 signifyinganswers at chance level. The discriminationscore was calculated since we want to investigatenot only if the subjects can tell whichmovements are real but also if they can see differencesbetween the two animation types. Forexample, if subjects A and B had 60 and 12correct answers, μ=(60+12)/72=50% but∆=(36+24)/72=67%, indicating that consideredas a group, subject A and B could see the differencebetween the two types of animations,but not tell which were which.The μ, ∆ scores were also analyzed to findpotential differences due to the accompanyingacoustic signal, and correlations between classificationand word recognition score for thesubjects who participated in both tests.Word recognition score (%)70605040302010** ↕↕ *0Figure 2. Percentage of words correctly recognizedwhen presented in the different conditions AudioOnly (AO), Audiovisual with Real (AVR) or Syntheticmovements (AVS). The level of significancefor differences is indicated by * (p
<strong>Proceedings</strong>, FONETIK <strong>2009</strong>, Dept. of Linguistics, Stockholm UniversityRecognition/classification40%30%20%10%0%-10%-20%-30%-40%1 3 5 7 9 11 13 15 17 19 21the two types of animations correctly, withμ=48% at chance level. The picture is to someextent altered when considering the discriminationscore, ∆=0.66 (standard deviation 0.12) forthe group. Fig. 5 shows that the variation betweensubjects is large. Whereas about half ofthem were close to chance level, the other halfwere more proficient in the discrimination task.The classification score was slightly influencedby the audio signal, since the subjectsclassified synthetic movements accompaniedby vocoded audio 6.5% more correctly than ifthey were accompanied by normal audio. Therewas no difference for the real movements. Itshould be noted that it was not the case that thesubjects consciously linked normal audio to themovements they believed were real, i.e., subjectswith low μ (and high ∆) did not differfrom subjects with high or chance-level μ.Fig. 5 also illustrates that the relation betweenthe classification score for individualsubjects and their difference in AVR-AVSword recognition in the perception test is weak.Subject 1 was indeed more aware than the averagesubject of what real tongue movementslook like and subjects 8, 10 and 11 (subjects 15,16 and 18 in Fig. 3), who had a negativeweighted AVR-AVS difference in word recognition,were the least aware of the differencesbetween the two conditions. On the other hand,for the remaining subjects there is very littlecorrelation between recognition and classificationscores. For example, subjects 4, 5 and 9were much more proficient than subject 1 atdiscriminating between the two animationtypes, and subject 2 was no better than subject7, even though there were large differences inperception results between them.δμAVR-AVSFigure 5. Classification score δμ relativechance-level (δμ=μ-0.5). The x-axis crosses atchance level and the bars indicate scores aboveor below chance. For subjects 1–11, who participatedin the perception test, the weighted differencein word recognition rate between theAVR and AVS conditions is also given.DiscussionThe perception test results showed that animationsof the intraoral articulation may be validas a speech perception support, since the wordrecognition score was significantly higher withanimations than without. We have in this testnot investigated if it is specifically the displayof tongue movements that is beneficial. Theresults from Wik & Engwall (2008) and Badinet al. (2008) suggest that a normal view of theface without any tongue movements visiblewould be as good or better as a speech perceptionsupport. The results of the current studyhowever indicate that animations based on realmovements were significantly higher, and weare therefore currently working on a new coarticulationmodel for the tongue, based on EMAdata, in order to be able to create sufficientlyrealistic synthetic movements, with the aim ofproviding the same level of support as animationsfrom real measurements.The classification test results suggest thatsubjects are mostly unaware of what real tonguemovements look like, with a classificationscore at chance level. They could to a largerextent discriminate between the two types ofanimations, but still at a modest level (2/3 ofthe animations correctly separated).In the explanations of what they had lookedat to judge the realism of the tongue movements,two of the most successful subjectsstated that they had used the tongue tip contactwith the palate to determine if the animationwas real or not. However, subjects who had lowμ, but high ∆ or were close to chance level alsostated that they had used this criterion, and itwas hence not a truly successful method.An observation that did seem to be useful todiscern the two types of movements (correctlyor incorrectly labeled) was the range of articulation,since the synthetic movements were larger,and, as one subject stated, “reached theplaces of articulation better”. The subject withthe highest classification rate and the two withthe lowest all used this criterion.A criterion that was not useful, ventured byseveral subjects who were close to chance, wasthe smoothness of the movement and the assumptionthat rapid jerks occurred only in thesynthetic animations. This misconception israther common, due to the rapidity and unfamiliarityof tongue movements: viewers arevery often surprised by how fast and rapidlychanging tongue movements are.34
<strong>Proceedings</strong>, FONETIK <strong>2009</strong>, Dept. of Linguistics, Stockholm UniversityConclusionsThe word recognition test of sentences with degradedaudio showed that animations based onreal movements resulted in significantly betterspeech perception than rule-based. The classificationtest then showed that subjects were unableto tell if the displayed animated movementswere real or synthetic, and could to amodest extent discriminate between the two.This study is small and has several factorsof uncertainty (e.g., variation between subjectsin both tests, the influence of the face movements,differences in articulatory range of thereal and rule-based movements) and it is hencenot possible to draw any general conclusions onaudiovisual speech perception with augmentedreality. It nevertheless points out a very interestingpath of future research: the fact that subjectswere unable to tell if animations were createdfrom real speech movements or not, butreceived more support from this type of animationsthan from realistic synthetic movements,gives an indication of a subconscious influenceof visual gestures on speech perception. Thisstudy cannot prove that there is a direct mappingbetween audiovisual speech perceptionand speech motor planning, but it does hint atthe possibility that audiovisual speech is perceivedin the listener’s brain terms of vocaltract configurations (Fowler, 2008). Additionalinvestigations with this type of studies couldhelp determine the plausibility of differentspeech perception theories linked to the listener’sarticulations.AcknowledgementsThis work is supported by the Swedish ResearchCouncil project 80449001 Computer-Animated LAnguage TEAchers (CALATEA).The estimation of parameter values from motioncapture and articulography data was performedby Jonas Beskow.ReferencesAgelfors, E., Beskow, J., Dahlquist, M., Granström,B., Lundeberg, M., Spens, K.-E. andÖhman, T. (1998). Synthetic faces as alipreading support. <strong>Proceedings</strong> of ICSLP,3047–3050.Badin, P., Tarabalka, Y., Elisei, F. and Bailly,G. (2008). Can you ”read tongue movements”?,<strong>Proceedings</strong> of Interspeech, 2635–2638.Benoît, C. and LeGoff, B. (1998). Audio-visualspeech synthesis from French text: Eightyears of models, design and evaluation atthe ICP. Speech Communication 26, 117–129.Beskow, J. (1995). Rule-based visual speechsynthesis. <strong>Proceedings</strong> of Eurospeech, 299–302.Beskow, J., Engwall, O. and Granström, B.(2003). Resynthesis of facial and intraoralmotionfrom simultaneous measurements.<strong>Proceedings</strong> of ICPhS, 431–434.Branderud, P. (1985). Movetrack – a movementtracking system, <strong>Proceedings</strong> of the French-Swedish Symposium on Speech, 113–122,Engwall, O. (2003). Combining MRI, EMA &EPG in a three-dimensional tongue model.Speech Communication 41/2-3, 303–329.Fowler, C. (2008). The FLMP STMPed, PsychonomicBulletin & Review 15, 458–462.Grauwinkel, K., Dewitt, B. and Fagel, S.(2007). Visual information and redundancyconveyed by internal articulator dynamicsin synthetic audiovisual speech. <strong>Proceedings</strong>of Interspeech, 706–709.Liberman A, Cooper F, Shankweiler D andStuddert-Kennedy M (1967). Perceptionof the speech code. Psychological Review,74, 431–461.Liberman A & Mattingly I (1985). The motortheory of speech perception revised.Cognition, 21, 1–36.Siciliano, C., Williams, G., Beskow, J. andFaulkner, A. (2003). Evaluation of a multilingualsynthetic talking face as a communicationaid for the hearing impaired, <strong>Proceedings</strong>of ICPhS, 131–134.Skipper J., Wassenhove V. van, NusbaumH. and Small, S. (2007). Hearing lipsand seeing voices: how cortical areassupporting speech production mediateaudiovisual speech perception. CerebralCortex 17, 387 – 2399.Sumby, W. and Pollack, I. (1954). Visual contributionto speech intelligibility in noise,Journal of the Acoustical Society of America26, 212–215.Traunmüller, H. (2007). Demodulation, mirrorneurons and audiovisual perception nullifythe motor theory. <strong>Proceedings</strong> of <strong>Fonetik</strong>2007, KTH-TMH-QPSR 50: 17–20.Wik, P. and Engwall, O. (2008). Can visualizationof internal articulators support speechperception?, <strong>Proceedings</strong> of Interspeech2008, 2627–2630.35
<strong>Proceedings</strong>, FONETIK <strong>2009</strong>, Dept. of Linguistics, Stockholm UniversityAdapting the Filibuster text-to-speech system forNorwegian bokmålKåre Sjölander and Christina TånnanderThe Swedish Library of Talking Books and Braille (TPB)AbstractThe Filibuster text-to-speech system is specificallydesigned and developed for the productionof digital talking textbooks at universitylevel for students with print impairments. Currently,the system has one Swedish voice,'Folke', which has been used in production atthe Swedish Library of Talking Books andBraille (TPB) since 2007. In August 2008 thedevelopment of a Norwegian voice (bokmål)started, financed by the Norwegian Library ofTalking Books and Braille (NLB). This paperdescribes the requirements of a text-to-speechsystem used for the production of talking textbooks,as well as the developing process of theNorwegian voice, 'Brage'.IntroductionThe Swedish Library of Talking Books andBraille (TPB) is a governmental body that providespeople with print impairments with Brailleand talking books. Since 2007, the in-housetext-to-speech (TTS) system Filibuster with itsSwedish voice 'Folke' has been used in the productionof digital talking books at TPB(Sjölander et al., 2008). About 50% of theSwedish university level textbooks is currentlyproduced with synthetic speech, which is afaster and cheaper production method comparedto the production of books with recorded humanspeech. An additional advantage is that thestudent gets access to the electronic text, whichis synchronized with the audio. All tools andnearly all components in the TTS system componentsare developed at TPB.In August 2008, the development of a Norwegianvoice (bokmål) started, financed by theNorwegian Library of Talking Books andBraille (NLB). The Norwegian voice 'Brage'will primarily be used for the production of universitylevel textbooks, but also for news textand the universities' own production of shorterstudy materials. The books will be produced asDAISY-books, the international standard fordigital talking books, via the open-sourceDAISY Pipeline production system (DAISYPipeline, <strong>2009</strong>).The Filibuster system is a unit selectionTTS, where the utterances are automaticallygenerated through selection and concatenationof segments from a large corpus of recordedsentences (Black and Taylor, 1997).An important feature of the Filibuster TTSsystem is that the production team has totalcontrol of the system components. An unlimitednumber of new pronunciations can be added, aswell as modifications and extensions of the textprocessing system and rebuilding of the speechdatabase. To achieve this, the system must beopen and transparent and free from black boxes.The language specific components such asthe pronunciation dictionaries, the speech databaseand the text processing system are NLB’sproperty, while the language independent componentsare licensed as open-source.Requirements for a narrative textbooktext-to-speech systemThe development of a TTS system for the productionof university level textbooks calls forconsiderations that are not always required for aconventional TTS system.The text corpus should preferably consist oftext from the same area as the intended productionpurpose. Consequently, the corpus shouldcontain a lot of non-fiction literature to covervarious topics such as religion, medicine, biology,and law. From this corpus, high frequencyterms and names are collected and added to thepronunciation dictionary.The text corpus doubles as a base for constructionof recording manuscripts, which in additionto general text should contain representativenon-fiction text passages such as bibliographicand biblical references, formulas andURL’s. A larger recording manuscript thanwhat is conventionally used is required in orderto cover phone sequences in foreign names,terms, passages in English and so on. In addition,the above-mentioned type of textbook specificpassages necessitates complex and welldevelopedtext processing.36
<strong>Proceedings</strong>, FONETIK <strong>2009</strong>, Dept. of Linguistics, Stockholm UniversityThe number of out-of-vocabulary (OOV)words is likely to be high, as new terms andnames frequently appear in the textbooks, requiringsophisticated tools for automatic generationof pronunciations. The Filibuster systemdistinguishes between four word types; propernames, compounds and simplex words in thetarget language, and English words.In order to reach the goal of making thetextbooks available for studies, all text - plainNorwegian text and English text passages, OOVwords and proper names - need to be intelligible,raising the demands for a distinct and pragmaticvoice.The development of the NorwegianvoiceThe development of the Norwegian voice canbe divided into four stages: (1) adjustments andcompletion of the pronunciation dictionary andthe text corpus, and the development of the recordingmanuscripts, (2) recordings of theNorwegian speaker, (3) segmentation and buildingthe speech database, and (4) quality assurance.Pronunciation dictionariesThe Norwegian HLT Resource Collection hasbeen made available for research and commercialuse by the Language Council for Norwegian(http://www.sprakbanken.uib.no/). The resourcesinclude a pronunciation dictionary forNorwegian bokmål with about 780,000 entries,which were used in the Filibuster NorwegianTTS. The pronunciations are transcribed in asomewhat revised SAMPA, and follow mainlythe transcription conventions in Øverland(2000). Some changes to the pronunciationswere done, mainly consistent adaptations to theNorwegian speaker's pronunciation and removalof inconsistencies, but a number of true errorswere also corrected, and a few changes weremade due to revisions of the transcription conventions.To cover the need for English pronunciations,the English dictionary used by the Swedishvoice, consisting of about 16,000 entries,was used. The pronunciations in this dictionaryare ‘Swedish-style’ English. Accordingly, theywere adapted into ‘Norwegian-style’ Englishpronunciations. 24 xenophones were implementedin the phoneme set, of which about 15have a sufficiently number of representations inthe speech database, and will be used by theTTS system. The remaining xenophones will bemapped into phonemes that are more frequentin the speech database.In addition, some proper names from theSwedish pronunciation dictionary were adaptedto Norwegian pronunciations, resulting in aproper name dictionary of about 50,000 entries.Text corpusThe text corpus used for manuscript constructionand word frequency statistics consists ofabout 10.8 million words from news and magazinetext, university level textbooks of differenttopics, and Official Norwegian Reports(http://www.regjeringen.no/nb/dok/NOUer.html?id=1767). The text corpus has been cleanedand sentence chunked.Recording manuscriptsThe construction of the Norwegian recordingmanuscript was achieved by searching phoneticallyrich utterances iteratively. While diphoneswas used as the main search unit, searches alsoincluded high-frequency triphones and syllables.As mentioned above, university level textbooksinclude a vast range of different domainsand text types, and demands larger recordingmanuscripts than most TTS systems in order tocover the search units for different text typesand languages. Biographical references, for example,can have a very complex construction,with authors of different nationalities, name initialsof different formats, titles in other languages,page intervals and so on. To maintain ahigh performance of the TTS system for morecomplex text structures, the recording manuscriptmust contain a lot of these kinds of utterances.To cover the need of English phone sequences,a separate English manuscript was recorded.The CMU ARCTIC database forspeech synthesis with nearly 1,150 English utterances(Kominek and Black, 2003) was usedfor this purpose. In addition, the Norwegianmanuscript contained many utterances withmixed Norwegian and English, as well as emailaddresses, acronyms, spelling, numerals, lists,announcements of DAISY specific structuressuch as page numbers, tables, parallel text andso on.RecordingsThe speech was recorded in NLB’s recordingstudio. An experienced male textbook speakerwas recorded by a native supervisor. The re-37
<strong>Proceedings</strong>, FONETIK <strong>2009</strong>, Dept. of Linguistics, Stockholm Universitycordings were carried out in 44.1 KHz with 24-bit resolution. Totally, 15,604 utterances wererecorded.Table 1. A comparison of the length of the recordedspeech databases for different categories, Norwegianand SwedishNorwegian SwedishTotal time 26:03:15 28:27:24Total time (speech) 18:24:39 16:15:09Segments 568 606 781 769Phones 519 065 660 349Words 118 104 132 806Sentences 15 604 14 788A comparison of the figures above shows thatthe Swedish speaker is about 45% faster thanthe Norwegian speaker (11.37 vs. 7.83 phonesper second). This will result in very large filesetsfor the Norwegian textbooks, which oftenconsists of more than 400 pages, and a veryslow speech rate of the synthetic speech. However,the speech rate can be adjusted in the student'sDAISY-player or by the TTS-system itself.On the other hand, a slow speech ratecomes with the benefit that it well articulatedand clear speech can be attained in a more naturalway compared to slowing down a voice withan inherently fast speech rate.SegmentationUnlike the Swedish voice, for which all recordingswere automatically and manually segmented(Ericsson et al., 2007), all the Norwegianutterances were control listened, and thephonetic transcriptions were corrected beforethe automatic segmentation was done. In thatway, only the pronunciation variants that actuallyoccurred in the audio had to be taken intoaccount by the speech recognition tool(Sjölander, 2003). Another difference from theSwedish voice is that plosives are treated as onecontinuous segment, instead of being split intoobstruction and release.Misplaced phone boundaries and incorrectphone assignments will possibly be corrected inthe quality assurance project.Unit selection and concatenationThe unit selection method used in the Filibustersystem is based mainly on phone decision trees,which find candidates with desired properties,and strives to find as long phone sequences aspossible to minimise the number of concatenationpoints. The optimal phone sequence is chosenusing an optimisation technique, whichlooks at the phone's joining capability, as well asits spectral distance from the mean of all candidates.The best concatenation point betweentwo sound clips is found by correlating theirwaveforms.Text processingThe Swedish text processing system was usedas a base for the Norwegian system. Althoughthe two languages are similar in many ways,many modifications were needed.The tokenisation (at sentence, multi-wordand word level) is largely the same for Swedishand Norwegian. One of the exceptions is thesentence division at ordinals, where the standardNorwegian annotation is to mark the digit witha period as in '17. mai', which is an annotationthat is not used in Swedish.The Swedish part-of-speech tagging is doneby a hybrid tagger, a statistical tagger that usesthe POS trigrams of the Swedish SUC2.0 corpus(Källgren et al., 2006), and a rule-basedcomplement which handles critical part-ofspeechdisambiguation. It should be mentionedthat the aim of the inclusion of a part-of-speechtagger is not to achieve perfectly tagged sentences;its main purpose is to disambiguatehomographs. Although the Swedish and Norwegianmorphology and syntax differ, theSwedish tagger and the SUC trigram statisticsshould be used also for the Norwegian system,even though it seems like homographs in Norwegianbokmål need more attention than inSwedish. As an example, the relatively frequentNorwegian homographs where one form is anoun and the other a verb or a past participle,for example 'laget', in which the supine verbform (or past participle) is pronounced with the't' and with accent II ["lɑ:.gət], while the nounform is pronounced without the 't' and with accentI ['lɑ:.gə]. As it stands, it seems as the systemcan handle these cases to satisfaction. OOVwords are assigned their part-of-speech accordingto language specific statistics of suffixes ofdifferent lengths, and from contextual rules. Nophrase parsing is done for Norwegian, but thereis a future option to predict phrase boundariesfrom the part-of-speech tagged sentence.Regarding text identification, that is classifyingtext chunks as numerals or ordinals, years,intervals, acronyms, abbreviations, email addressesor URLs, formulas, biographical, biblicalor law references, name initials and so on,the modifications mainly involved translation offor instance units and numeral lists, new lists of38
<strong>Proceedings</strong>, FONETIK <strong>2009</strong>, Dept. of Linguistics, Stockholm Universityabbreviations and formats for ordinals, date expressionsand suchlike. Similar modificationswere carried out for text expansions of theabove-mentioned classifications.A language detector that distinguishes thetarget language from English was also includedin the Norwegian system. This module looks upthe words in all dictionaries and suggests languagetag (Norwegian or English) for eachword depending on unambiguous languagetypes of surrounding words.OOV words are automatically predicted tobe proper names, simplex or compound Norwegianwords or English words. Some of the pronunciationsof these words are generated byrules, but the main part of the pronunciations isgenerated with CART trees, one for each wordtype.The output from the text processor is sent tothe TTS engine in SSML format.Quality assuranceThe quality assurance phase consists of twoparts, the developers’ own testing to catch generalerrors, and a listening test period where nativespeakers report errors in segmentation,pronunciation and text analysis to the developingteam. They are also able to correct minorerrors by adding or changing transcriptions orediting simpler text processing rules. Some tentextbooks will be produced for this purpose, aswell as test documents with utterances of highcomplexity.Black A. and Taylor P. (1997). Automaticallyclustering similar units for unit selection inspeech synthesis. <strong>Proceedings</strong> of Eurospeech97, Rhodes, Greece.DAISY Pipeline (<strong>2009</strong>).http://www.daisy.org/projekcts/pipeline.Ericsson C., Klein J., Sjölander K. and SönneboL. (2007). Filibuster – a new Swedish textto-speechsystem. <strong>Proceedings</strong> of <strong>Fonetik</strong>,TMH-QPSR 50(1), 33-36, Stockholm.Kominek J. and Black A. (2003). CMUARCTIC database for speech synthesis.Language Technologies Institute. CarnegieMellon University, Pittsburgh PA . TechnicalReport CMU-LTI-03-177.http://festvox.org/cmu_arctic/cmu_arctic_report.pdfKällgren G., Gustafson-Capkova S. and HartmanB. (2006). Stockholm Umeå Corpus2.0 (SUC2.0). Department of Linguistics,Stockholm University, Stockholm.Sjölander, K. (2003). An HMM-based systemfor automatic segmentation and alignment ofspeech. <strong>Proceedings</strong> of <strong>Fonetik</strong> 2003, 93-96,Stockholm.Sjölander K., Sönnebo L. and Tånnander C.(2008). Recent advancements in the Filibustertext-to-speech system. SLTC 2008.Øverland H. (2000). Transcription Conventionsfor Norwegian. Technical Report. NordiskSpråkteknologi ASCurrent statusThe second phase of the quality assurance phasewith native speakers will start in May <strong>2009</strong>. Thesystem is scheduled to be put in production ofNorwegian textbooks by the autumn term of<strong>2009</strong>. Currently, the results are promising. Thevoice appears clear and highly intelligible, alsoin the generation of more complex utterancessuch as code switching between Norwegian andEnglish.References39
<strong>Proceedings</strong>, FOETIK <strong>2009</strong>, Dept. of Linguistics, Stockholm UniversityAcoustic characteristics of onomatopoetic expressionsin child-directed speechU. Sundberg and E. KlintforsDepartment of linguistics, Stockholm University, StockholmAbstractThe purpose of this study was to identify preliminaryacoustic and phonological characteristicsof onomatopoetic expressions (OE) inSwedish child-directed speech. The materialson one mother interacting with her 4-year-oldchild were transcribed and used for pitch contourmeasurements on OE. Measurements werealso made on some non-onomatopoetic expressionsto be used as controls. The results showedthat OE were often composed of CV or CVCsyllables, as well as that the syllables or wordsof the expressions were usually reduplicated.Also, the mother’s voice was often modifiedwhen OE were used. It was common that thequality of the voice was creaky or that themother whispered these expressions. Therewere also changes in intonation and some ofthe expressions had higher fundamental frequency(f0) as compared to non-onomatopoeticexpressions. In several ways then, OE can beseen as highly modified child-directed speech.IntroductionThe video materials analyzed in the currentstudy were collected within a Swedish-Japaneseresearch project: A cross language study ofonomatopoetics in infant- and child-directedspeech (initiated 2002 by Dr Y. Shimura, SaitamaUniv., Japan & Dr U. Sundberg, StockholmUniv., Sweden). The aim of the project isto analyze characteristics of onomatopoetic expressions(OE) in speech production of Swedishand Japanese 2-year-old and 4-to 5-yearoldchildren, as well as in the child-directedspeech (CDS) of their mothers.The aim of the current study is to explorepreliminary acoustic and phonological characteristicsof OE in Swedish CDS. Therefore ananalysis of pitch contours, and syllable structurein OE of a mother talking to her 4-year-oldchild was carried out. Japanese is a languagewith a rich repertoire of OE in CDS, as well asin adult-directed speech (ADS). The characteristicsand functions of OE in Japanese are ratherwell investigated. The current study aimsto somewhat fill in that gap in Swedish IDS.BackgroundOnomatopoetic expressions (OE) may be definedas a word or a combination of words thatimitate or suggest the source of the sound theyare describing. Common occurrences includeexpressions for actions, such as the sound ofsomething falling into water: splash or a characteristicsound of an object/animal, such asoink. In general, the relation between a wordformand the meaning of the word is arbitrary.OEs are different: a connection between howthe word sounds and the object/action exists.OE are rather few in human languages. Insome languages, such as Japanese, OE arethough frequent and of great significance (Yule,2006). In Japanese there are more than 2000onomatopoetic words (Noma, 1998). Thesewords may be divided in categories, such as“Giseigo” – expressions sounds made bypeople/animals (e.g. kyaakyaa ‘a laughing orscreaming female voice with high f0’), “Giongo”– expressions imitating inanimate objectsin the nature (e.g. zaazaa ‘a shower/lots of rainingwater pouring down’), and “Gitagio” – expressionsfor tactile/visual impressions we cannotperceive auditorily (e.g. niyaniaya ‘an ironicsmile’). Furthermore, plenty of these wordsare lexicalized in Japanese (Hamano, 1998).Therefore, non-native speakers of Japanese oftenfind it difficult to learn onomatopoeticwords. The unique characteristics of onomatopoeticwords are also dependent on specific usewithin diverse subcultures (Ivanova, 2006).MethodVideo/audio recordings of mother-child dyadswere collected. The mothers were interactingwith their children by using Swedish/Japanesefairy tale-books as inspiration of topics possiblygenerating use of OE. The mothers were thusinstructed not to read aloud the text, but to discussobjects/actions illustrated in the books.MaterialsThe materials were two video/sound recordingsof one mother interacting with her 4-year-old40
<strong>Proceedings</strong>, FOETIK <strong>2009</strong>, Dept. of Linguistics, Stockholm Universitychild. The first recording (app. 4 min.) wasbased on engagement in two Japanese booksand the other recording (app. 4 min.) was basedon engagement in Pippi Longstocking. Themother uttered 65 OE within these recordings.AnalysisThe speech materials were transcribed with notificationsof stress and f0 along a time scale of10 sec. intervals. Pitch contour analysis of OE(such as voff ‘bark’), and non-onomatopoeticwords corresponding to the object/action (suchas hund ‘dog’) was performed in Wavesurfer.ResultsThe results showed that the mother’s voicequality was more modified, using creaky/pressed voice, whispering and highly varyingpitch as compared to non-onomatopoetic wordsin CDS. The creaky voice was manifested bylow frequencies with identifiable pulses.OE such as nöff ‘oink’, voff ‘bark’, kvack‘ribbit’ and mjau ‘meow’ were often reduplicated.Further, the OE were frequently composedof CVC/CVCV syllables. If the syllablestructure was CCV or CCVC, the second C wasrealized as an approximant/part of a diphthong,as in /kwak:/ or /mjau/. Every other consonant,every other vowel (e.g. vovve) was typical.The non-onomatopoetic words chosen foranalysis had f0 range 80-274Hz, while the OEhad f0 range 0-355Hz. OE thus showed a widerf0 range than non-onomatopoetic words.The interaction of the mother and the childwas characterized by the mother making OEand asking the child: How does a…sound like?The child answered if she knew the expression.If the child did not know any expression – suchas when the mother asked: How does it soundwhen the sun warms nicely? – she simply madea gesture (in this case a circle in the air) andlooked at the mother. In the second recordingthe mother also asked questions on what somebodywas doing. For example, several questionson Pippi did not directly concern OE, but wereof the kind: What do you think ... is doing?Concluding remarksPresumably due to the fact that Swedish doesnot have any particular OE for e.g how a turtlesounds, the mother made up her own expressions.She asked her child how the animalmight sound, made a sound, and added maybeto express her own uncertainty. Sometimeswhen the lack of OE was apparent, such as inthe case of a sun, the mother rather describedhow it feels when the sun warms, haaaa. Alternatively,the mother used several expressions torefer to the same animal, such as kvack and ribbit‘ribbit’ for the frog, or nöff ‘oink’ and avoiceless imitation of the sound of the pig.Among some of the voiced OE a very highf0 was found, e.g. over 200 Hz for pippi. Butsince plenty of the expressions were voiceless,general conclusions on pitch contour characteristicsare hard to make.The OE uttered with creaky voice had a lowf0 between 112-195Hz. Substantially more ofthe OE were uttered with creaky voice as comparedto non-onomatopoetic words in CDS.The OE used by the mother were more orless word-like: nöff ‘oink’ is a word-like expression,while the voiceless imitation of thesound of a pig is not.All the OE had a tendency to be reduplicated.Some were more reduplicated than others,such as pipipi, reflecting how one wants todescribe the animal, as well as that pi is a shortsyllable easy and quick to reduplicate. Similarly,reduplicated voff ‘bark’ was used to refer toa small/intense dog, rather than to a big one.In summary, OE contain all of the characteristicsof CDS – but more of everything. Variationsin intonation are large; the voice quality ishighly modulated. Words are reduplicated,stressed and stretched or produced very quickly.OE are often iconic and therefore easy to understand– they explain the objects via sound illustrationsby adding contents into the concepts.It can be speculated that OE contribute to maintaininteraction by – likely for the child appealing– clear articulatory and acoustic contrasts.AcknowledgementsWe thank Åsa Schrewelius and Idah L-Mubiru,students in Logopedics, for data analysis.ReferencesHamano, S. (1998) The sound-symbolic systemof Japanese. CSLI Publications.Ivanova, G. (2006) Sound symbolic approach toJapanese mimetic words. Toronto WorkingPapers in Linguistics26, 103.Noma, H. (1998) Languages richest in onomatopoeticwords. Language Monthly 27, 30-34.Yule, G. (2006) The study of language, CambridgeUniversity Press, New York.41
<strong>Proceedings</strong>, FONETIK <strong>2009</strong>, Dept. of Linguistics, Stockholm UniversityPhrase initial accent I in South SwedishSusanne Schötz and Gösta BruceDepartment of Linguistics & Phonetics, Centre for Languages and Literature, Lund UniversityAbstractThe topic of this paper is the variability of pitchrealisation of phrase-initial accent I. In ourstudy we have observed a difference in variabilityfor the varieties investigated. CentralSwedish pitch patterns for phrase-initial accentI both to the East (Stockholm) and to theWest (Gothenburg) display an apparent constancy,albeit with distinct patterns: East CentralSwedish rising and West Central Swedishfall-rise. In South Swedish, the correspondingpitch patterns can be described as more variable.The falling default accentual pitch patternin the South is dominating in the majority of thesub-varieties examined, even if a rising patternand a fall-rise are not uncommon here. Thereseems to be a difference in geographical distribution,so that towards northeast within theSouth Swedish region the percentage of a risingpattern has increased, while there is a correspondingtendency for the fall-rise to be a morea frequent pattern towards northwest. The occurrenceof the rising pattern of initial accent Iin South Swedish could be seen as an influencefrom and adaptation to East Central Swedish,and the fall-rise as an adaptation to WestSwedish intonation.IntroductionA distinctive feature of Swedish lexical prosodyis the tonal word accent contrast betweenaccent I (acute) and accent II (grave). It is wellestablished that there is some critical variationin the phonetic realisation of the two word accentsamong regional varieties of Swedish. Accordingto Eva Gårding’s accent typology(Gårding & Lindblad 1973, Gårding 1977)based on Ernst A. Meyer’s data (1937, 1954)on the citation forms of the word accents – disyllabicwords with initial stress – there are fivedistinct accent types to be recognised (see Figure1). These accent types by and large also coincidewith distinct geographical regions of theSwedish-speaking area. For accent I, type 1Ashows a falling pitch pattern, i.e. an early pitchpeak location in the stressed syllable and then afall down to a low pitch level in the next syllable(Figure 1). This is the default pitch patternin this dialect type for any accent I word occurringin a prominent utterance position. However,taking also post-lexical prosody into account,there is some interesting variability to befound specifically for accent I occurring in utterance-/phrase-initialposition.Variability in the pitch realisation of phraseinitialaccent I in South Swedish is the specifictopic of this paper. The purpose of our contributionis to try to account for the observedvariation of different pitch patterns accompanyingan accent I word in this particular phraseposition. In addition, we will discuss some internalvariation in pitch accent realisationwithin the South Swedish region. These pitchpatterns of accent type 1A will also be comparedwith the corresponding reference patternsof types 2A and 2B characteristic of Stockholm(Svea) and Gothenburg (Göta) respectively. SeeFigure 1 for their citation forms.Figure 1. The five accent types in Eva Gårding’saccent typology based on Meyer’s original data.Accentuation and phrasingIn our analysis (Bruce, 2007), the exploitationof accentuation for successive words of aphrase, i.e. in terms of post-lexical prosody, dividesthe regional varieties of Swedish into twodistinct groups. In Central Swedish, both in theWest (Göta, prototype: Gothenburg) and in theEast (Svea, prototype: Stockholm), two distinctlevels of intonational prominence – focal andnon-focal accentuation – are regularly ex-42
<strong>Proceedings</strong>, FONETIK <strong>2009</strong>, Dept. of Linguistics, Stockholm Universityploited. Thus, the expectation for an intonationalphrase containing for example three accentedwords, will be an alternation: focal accentuation+ non-focal accentuation + focal accentuation.The other regional varieties ofSwedish – South, Gotland, Dala, North, andFinland Swedish – turn out to be different inthis respect and make up another group. SouthSwedish, as a case in point, for a correspondingphrase with three accented words, is expectedto have equal prominence on these constituents.This means that for a speaker of South Swedish,focal accentuation is not regularly exploitedas an option distinct from regular accentuation.Figure 2 shows typical examples of aphrase containing three accented words: accentI + accent I + accent II (compound), for threefemale speakers representing East Central(Stockholm), West Central (Gothenburg) andSouth Swedish (Malmö) respectively. Note thedistinct pitch patterns of the first and secondaccent I words of the phrase in the CentralSwedish varieties – as a reflex of the distinctionbetween focal and non-focal accentuation – incontrast with the situation in South Swedish,where these two words have got the same basicpitch pattern.Intonational phrasing is expressed in differentways and more or less explicitly in the differentvarieties, partly constrained by dialectspecificfeatures of accentuation (Figure 2).The rising pitch gesture in the beginning andthe falling gesture at the end of the phrase inEast Central Swedish is an explicit way of signallingphrase edges, to be found also in variousother languages. In West Central Swedish,the rise after the accent I fall in the first word ofthe phrase could be seen as part of an initialpitch gesture, expressing that there is a continuationto follow. However, there is no fallingcounterpart at the end of the phrase, but insteada pitch rise. This rise at the end of a prominentword is analysed as part of a focal accent gestureand considered to be a characteristic featureof West Swedish intonation. In SouthSwedish, the falling gesture at the end of thephrase (like in East Central Swedish) has noregular rising counterpart in the beginning, butthere is instead a fall, which is the dialectspecificpitch realisation of accent I. All threevarieties also display a downdrift in pitch to beseen across the phrase, which is to be interpretedas a signal of coherence within an intonationalphrase.The following sections describe a smallstudy we carried out in order to gain moreknowledge about the pitch pattern variation ofphrase initial accent I in South Swedish.Figure 2. Accentuation and phrasing in varieties ofSwedish. Pitch contours of typical examples of aphrase containing three accented words for EastCentral Swedish (top), West Central Swedish (middle)and South Swedish (bottom).Speech materialThe speech material was taken from the SwedishSpeechDat (Elenius, 1999) – a speech databaseof read telephone speech of 5000 speakers,registered by age, gender, current location andself-labelled dialect type according to Elert’ssuggested 18 Swedish dialectal regions (Elert,1994). For our study, we selected a fair numberof productions of the initial intonational phrase(underlined below) of the sentence Flyget, tågetoch bilbranschen tävlar om lönsamhet ochfolkets gunst ‘Airlines, train companies and theautomobile industry are competing for profitabilityand people’s appreciation’. The targetitem was the initial disyllabic accent I word flyget.In order to cover a sufficient number (11)of varieties of South Swedish spoken in andaround defined localities (often correspondingto towns), our aim was to analyse 12 speakersfrom each variety, preferably balanced for age43
<strong>Proceedings</strong>, FONETIK <strong>2009</strong>, Dept. of Linguistics, Stockholm Universityand gender. In four of the varieties, theSpeechDat database did not include as many as12 speakers. In these cases we settled for asmaller and less gender-balanced speaker set. Inaddition to the South Swedish varieties, we selected12 speakers each from the Gothenburg(Göta) and Stockholm (Svea) area to be used asreference varieties. Table 1 shows the numberand gender distribution of the speakers. Thegeographical location of the sub-varieties aredisplayed on a map of South Sweden in Figure3.Table 1. Number and gender distribution of speakersfrom each sub-variety of South Swedish and thereference varieties used in the study.Sub-variety (≈ town) Female Male TotalSouthern Halland (Laholm) 3 7 10Ängelholm 7 4 11Helsingborg 5 7 12Landskrona 5 7 12Malmö 6 6 12Trelleborg 3 6 9Ystad 7 5 12Simrishamn 5 2 7Kristianstad 7 5 12Northeastern Skåne& Western Blekinge4 5 9Southern Småland 5 7 12Gothenburg (reference variety) 6 6 12Stockholm (reference variety) 6 6 12Total 69 73 142Figure 3. Geographic location of the South Swedishand the two reference varieties used in the study.The location of the reference varieties on the map isonly indicated and not according to scale.MethodOur methodological approach combined auditoryjudgment, visual inspection and acousticanalysis of pitch contours using the speechanalysis software Praat (Boersma and Weenick,<strong>2009</strong>). Praat was used to extract the pitch contoursof all phrases, to smooth them (using a 10Hz bandwidth), and to draw pitch contours usinga semitone scale. Auditory analysis includedlistening to the original sound as well as thepitch (using a Praat function which plays backthe pitch with a humming sound).Identification of distinct types of pitchpatternsThe first step was to identify the different typesof pitch gestures occurring for phrase-initialaccent I and to classify them into distinct categories.It should be pointed out that our classificationhere was made from a melodic ratherthan from a functional perspective. We identifiedthe following four distinct pitch patterns:1) Fall: a falling pitch contour often used inSouth Swedish and corresponding to the citationform of type 1A2) Fall-rise: a falling-rising pattern typicallyoccurring in the Gothenburg variety3) Rise: a rising pattern corresponding to thepattern characteristic of the Stockholm variety4) Level: a high level pitch contour with somerepresentation in most varietiesWe would like to emphasise that our division ofthe pitch contours under study into these fourcategories may be considered as an arbitrarychoice to a certain extent. Even if the classificationof a particular pitch contour as falling orrising may be straightforward in most cases, wedo not mean to imply that the four categorieschosen by us should be conceived of as selfevidentor predetermined. It should be admittedthat there were a small number of unclearcases, particularly for the classification as highlevel or rising and as high level or fall-rise.These cases were further examined by the twoauthors together and finally decided on. Figure4 shows typical pitch contours of one femaleand one male speaker for each of the four patterns.44
<strong>Proceedings</strong>, FONETIK <strong>2009</strong>, Dept. of Linguistics, Stockholm UniversityResultsCategorisation of the speakers into distinctpitch pattern typesThe results of our categorisation can be seen inTable 2. In the South Swedish varieties the fallpattern dominated (54 speakers), but the otherthree patterns were not uncommon with 25, 23and 17 speakers respectively. In the Gothenburgvariety, eleven speakers used the fall-riseintonation, and only one was classified as belongingto the level category. Ten Stockholmspeakers had produced the rise pattern, whiletwo speakers used the level pattern.Table 2. Results of the categorisation of the 142speakers into the four distinct categories fall, fallrise,rise and level along with their distributionacross the South Swedish, Gothenburg and Stockholmvarieties.Pattern South Sweden Gothenburg StockholmFall 54 0 0Fall-rise 17 11 0Rise 23 0 10Level 24 1 2Total 118 12 12Figure 4. Two typical pitch contours of the initialphrase Flyget, tåget och bilbranschen ‘Airlines,train companies and the automobile industry’ foreach of the four distinct pitch pattern types found inthe South Swedish varieties of this study: fall, fallrise,rise and level (solid line: female speaker;dashed line: male speaker).Geographical distributionFigure 5 shows the geographical distribution ofthe four patterns across varieties. Each pie chartin the figure represents the distribution of patternswithin one sub-variety. The southern andwestern varieties of South Swedish display amajority of the fall pattern, although other patternsare represented as well. In the northwesternvarieties, the fall pattern is much less common(only one speaker each in Ängelholm andsouthern Halland), while the fall-rise pattern –the most common one in the Gothenburg variety– is more frequent. Moreover, the level patternis also more common here than in the varietiesfurther to the south. The fall pattern isalso common in Kristianstad and in northeasternSkåne and western Blekinge. In these twovarieties the rise pattern – the category used bymost speakers in Stockholm – is also rathercommon. As already mentioned, no fall patternwas observed in the two reference varieties. InGothenburg the fall-rise pattern is used by allspeakers except one, while Stockholm displaysa vast majority of rise patterns and two levelones.45
<strong>Proceedings</strong>, FONETIK <strong>2009</strong>, Dept. of Linguistics, Stockholm UniversityFigure 6. Pitch contours of the initial phrase Flyget,tåget och bilbranchen ‘Airlines, train companiesand the automobile industry’ produced by 118South Swedish speakers.Figure 5. Geographical distribution of the four pitchpatterns of phrase-initial accent I observed in SouthSwedish varieties and two reference varieties(Stockholm and Gothenburg Swedish).Additional observationsWhile we have observed a variability for pitchpatterns accompanying the accent I word in initialposition of the phrase under study in SouthSwedish, the other two accented words of thephrase show an apparent constancy for theirpitch patterns. The second accent I word tågethas the regular falling pattern, while the thirdfinal word of the phrase bilbranschen (accent IIcompound) displays an expected rise-fall on thesequence of syllables consisting of the primarystress (the first syllable of the word) and thenext syllable. This is true of basically all productionsof each variety of South Swedish, ascan be seen in Figure 6, showing the pitch contoursof all South Swedish speakers.DiscussionIn our study of the phonetic realisation of anaccent I word in phrase-initial position, wehave observed a difference in variability for thevarieties investigated. Even if it should beadmitted that there may be some difficulties ofclassification of the pitch patterns involved, andthat the data points in our study may be relativelyfew, the variability among pitch patternsfor phrase-initial accent I is still clear. So whilethe Central Swedish pitch patterns for phraseinitialaccent I both to the East (Stockholm) andto the West (Gothenburg) display an apparentconstancy, albeit with distinct patterns – EastCentral Swedish rising and West Central Swedishfall-rise – the corresponding pitch patternsin South Swedish can be described as morevariable. This would appear to be true of eachof the sub-varieties in this group, but there isalso an interesting difference between some ofthem. As we have seen, the falling default pitchpattern in the South is dominating in the majorityof the sub-varieties examined, even if both arising pattern and a fall-rise are not uncommonhere. But there seems to be a difference in geographicaldistribution, so that towards northeastwithin the South Swedish region the percentageof a rising pattern has increased, while there isa corresponding tendency for the fall-rise to bea more a frequent pattern towards northwest. Ahigh level pitch, which can be seen as functionallyequivalent to the rising pattern (and maybeeven to the fall-rise), is a relatively frequentpattern only in some northern sub-varieties ofthe South Swedish region.It is tempting to interpret the occurrence ofthe rising pattern of initial accent I in South46
<strong>Proceedings</strong>, FONETIK <strong>2009</strong>, Dept. of Linguistics, Stockholm UniversitySwedish as an influence from and adaptation toEast Central Swedish. Also the occurrence ofthe fall-rise can be seen as an adaptation toWest Swedish intonation. The addition of a riseafter the falling gesture resulting in a fall-rise(typical of West Central Swedish) would – for aSouth Swedish speaker – appear to be less of aconcession than the substitution of a fallingpitch gesture with a rising one. The added riseafter the fall for phrase-initial accent I does notseem to alter the intonational phrasing in a fundamentalway. But even if a rising pitch gesturefor initial accent I may appear to be a morefundamental change of the phrase intonation, itstill seems to be a feasible modification ofSouth Swedish phrase intonation. The integrationof a rising pattern in this phrase positiondoes not appear to disturb the general structureof South Swedish phrase intonation. Our impressionis further that having a rising pitchgesture on the first accent I word followed by aregular falling gesture on the second word (creatinga kind of hat pattern as it were) does notchange the equal prominence to be expected forthe successive words of the phrase under studyeither. Moreover, a pitch rise in the beginningof an intonation unit (as well as a fall at the endof a unit) could be seen as a default choice forintonational phrasing, if the language or dialectin question does not impose specific constraintsdictated for example by features of accentuation.[computer program]. http://www.praat.org/,visited 30-Mar-09.Bruce G. (2007) Components of a prosodic typologyof Swedish intonation. In Riad T.and Gussenhoven C. (eds) Tones andTunes, Volume 1, 113-146, Berlin: Moutonde Gruyter.Elenius K. (1999) Two Swedish SpeechDat databases- some experiences and results.Proc. of Eurospeech 99, 2243-2246.Elert C.-C. (1994) Indelning och gränser inomområdet <strong>för</strong> den nu talade svenskan - en aktuelldialektografi. In Edlund L. E. (ed) Kulturgränser- myt eller verklighet, Umeå,Sweden: Diabas, 215-228.Gårding E. (1977) The Scandinavian word accents.Lund, Gleerup.Gårding E. and Lindblad P. (1973) Constancyand variation in Swedish word accent patterns.Working Papers 7. Lund: Lund University,Phonetics Laboratory, 36-110.Meyer E. A. (1937) Die Intonation imSchwedischen, I: Die Sveamundarten. StudiesScand. Philol. Nr. 10. Stockholm University.Meyer E. A. (1954) Die Intonation imSchwedischen, II: Die Sveamundarten.Studies Scand. Philol. Nr. 11. StockholmUniversity.AcknowledgementsThis paper was initially produced as an invitedcontribution to a workshop on phrase-initialpitch contours organised by Tomas Riad andSara Myrberg at the Scandinavian LanguagesDepartment, Stockholm University in March<strong>2009</strong>. It is related to the SIMULEKT project(cf. Beskow et al., 2008), a co-operation betweenPhonetics at Lund University and SpeechCommunication at KTH Stockholm, funded bythe Swedish Research Council 2007-<strong>2009</strong>.ReferencesBeskow J., Bruce G., Enflo L., Granström B.,and Schötz S. (alphabetical order) (2008)Recognizing and Modelling Regional Varietiesof Swedish. <strong>Proceedings</strong> of Interspeech2008, Brisbane, Australia.Boersma P. and Weenink D. (<strong>2009</strong>) Praat: doingphonetics by computer (version 5.1)47
<strong>Proceedings</strong>, FONETIK <strong>2009</strong>, Dept. of Linguistics, Stockholm UniversityModelling compound intonation in Dala and GotlandSwedishSusanne Schötz 1 , Gösta Bruce 1 , Björn Granström 21 Department of Linguistics & Phonetics, Centre for Languages & Literature, Lund University2 Department of Speech, Music & Hearing, School of Computer Science & Communication, KTHAbstractAs part of our work within the SIMULEKT project,we are modelling compound word intonationin regional varieties of Swedish. The focusof this paper is on the Gotland and Dala varietiesof Swedish and the current version ofSWING (SWedish INtonation Generator). Weexamined productions by 75 speakers of thecompound mobiltelefonen ‘the mobile phone’.Based on our findings for pitch patterns incompounds we argue for a possible divisioninto three dialect regions: 1) Gotland: a highupstepped pitch plateau, 2) Dala-Bergslagen: ahigh regular pitch plateau, and 3) Upper Dalarna:a single pitch peak in connection with theprimary stress of the compound. The SWINGtool was used to model and simulate compoundsin the three intonational varieties. Futurework includes perceptual testing to see iflisteners are able to identify a speaker as belongingto the Gotland, Dala-Bergslagen orUpper Dalarna regions, depending on the pitchshape of the compound.IntroductionWithin the SIMULEKT project (Simulating IntonationalVarieties of Swedish) (Bruce et al.,2007), we are studying the prosodic variationcharacteristic of different regions of the Swedish-speakingarea. Figure 1 shows a map ofthese regions, corresponding to our present dialectclassification scheme.In our work, various forms of speech synthesisand the Swedish prosody model (Bruce& Gårding, 1978; Bruce & Granström, 1993;Bruce, 2007) play prominent roles. To facilitateour work with testing and further developingthe model, we have designed a tool for analysisand modelling of Swedish intonation byresynthesis: SWING. The aim of the presentpaper is two-fold: to explore variation incompound word intonation specifically in tworegions, namely Dala and Gotland Swedish,and to describe the current version of SWINGand how it is used to model intonation inregional varieties of Swedish. We willexemplify this with the modelling of pitchmodelling of pitch patterns of compounds inDala and Gotland Swedish.Figure 1. Approximate geographical distribution ofthe seven main regional varieties of Swedish.Compound word intonationThe classical accent typology by Gårding(1977) is based on Meyer’s (1937, 1954) pitchcurves in disyllabic simplex words with initialstress having either accent I or accent II. Itmakes a first major division of Swedish intonationinto single-peaked (1) and double-peaked(2) types, based on the number of pitch peaksfor a word with accent II. According to this typology,the double-peaked type is found inCentral Swedish both to the West (Göta) and tothe East (Svea) as well as in North Swedish.The single-peaked accent type is characteristicof South Swedish, Dala and Gotland regionalvarieties. Within this accent type there is a furtherdivision into the two subtypes 1A and 1Bwith some difference in pitch peak timing –earlier-later – relative to the stressed syllable. Ithas been shown that the pitch patterns of compoundwords can be used as an even better diagnosticthan simplex words for distinguishing48
<strong>Proceedings</strong>, FONETIK <strong>2009</strong>, Dept. of Linguistics, Stockholm Universitybetween intonational varieties of Swedish (Riad1998, Bruce 2001, 2007). A compound word inSwedish contains two stresses, primary stress(ˈ) on the first element and secondary stress (ˌ)on the final element. In most varieties of Swedisha compound takes accent II. The exceptionis South Swedish where both accents can occur(Bruce, 2007). A critical issue is whether thesecondary stress of a compound is a relevantsynchronisation point for a pitch gesture or not.Figure 2 shows stylised pitch patterns of accentII compounds identifying four different shapescharacteristic of distinct regional varieties ofSwedish (Bruce 2001). The target patterns forour discussion in this paper are the two typeshaving either a single peak in connection withthe primary stress of the compound or a highplateau between the primary and the secondarystresses of the word. These two accentual typesare found mainly in South Swedish, and in theDala region and on the isle of Gotland respectively.It has been suggested that the pitch patternof an accent II compound in the Gotlandand Dala dialect types has basically the sameshape with the high pitch plateau extendingroughly from the primary to the secondarystress of the word. The specific point of interestof our contribution is to examine the idea aboutthe similarity of pitch patterns of compoundwords particularly in Gotland and Dala Swedish.Figure 2. Schematic pitch patterns of accent II compoundwords in four main intonational varieties ofSwedish (after Bruce, 2001). The first arrow marksthe CV-boundary of the primary stress, and the second/thirdarrow marks the CV-boundary of the secondarystress. In a “short” compound the twostresses are adjacent, while in a “long” compoundthe stresses are not directly adjacent.Speech material and methodThe speech material was taken from the SwedishSpeechDat (Elenius, 1999), a database containingread telephone speech. It containsspeech of 5000 speakers registered by age,gender, current location and self-labelled dialecttype according to Elert’s suggested 18Swedish dialectal regions (Elert, 1994). As targetword of our examination, we selected theinitial “long” compound /moˈbilteleˌfonen/ fromthe sentence Mobiltelefonen är nittiotalets storafluga, både bland <strong>för</strong>etagare och privatpersoner.‘The mobile phone is the big hit of thenineties, both among business people and privatepersons’. Following Elert’s classification,we selected 75 productions of mobiltelefonenfrom the three dialect regions which can be labelledroughly as Gotland, Dala-Bergslagenand Upper Dalarna Swedish (25 speakers ofeach dialect).F 0 contours of all productions wereextracted, normalised for time (expressed as thepercentage of the word duration) and plotted ona semitone scale in three separate graphs: onefor each dialectal region.Tentative findingsFigure 3 shows the F 0 contours of the speakersfrom the three dialectal regions examined. Evenif there is variation to be seen among F 0 contoursof each of these graphs, there is also someconstancy to be detected. For both Gotland andDala-Bergslagen a high pitch plateau, i.e. earlyrise + high level pitch + late fall, for the compoundcan be traced. A possible difference betweenthe two dialect types may be that, whilespeakers representing Dala-Bergslagen Swedishhave a regular high pitch plateau, Gotlandspeakers tend to have more of an upsteppedpitch pattern for the plateau, i.e. early rise +high level pitch + late rise & fall.Among the speakers classified as representingUpper Dalarna Swedish there is more internalvariation of the F 0 contours to be seen.However, this variation can be dissolved asconsisting of two basic distinct pitch patterns,either a single pitch peak in connection with theprimary stress of the compound or a high pitchplateau. These two patterns would appear tohave a geographical distribution within thearea, so that the high pitch plateau is morelikely to occur towards South-East, i.e. inplaces closer to the Dala-Bergslagen dialect region.49
<strong>Proceedings</strong>, FONETIK <strong>2009</strong>, Dept. of Linguistics, Stockholm UniversityFigure 4 shows examples of typical F 0 contoursof the compound word mobiltelefonen producedby one speaker from each of the threedialect regions discussed. For the speaker fromGotland the high plateau is further boosted by asecond rise before the final fall creating an upsteppedpitch pattern through the compoundword. The example compound by the speakerfrom Dala-Bergslagen is characterised by ahigh pitch plateau instead, i.e. a high pitch levelextending between the rise synchronised withthe primary stress and the fall aligned with thesecondary stress. A single pitch peak in connectionwith the primary stress of the compoundfollowed by a fall and a low pitch level in connectionwith secondary stress of the word ischaracteristic of the speaker representing UpperDalarna Swedish.Figure 4. Compound word intonation. Typical exampleF 0 contours of mobiltelefonen produced by aspeaker from each of the three dialect regions Gotland,Dala-Bergslagen and Upper Dalarna Swedish.Figure 3. Variation in compound word intonation.F 0 contours of the compound word mobiltelefonen(accent II) produced by 25 speakers each of Gotland,Dala-Bergslagen and Upper Dalarna Swedish.SWINGSWING (SWedish INtonation Generator) is atool for analysis and modelling of Swedish intonationby resynthesis. It comprises severalparts joined by the speech analysis softwarePraat (Boersma & Weenink, <strong>2009</strong>), which alsoserves as graphical interface. Using an inputannotated speech sample and an input rule file,SWING generates and plays PSOLA resynthesis– with rule-based and speaker-normalised intonation– of the input speech sample. Additionalfeatures include visual display of the output onthe screen, and options for printing variouskinds of information to the Praat console (Infowindow), e.g. rule names and values, the timeand F 0 of generated pitch points etc. Figure 5shows a schematic overview of the tool.The input speech sample to be used with thetool is manually annotated. Stressed syllablesare labelled prosodically and the correspondingvowels are transcribed orthographically. Figure50
<strong>Proceedings</strong>, FONETIK <strong>2009</strong>, Dept. of Linguistics, Stockholm UniversityFigure 5. Schematic overview of the SWING tool.6 displays an example compound word annotation,while Table 1 shows the prosodic labelsthat are handled by the current version of thetool.Figure 6. Example of an annotated input speechsample.Table 1. Prosodic labels used for annotation ofspeech samples to be analysed by SWING.Label Descriptionpa1 primary stressed (non-focal) accent 1pa2 primary stressed (non-focal) accent 2pa1f focal focal accent 1pa2f focal focal accent 2cpa1 primary stressed accent 1 in compoundscpa2 primary stressed accent 2 in compoundscsa1 secondary stressed accent 1 in compoundscsa2 secondary stressed accent 2 in compoundsRulesIn SWING, the Swedish prosody model is implementedas a set of rule files – one for eachregional variety of the model – with timing andF 0 values for critical pitch points. These filesare text files with a number of columns; thefirst contains the rule names, and the followingcomprise three pairs of values, correspondingto the timing and F 0 of the critical pitch pointsof the rules. The three points are called ini (initial),mid (medial), and fin (final). Each pointcontains values for timing (T) and F 0 (F0).Timing is expressed as a percentage into thestressed syllable, starting from the onset of thestressed vowel. Three values are used for F 0 : L(low), H (high) and H+ (extra high, used in focalaccents). The pitch points are optional; theycan be left out if they are not needed by a rule.New rules can easily be added and existingones adjusted by editing the rule file. Table 2shows an example of the rules for compoundwords in Gotland, Dala-Bergslagen and UpperDalarna Swedish. Several rules contain an extrapitch gesture in the following (unstressed) segmentof the annotated input speech sample.This extra part has the word ‘next’ attached toits rule name; see e.g. cpa2 in Table 2.Table 2. Rules for compound words in Gotland,Dala-Bergslagen and Upper Dalarna Swedish withtiming (T) and F 0 (F0) values for initial (ini), mid(mid) and final (fin) points (‘_next’: extra gesture;see Table 1 for additional rule name descriptions).iniT iniF0 midT midF0 finT finF0Gotlandcpa2 50 Lcpa2_next 30 Hcsa2 30 H 70 H+csa2_next 30 LDala-Bergslagencpa2 50 Lcpa2_next 30 Hcsa2 30 Hcsa2_next 30 LUpper Dalarnacpa2 0 L 60 Hcpa2_next 30 Lcsa2ProcedureAnalysis with the SWING tool is fairly straightforward.The user selects one input speech sampleand one rule file to use with the tool, andwhich (if any) text (rules, pitch points, debugginginformation) to print to the Praat console.A Praat script generates resynthesis of the51
<strong>Proceedings</strong>, FONETIK <strong>2009</strong>, Dept. of Linguistics, Stockholm Universityinput speech sample with a rule-based outputpitch contour based on 1) the pitch range of theinput speech sample, used for speaker normalisation,2) the annotation, used to identify thetime and pitch gestures to be generated, and 3)the rule file, containing the values of the criticalpitch points. The Praat graphical user interfaceprovides immediate audio-visual feedback ofhow well the rules work, and also allows foreasy additional manipulation of pitch pointswith the Praat built-in Manipulation feature.Modelling compounds with SWINGSWING is now being used in our work with testingand developing the Swedish prosody modelfor compound words. Testing is done by selectingan input sound sample and a rule file of thesame intonational variety. If the model worksadequately, there should be a close match betweenthe F 0 contour of the original version andthe rule-based one generated by the tool. Figure7 shows Praat Manipulation objects for thethree dialect regions Gotland, Dala-Bergslagenand Upper Dalarna Swedish modelled with thecorresponding rules for each dialect region.Figure 7. Simulation of compound words withSWING. Praat Manipulation displays of mobiltelefonenof the three dialect regions Gotland, Dala-Bergslagen and Upper Dalarna Swedish (simulation:circles connected by solid line; original pitch: lightgreyline).The light grey lines show the original pitch ofeach dialect region, while the circles connectedwith the solid lines represent the rule-generatedoutput pitch contours.As can bee seen in Figure 7, the simulated(rule-based) pitch patterns clearly resemble thecorresponding three typical compound wordintonation patterns shown in Figure 4. There isalso a close match between the original pitch ofthe input speech samples and the simulatedpitch contour in all three dialectal regions.Discussion and additional remarksThe present paper partly confirms earlier observationsabout pitch patterns of word accentuationin the regional varieties of Dala andGotland Swedish, and partly adds new specificpieces of information, potentially extending ourknowledge about compound word intonation ofthese varieties.One point of discussion is the internal variationwithin Dala Swedish with a differentiationof the pitch patterns of word accents into UpperDalarna and Dala-Bergslagen intonational subvarieties.This division has earlier been suggestedby Engstrand and Nyström (2002) revisitingMeyer’s pitch curves of the two word accentsin simplex words, with speakers representingUpper Dalarna having a slightly earliertiming of the relevant pitch peak than speakersfrom Dala-Bergslagen. See also Olander’sstudy (2001) of Orsa Swedish as a case in pointconcerning word intonation in a variety of UpperDalarna.Our study of compound word intonationclearly demonstrates the characteristic risingfallingpitch pattern in connection with the primarystress of a compound word in Upper Dalarnaas opposed to the high pitch plateau betweenthe primary and secondary stresses of thecompound in Dala-Bergslagen, even if there isalso some variability among the differentspeakers investigated here. We would even liketo suggest that compound word intonation inDala-Bergslagen and Upper Dalarna Swedish ispotentially distinct. It would also appear to betrue that a compound in Upper Dalarna has gotthe same basic pitch shape as that of SouthSwedish. Generally, word intonation in UpperDalarna Swedish and South Swedish wouldeven seem to be basically the same.Another point of discussion is the suggestedsimilarity of word intonation between Dala andGotland Swedish. Even if the same basic pitchpattern of an accent II compound – the pitchplateau – can be found for speakers representingvarieties of both Dala-Bergslagen and Gotland,there is also an interesting difference to bediscerned and further examined. As has beenshown above, Gotland Swedish speakers tendto display more of an upstepped pitch shape for52
<strong>Proceedings</strong>, FONETIK <strong>2009</strong>, Dept. of Linguistics, Stockholm Universitythe compound word, while Dala-Berslagenspeakers have a more regular high pitch plateau.Our preliminary simulation of compoundword intonation for Dala and Gotland with theSWING tool is also encouraging. We are planningto run some perceptual testing to seewhether listeners will be able to reliably identifya speaker as belonging to the Gotland,Dala-Bergslagen or Upper Dalarna regions dependingon the specific pitch shape of the compoundword.AcknowledgementsThe work within the SIMULEKT project isfunded by the Swedish Research Council 2007-<strong>2009</strong>.ReferencesBoersma P. and Weenink D. (<strong>2009</strong>) Praat: doingphonetics by computer (version 5.1)[computer program]. http://www.praat.org/,visited 30-Mar-09.Bruce G. (2001) Secondary stress and pitch accentsynchronization in Swedish. In vanDommelen W. and Fretheim T. (eds) NordicProsody VIII, 33-44, Frankfurt amMain: Peter Lang.Bruce G. (2007) Components of a prosodic typologyof Swedish intonation. In Riad T.and Gussenhoven C. (eds) Tones andTunes, Volume 1, 113-146, Berlin: Moutonde Gruyter.Bruce G. and Gårding E. (1978) A prosodic typologyfor Swedish dialects. In Gårding E.,Bruce G. and Bannert R. (eds) Nordic Prosody,219-228. Lund: Department of Linguistics.Bruce G. and Granström B. (1993) Prosodicmodelling in Swedish speech synthesis.Speech Communication 13, 63-73.Bruce G., Granström B., and Schötz S. (2007)Simulating Intonational Varieties of Swedish.Proc. of ICPhS XVI, Saarbrıücken, Germany.Elenius K. (1999) Two Swedish SpeechDat databases- some experiences and results.Proc. of Eurospeech 99, 2243-2246.Elert C.-C. (1994) Indelning och gränser inomområdet <strong>för</strong> den nu talade svenskan - en aktuelldialektografi. In Edlund L.E. (ed) Kulturgränser- myt eller verklighet, Umeå,Sweden: Diabas, 215-228.Engstrand O. and Nyström G. (2002) Meyer´saccent contours revisited. <strong>Proceedings</strong> from<strong>Fonetik</strong> 2002, the XVth Swedish PhoneticsConference, Speech, Music and Hearing,Quarterly Progress and Status Report 44,17-20. KTH, Stockholm.Gårding E. (1977) The Scandinavian word accents.Lund, Gleerup.Gårding E. and Lindblad P. (1973) Constancyand variation in Swedish word accent patterns.Working Papers 7. Lund: Lund University,Phonetics Laboratory, 36-110.Meyer E. A. (1937) Die Intonation imSchwedischen, I: Die Sveamundarten. StudiesScand. Philol. Nr. 10. Stockholm University.Meyer E. A. (1954) Die Intonation imSchwedischen, II: Die Sveamundarten.Studies Scand. Philol. Nr. 11. StockholmUniversity.Olander E. (2001) Word accents in the Orsadialect and in Orsa Swedish. In <strong>Fonetik</strong>2001, 132-135. Working Papers 49, Linguistics,Lund University.Riad T. (1998) Towards a Scandinavian accenttypology. In Kehrein W. and Wiese R. (eds)Phonology and morphology of the Germaniclanguages, 77-109. Tübingen: MaxNiemeyer.53
<strong>Proceedings</strong>, FONETIK <strong>2009</strong>, Dept. of Linguistics, Stockholm UniversityThe acoustics of Estonian Swedish long close vowelsas compared to Central Swedish and Finland SwedishEva Liina Asu 1 , Susanne Schötz 2 and Frank Kügler 31 Institute of Estonian and General Linguistics, University of Tartu2 Department of Linguistics and Phonetics, Centre for Languages and Literature, Lund University3 Department of Linguistics, Potsdam UniversityAbstractThis pilot study investigates the phonetic realisationof Estonian Swedish long close vowelscomparing them with Central Swedish and FinlandSwedish counterparts. It appears that inthe Rickul variety of Estonian Swedish there isa distinction between only three long closevowels. The analysed vowels of Estonian Swedishare more similar to those of Central Swedishthan Finland Swedish, as measured by theEuclidean distance. Further research withmore data is needed to establish the exactvowel space and phonetic characteristics of EstonianSwedish dialects.IntroductionThis study is a first step in documenting thephonetic characteristics of Estonian Swedish(ES), a highly endangered variety of Swedishspoken historically on the islands and westerncoast of Estonia. Despite its once flourishingstatus, ES is at present on the verge of extinction.Most of the Estonian Swedish communityfled to Sweden during WWII. Today only ahandful of elderly native ES speakers remain inEstonia, and about a hundred in Sweden.ES has received surprisingly little attentionand was not, for instance, included in theSweDia 2000 project (Bruce et al., 1999) becausethere were no speakers from youngergenerations. To our knowledge, ES has notbeen analysed acoustically before; all the existingwork on its sound system has been conductedin the descriptive framework of dialectresearch (e.g. E. Lagman, 1979). Therefore, theaim of this study is to carry out the first acousticanalysis of ES by examining the quality ofclose vowels. In this pilot study we will focuson ES long close vowels comparing them tothose of Finland Swedish (FS) and CentralSwedish (CS), the two varieties of Swedish thathave had most influence on ES in recent times.Swedish is unique among world’s languagesbecause of a number of phonologically distinctcontrasts in the inventory of close vowels (cf.Ladefoged and Maddieson, 1996). It has beenshown, however, that there is considerablevariation in the realisation of these contrastsdepending on the variety of Swedish (Elert,2000, Kuronen, 2001). Thus, the study of closevowels seems like a good place where to startthe acoustic analysis of ES sound system.General Characteristics of EstonianSwedishSwedish settlers started arriving in Estonia inthe Middle Ages. During several centuries, theycontinued coming from various parts in Swedenand Finland bringing different dialects whichinfluenced the development of separate ES varieties.ES dialects are usually divided into fourdialect areas on the basis of their sound systemand vocabulary (see Figure 1).Figure 1. The main dialect areas of Estonian Swedishin the 1930s (from E. Lagman 1979: 2).54
<strong>Proceedings</strong>, FONETIK <strong>2009</strong>, Dept. of Linguistics, Stockholm UniversityThe largest area is the Nuckö-Rickul-Ormsöarea (including Dagö) followed by the Rågö-Korkis-Vippal area. Separate dialect areas areformed by the Island of Runö and the Island ofNargö. E. Lagman (1979: 5) claims that connectionsbetween the different dialect areaswere not particularly lively which made it possiblefor the separate dialects to retain theircharacteristic traits up to modern times.Another factor which has shaped ES is thefact that until the 20th century, ES dialectswere almost completely isolated from varietiesof Swedish in Sweden, and therefore did notparticipate in several linguistic changes that occurredfor instance in Standard Swedish (Tiberg,1962: 13, Haugen, 1976), e.g. the GreatQuantity shift that took place in most Scandinavianvarieties between 1250 and 1550. ES, asopposed to Standard Swedish, has retained thearchaic ‘falling’ diphthongs, e.g. stain ‘sten’(stone), haim ‘hem’ (home) (E. Lagman, 1979:47). Starting from the end of the 19th century,however, ES came gradually in closer contactwith above all Stockholm Swedish and FinlandSwedish. It was also around that time that theso called ‘high’ variety of ES (den estlandssvenskahögspråksvarianten) appeared inconnection with the development of the educationsystem. This was the regional standard thatwas used as a common language within the EScommunity.According to E. Lagman (1979: 5) the mainfeatures of ES dialects resemble most those ofthe variety of Swedish spoken in Nyland inSouth Finland. Lexically and semantically, theES dialects have been found to agree with FinlandSwedish and North Swedish (Norrbotten)dialects on the one hand, and with dialects inEast Central (Uppland) and West (Götaland)Sweden and the Island of Gotland on the otherhand (Bleckert, 1986: 91). It has been claimedthat the influence of Estonian on the sound systemof ES is quite extensive (Danell, 1905-34,ref. in H. Lagman, 1971: 13) although it has tobe noted that the degree of language contactwith Estonian varied considerably dependingon the dialect area (E. Lagman, 1979: 4).Swedish long close vowelsOf the three varieties of Swedish included inthe present study, it is the CS close vowels thathave been subject to most extensive acousticand articulatory analyses. Considerably less isknown about FS vowels, and no acoustic data isso far available for ES vowels.CS exhibits a phonological four way contrastin close vowels /iː – yː – ʉː – uː/ where /iː/, / yː/ and /ʉː/ are front vowels with manysimilar articulatory and acoustic features, and/uː/ is a back vowel (Riad, 1997). While /iː/ isconsidered an unrounded vowel and /yː/ itsrounded counterpart, /ʉː/ has been referred toas: (1) a labialised palatal vowel with a tongueposition similar (but slightly higher) to [ø:], butwith a difference in lip closure (Malmberg,1966: 99-100), (2) a close rounded front vowel,more open than [iː] and [yː] (Elert, 2000: 28;31; 49), (3) a further back vowel pronouncedwith pursed lips (hopsnörpning) rather than lipprotrusion as is the case with /yː/ (Kuronen,2000: 32), and (4) a protruded (framskjuten)central rounded vowel (Engstrand, 2004: 113).The two vowels /iː/ and /yː/ display similarF1 and F2 values (Fant, 1969), and can be separatedonly by F3, which is lower for /y:/.Malmberg (1966: 101) argues that the onlyrelevant phonetic difference between /ʉ:/ and/y:/ can be seen in the F2 and F3 values.An additional characteristic of long closevowels in CS is that they tend to be diphthongised.Lowering of the first three formants at theend of the diphthongised vowels /ʉː/ and /uː/has been reported by e.g. Kuronen (2000: 81-82), while the diphthongisation of /iː/ and /yː/results in a higher F1 and lower F2 at the end ofthe vowel (Kuronen, 2000: 88).In FS, the close vowels differ somewhatfrom the CS ones, except /u:/ that is rather similarin both varieties. FS /iː/ and /yː/ are pronouncedmore open and further front than theirCS counterparts. Acoustically, these vowels arerealised with lower F1 and higher F2 valuesthan in CS (Kuronen, 2000: 59). In FS, theclose central /ʉː/ is pronounced further backthan in CS (Kuronen, 2000: 60; 177). There issome debate over as to whether the characteristicsof FS are a result of language contact withFinnish (Kuronen, 2000: 60) or an independentdialectal development (Niemi, 1981).The quality of the rounded front vowel /yː/in the ‘high’ variety of ES is more open than inStandard Swedish (Lagman, 1979: 9). Therounded front vowel /yː/ is said to be missing inES dialects (Tiberg, 1962: 45, E. Lagman,1979: 53) and the word by (village) is pronouncedwith an /iː/. It seems, though, that theexact realisation of the vowel is heavily dependenton its segmental context and the dialect,and most probably also historical soundchanges. Thus, in addition to [iː] /yː/ can be realisedas [eː], [ɛː], or [ʉː] or as a diphthong55
<strong>Proceedings</strong>, FONETIK <strong>2009</strong>, Dept. of Linguistics, Stockholm University[iœː] or [iʉː] (for examples see E. Lagman,1979: 53). Considering this variation, it isnearly impossible to predict how /yː/ might berealised in our ES data. Based on E. Lagman’scomment (1979: 5) about ES being most similarto the Nyland variety of FS, we can hypothesisethat ES vowels would be realisedcloser to those of FS than CS. Yet, we wouldnot expect exactly the same distribution ofclose vowels in ES as in FS or CS.Materials and methodSpeech dataAs materials the word list from the SweDia2000 database was used. The data comprisedthree repetitions of four words containing longclose vowels: dis (mist), typ (type), lus (louse),sot (soot). When recording the ES speakers, theword list had to be adapted slightly because notall the words in the list appear in ES vocabulary.Therefore, dis was replaced by ris (rice),typ by nyp (pinch) and sot by mot (against).Four elderly ES speakers (2 women and 2men) were recorded in a quiet setting in Stockholmin March <strong>2009</strong>. All the speakers had arrivedin Sweden in the mid 1940s as youngstersand were between 80 and 86 years old (meanage 83) at the time of recording. They representthe largest dialect area of ES, the Rickul variety,having all been born there (also all theirparents came from Rickul). The ES speakerswere recorded using the same equipment as forcollecting the SweDia 2000 database: a Sonyportable DAT recorder TCD-D8 and Sony tiepintype condenser microphones ECM-T140.For the comparison with CS and FS theword list data from the SweDia 2000 databasefrom two locations was used: Borgå in Nylandwas selected to represent FS, while CS was representedby Kårsta near Stockholm. From eachof these locations the recordings from 3 olderwomen and 3 older men were analysed. TheBorgå speakers were between 53 and 82 yearsold (mean age 73), and the Kårsta speakers between64 and 74 years old (mean age 67).AnalysisThe ES data was manually labelled and segmented,and the individual repetitions of thewords containing long close vowels were extractedand saved as separate sound and annotationfiles. Equivalent CS and FS data was extractedfrom the SweDia database using a Praatscript. The segmentation was manually checkedand corrected.A Praat script was used for obtaining thevalues for the first three formant frequencies(F1, F2, F3) of each vowel with the Burgmethod. The measurements were taken at themid-point of each vowel. All formant valueswere subsequently checked and implausible ordeviant frequencies re-measured and correctedby hand. Mean values were calculated for thefemale and male speakers for each variety.One-Bark vowel circles were plotted for thefemale and male target vowels [iː, yː, ʉː, uː] ofeach variety on separate F1/F2 and F2/F3 plotsusing another Praat script.In order to test for statistically significantdifferences between the dialects a two-wayANOVA was carried out with the betweensubjectsfactors dialect (3) and gender (2), anda dependent variable formant (3).Finally, a comparison of the inventory oflong close vowels in the three varieties wasconducted using the Euclidean distance, whichwas calculated for the first three formants basedon values in Bark.ResultsFigure 2 plots the F1 and F2 values separatelyfor female and male speakers for each of thethree dialects. It can be seen that the distributionis roughly similar for both female and malespeakers in all varieties.There is a significant effect of dialect on F2for the vowel /iː/ (F(2, 10) = 8.317, p
<strong>Proceedings</strong>, FONETIK <strong>2009</strong>, Dept. of Linguistics, Stockholm UniversityFigure 2. F1/F2 plots of long close vowels for female and male speakers of Estonian Swedish, FinlandSwedish and Central Swedish.Figure 3. F2/F3 plots of long close vowels for female and male speakers of Estonian Swedish, FinlandSwedish and Central Swedish.57
<strong>Proceedings</strong>, FONETIK <strong>2009</strong>, Dept. of Linguistics, Stockholm UniversityFigure 4. The Euclidean distance for the first threeformants (in Bark) for female and male speakers.Figure 4 shows the Euclidean distance betweendialects of long close vowels for female andmale speakers. The black bars display the distancebetween ES and CS, grey bars betweenES and FS, and white bars between CS and FS.Except for /iː/ in female speakers, the longclose vowels of ES are closer to CS than to FS(a two-tailed t-test reveals a trend towards significance;t=-1.72, p=0.062).DiscussionOur results show that at least this variety of ES(Rickul) has only three distinct close vowels:/iː/, /yː/ and /uː/. There is an almost completeoverlap of the target vowels [yː] and [ʉː] in ES.The plotted F1/F2 vowel space of close ESvowels bears a striking resemblance to that ofEstonian which also distinguishes between thesame three close vowels (cf. Eek and Meister,1998).As pointed out above, earlier descriptions ofES refer to the varying quality of /yː/ in differentdialects (cf. E. Lagman 1979: 53). Auditoryanalysis of the vowel sound in the word nypreveals that the vowel is actually realised as adiphthong [iʉː] by all our ES speakers, but aswe only measured the quality of the second partof the diphthong (at only one point in thevowel), our measurements do not reflect diphthongisation.It is also possible that if a differenttest word had been chosen the quality of the/yː/ would have been different.Similarily, the present analysis does notcapture the diphthongisation that is common inCS long close vowels.As shown by earlier studies (e.g. Fant, et al.1969) the close front vowel space in CS iscrowded on the F1/F2 dimension, and there isno clear separation of /iː/ and /yː/. In our data,there also occurs an overlap of [iː] and [yː] with[ʉː] for female CS speakers. All three vowelsare, however, separated nicely by the F3 dimension.It is perhaps worth noting that the mean F2for /iː/ is somewhat lower for CS female speakersthan male speakers. This difference isprobably due to one of the female speakers whorealised her /iː/ as the so called Viby /iː/ whichis pronounced as [ɨː].Our results confirm that the FS /ʉː/ is aclose central vowel that is acoustically closer to[uː] than to [yː] (cf. Kuronen, 2000: 136), andsignificantly different from the realisations ofthe target vowel /ʉː/ in the other two varietiesunder question.The comparison of ES with CS and FS bymeans of the Euclidean distance allowed us toassess the proximity of ES vowels with theother two varieties. Interestingly, it seems thatthe results of the comparison point to less distancebetween ES and CS than between ES andFS. This is contrary to our initial hypothesisbased on E. Lagman’s (1979: 5) observationthat the main dialectal features of ES resemblemost FS. However, this does not necessarilymean that the language contact between CS andES must account for these similarities. Giventhat the ES vowels also resemble Estonianvowels a detailed acoustic comparison with Estonianvowels would yield a more coherent pictureon this issue.ConclusionsThis paper has studied the acoustic characteristicsof long close vowels in Estonian Swedish(ES) as compared to Finland Swedish (Borgå)and Central Swedish (Kårsta). The data for theanalysis was extracted from the elicited wordlist used for the SweDia 2000 database. Thesame materials were used for recording theRickul variety of ES.The analysis showed that the inventory oflong close vowels in ES includes three vowels.Comparison of the vowels in the three varietiesin terms of Euclidean distance revealed that thelong close vowels in ES are more similar tothose of CS than FS.58
<strong>Proceedings</strong>, FONETIK <strong>2009</strong>, Dept. of Linguistics, Stockholm UniversityMuch work remains to be done in order toreach a comprehensive phonetic analysis of ESvowels. More speakers need to be recordedfrom different varieties of ES to examine incloser detail the dialectal variation within ES.In the following work on ES vowels, we areplanning to carry out dynamic formant analysisin order to capture possible diphthongisation aswell as speaker variation.AcknowledgementsWe would like to thank Joost van de Weijer forhelp with statistical analysis, Gösta Bruce foradvice and discussing various aspects of Swedishvowels, and Francis Nolan for his commentson a draft of this paper. We are also verygrateful to our Estonian Swedish subjects whowillingly put up with our recording sessions.We owe a debt to Ingegerd Lindström and GöteBrunberg at Svenska Odlingens Vänner – theEstonian Swedes’ cultural organisation inStockholm – for hosting the Estonian Swedishrecording sessions. The work on this paper wassupported by the Estonian Science Foundationgrant no. 7904, and a scholarship from theRoyal Swedish Academy of Letters, Historyand Antiquities.ReferencesBleckert L. (1986) Ett komplement till den europeiskaspråkatlasen (ALE): Det estlandssvenskamaterialet till <strong>för</strong>sta volymserien(ALE I 1). Swedish Dialects and FolkTraditions 1985, Vol. 108. Uppsala: The Instituteof Dialect and Folklore Research.Bruce G., Elert C.-C., Engstrand O., and ErikssonA. (1999) Phonetics and phonology ofthe Swedish dialects – a project presentationand a database demonstrator. <strong>Proceedings</strong>of ICPhS 99 (San Francisco), 321–324.Danell G. (1905–34) Nuckömålet I–III. Stockholm.Eek A., Meister E. (1998) Quality of StandardEstonian vowels in stressed and unstressedsyllables of the feet in three distinctivequantity degrees. Linguistica Uralica 34, 3,226–233.Elert C.-C. (2000) Allmän och svensk fonetik.Stockholm: Norstedts.Engstrand O. (2004) <strong>Fonetik</strong>ens grunder. Lund:Studentlitteratur.Fant G., Henningson G., Stålhammar U. (1969)Formant Frequencies of Swedish Vowels.STL-QPSR 4, 26–31.Haugen E. (1976) The Scandinavian languages:an introduction to their history. London:Faber & Faber.Kuronen M. (2000) Vokaluttalets akustik isverigesvenska, finlandssvenska och finska.Studia Philologica Jyväskyläensia 49.Jyväskylä: University of Jyväskylä.Kuronen M. (2001) Acoustic character ofvowel pronunciation in Sweden-Swedishand Finland-Swedish. Working papers,Dept. of Linguistics, Lund University 49,94–97.Ladefoged P., Maddieson I. (1996) The Soundsof the World’s Languages. Oxford: Blackwell.Lagman E. (1979) En bok om Estlands svenskar.Estlandssvenskarnas språk<strong>för</strong>hållanden.3A. Stockholm: Kultur<strong>för</strong>eningenSvenska Odlingens Vänner.Lagman H. (1971) Svensk-estnisk språkkontakt.Studier över estniskans inflytande påde estlandssvenska dialekterna. Stockholm.Malmberg B. (1966) Nyare fonetiska rön ochandra uppsatser i allmän och svensk fonetik.Lund: Gleerups.Niemi S. (1981) Sverigesvenskan, finlandssvenskanoch finskan som kvalitetsochkvantitetsspråk. Akustiska iakttagelser.Folkmålsstudier 27, Meddelanden frånFöreningen <strong>för</strong> nordisk filologi. Åbo: ÅboAkademi, 61–72.Riad T. (1997) Svensk fonologikompendium.University of Stockholm.Tiberg N. (1962) Estlandssvenska språkdrag.Lund: Carl Bloms Boktryckeri A.-B.59
<strong>Proceedings</strong>, FONETIK <strong>2009</strong>, Dept. of Linguistics, Stockholm UniversityFenno-Swedish VOT: Influence from Finnish?Catherine Ringen 1 and Kari Suomi 21 Department of Linguistics, University of Iowa, Iowa City, Iowa, USA2 Phonetics, Faculty of Humanities, University of Oulu, Oulu, FinlandAbstractThis paper presents results of an investigationof VOT in the speech of twelve speakers ofFenno-Swedish. The data show that in utterance-initialposition, the two-way contrast isusually realised as a contrast between prevoicedand unaspirated stops. Medially andfinally, the contrast is that of a fully voiced stopand a voiceless unaspirated stop. However, alarge amount of variation was observed forsome speakers in the production of /b d g/, withmany tokens being completely voiceless andoverlapping phonetically with tokens of /p t k/.Such tokens, and the lack of aspiration in /p tk/, set Fenno-Swedish apart from the varietiesspoken in Sweden. In Finnish, /b d g/ are marginaland do not occur in many varieties, and/p t k/ are voiceless unaspirated. We suggestthat Fenno-Swedish VOT has been influencedby Finnish.MethodTwelve native speakers of Fenno-Swedish (6females, 6 males) were recorded in Turku, Finland.The ages of the male speakers varied between22 and 32 years, those of the femalespeakers between 24 years and 48 years.Fenno-Swedish was the first language and thelanguage of education of the subjects, as wellas of both of their parents. The speakers camefrom all three main areas in which Swedish isspoken in Finland: Uusimaa/Nyland (the southerncoast of Finland), Turunmaa / Åboland (thesouth-western coast) and Pohjanmaa / Österbotten(the western coast, Ostrobothnia). Thespeakers are all fluent in Finnish. There were68 target words containing one or more stops.A list was prepared in which the target wordsoccurred twice, with six filler words added tothe beginning of the list. The recordings tookplace in an anechoic chamber at the Centre forCognitive Neuroscience of Turku University.The words were presented to the subjects on acomputer screen. The subjects received eachnew word by clicking the mouse and were instructedto click only when they had finisheduttering a target word. The subjects were instructedto speak naturally, and their productionswere recorded directly to a hard disk (22.5kHz, 16 bit) using high quality equipment.Measurements were made using broad-bandspectrograms and oscillograms.ResultsThe full results, including the statistical tests,are reported in Ringen and Suomi (submitted).Here we concentrate on those aspects of the resultsthat suggest an influence on Fenno-Swedish from Finnish.The set /p t k/The stops /p t k/ were always voiceless unaspirated.For the utterance-initial /p t k/, themean VOTs were 20 ms, 24 ms and 41 ms, respectively.These means are considerably lessthan those reported by Helgason and Ringen(2008) (49 ms, 65 ms and 78 ms, respectively)for Central Standard Swedish (CS Swedish),for a set of target words that were identical tothose in our, with only a few exceptions. On theother hand, the mean VOTs of Finnish wordinitial/p/, /t/ and /k/ reported by Suomi (1980)were 9 ms, 11 ms and 20 ms, respectively (10male speakers). These means are smaller thanthose of our Fenno-Swedish speakers, but thedifference may be due to the fact that while theinitial stops in our study were utterance-initial,the Finnish target words were embedded in aconstant frame sentence. 1In medial intervocalic position, the mean ofVOT was 10 ms for /p/, 18 ms for /t/ and 25 msfor /k/. In Helgason and Ringen (2008), the correspondingmeans for CS Swedish were 14 ms,23 ms and 31 ms, and in Suomi (1980) 11 ms,16 ms and 25 ms for Finnish. The differencesare small, and there is the difference in the elicitationmethods, but it can nevertheless benoted that the Fenno-Swedish and Finnish figuresare very close to each other, and that theCS Swedish VOTs are at least numericallylonger than the Fenno-Swedish ones. At anyrate, these comparisons do not suggest thatFenno-Swedish and Finnish are different withrespect to the VOT of medial /p t k/. (OurFenno-Swedish speakers produced medialintervocalic /p t k/ in quantitatively two ways:60
<strong>Proceedings</strong>, FONETIK <strong>2009</strong>, Dept. of Linguistics, Stockholm Universityeither as short or long, e.g. baka was pronouncedas either [baaka] (eight speakers) or[baakka] (four speakers). However, this alternationhad no effect on VOT].) Word-final /ptk/were fully voiceless. To the ears of the secondauthor, the Fenno-Swedish /p t k/ sound verymuch like Finnish /p t k/.The set /b d g/In the realization of the utterance-initial /b d g/,there was much variation among the speakers.For eight of the twelve speakers, 95.2% of theutterance initial lenis tokens were prevoiced,whereas for the remaining four speakers, only70.6% of the tokens were prevoiced. Half of thespeakers in both subgroups were female andhalf were male. For the group of eight speakers,the mean VOT was -85 ms, and the proportionof tokens with non-negative VOT was 4.8%.The results for this group are similar to those ofHelgason and Ringen (2008) for CS Swedishwho observed the grand mean VOT of -88 msand report that, for all six speakers pooled, 93%of the initial /b d g/ had more than 10 ms prevoicing.For the CS Swedish speaker with theshortest mean prevoicing, 31 of her 38 initial /bd g/ tokens had more than 10 ms of prevoicing.For our group of eight Fenno-Swedish speakersand for all of the six CS Swedish speakers inHelgason and Ringen, then, extensive prevoicingwas the norm, with only occasional nonprevoicedrenditions.For the group of four Fenno-Swedishspeakers the mean VOT was only -40 ms, andthe proportion of tokens with non-negativeVOT was 29.4%. For an extreme speaker inthis respect, the mean VOT was -28 ms and38% of the /b d g/ tokens had non-negativeVOT. In fact, at least as far as VOT is concerned,many /b d g/ tokens overlapped phoneticallywith tokens of /p t k/. A linear discriminantanalysis was run on all initial stopsproduced by the group of eight speakers and onall initial stops produced by the group of fourspeakers to determine how well the analysiscan classify the stop tokens as instances of /p tk/ or /b d g/ on the basis of VOT. For the groupof eight speakers, 97.3% of the tokens werecorrectly classified: the formally /p t k/ stopswere all correctly classified as /p t k/, 4.8% ofthe formally /b d g/ stops were incorrectlyclassified as /p t k/. For the group of fourspeakers, 82.9% of the tokens were correctlyclassified: 1.0% of the formally /p t k/ stopswere incorrectly classified as /b d g/, and 29.4%of the formally /b d g/ stops were incorrectlyclassified as /p t k/. For these four speakers,then, /b d g/ often had positive VOT values inthe small positive lag region also frequently observedin /p t k/.Medial /b d g/ were extensively or fullyvoiced. In 9.4% of the tokens, the voiced proportionof the occlusion was less than 50%, in10.4% of the tokens the voiced proportion was50% or more but less than 75%, in 10.4% of thetokens the voiced proportion was 75% or morebut less than 100%, and in 70.0% of the tokensthe voiced proportion was 100%. Thus, whilethe medial /b d g/ were on the whole veryhomogeneous and mostly fully voiced, 3.6% ofthem were fully voiceless. These were nearlyall produced by three of the four speakers whoalso produced many utterance-initial /b d g/ tokenswith non-negative VOT values. The fullyvoiceless tokens were short and long /d/’s andshort /g/’s; there was no instance of voiceless/b/. A discriminant analysis was run on all medialstops, with closure duration, speaker sex,quantity, place of articulation, duration of voicingduring occlusion and positive VOT as theindependent variables. 96.4% of the tokenswere correctly classified (98.7% of /p t k/ and94.5% of /b d g/). The order of magnitude ofthe independent variables as separators of thetwo categories was duration of voicing duringocclusion > positive VOT > closure duration >place > quantity: sex had no separating power.Great variation was observed in both shortand long final /b d g/, and therefore the speakerswere divided into two subgroups both consistingof six speakers. This was still somewhatProcrustean, but less so than making no divisionwould have been. For group A the meanvoiced proportion of the occlusion was 89%(s.d. = 18%), for group B it was 54% (s.d. =31%). As the standard deviations suggest, therewas less inter-speaker and intra-speaker variationin the A group than in the B group.Among the group A speakers, mean voicedproportion of occlusion across the places of articulationranged from 73% to 98% in the short/b d g/ and from 63% to 99% in the long /b d g/,among the group B speakers the correspondingranges were 36% to 62% and 46% to 64%. Anextreme example of intra-speaker variation is amale speaker in group B for whom four of the24 final /b d g/ tokens were completely voicelessand nine were completely voiced. Discriminantanalyses were again run on all finalstops, separately for the two groups. For groupB, with voicing duration during the occlusion,61
<strong>Proceedings</strong>, FONETIK <strong>2009</strong>, Dept. of Linguistics, Stockholm Universityocclusion duration and quantity as independentvariables, 96.5% of the tokens were correctlyclassified (99.4% of /p t k/ and 93.1% of /b dg/). For group A, with the same independentvariables, all stops were correctly classified(100.0%). For both groups A and B, the orderof strength of the independent variables asseparators of the two categories was: voicingduration > closure duration > quantity.Phonological conclusionsFenno-Swedish contrasts voiced /b d g/ withvoiceless unaspirated /p t k/. On the basis of ouracoustic measurements and some knowledge ofhow these are related to glottal and supraglottalevents, we conclude that the contrast in Fenno-Swedish is one of [voice] vs no laryngeal specification.Note that our definition of voicedstops refers, concretely, to the presence of considerableprevoicing in utterance-initial stops,and to extensive voicing during the occlusion inother positions with, at most, a short positiveVOT after occlusion offset. What we refer to asvoiceless stops, in turn refers, again concretely,to short positive VOT in utterance-initial stops,to voiceless occlusion in medial stops and finalstops (allowing for a very short period of voicingat the beginning of the occlusion, if the precedingsegment is voiced), with at most a veryshort positive VOT.Suomi (1980: 165) concluded for the Finnishvoiceless unaspirated /p t k/ that their “degreeof voicing [is] completely determined bythe supraglottal constrictory articulation”.These stops have no glottal abduction or pharyngealexpansion gesture, a circumstance thatleads to voicelessness of the occlusion (p.155ff). Despite the different terminology, thisamounts to concluding that the Finnish /p t k/have no laryngeal specification. Thus in the twostudies, thirty years apart, essentially the sameconclusions were reached concerning Fenno-Swedish and the Finnish /p t k/.Stop clustersFour cluster types investigated: (1) /kt/, /pt/ (asin läkt, köpt), (2) /kd/, /pd/ (as in väckte, köptewhich, on a generative analysis, are derivedfrom vä/k+d/e and kö/p+d/e), (3) /gt/ (as invägt, byggt) and (4) /gd/ (as in vägde). Clusters(1) – (2) were always almost completely voiceless,and consequently there is no phonetic evidencethat the two types are distinct. The cluster/gd/ was usually nearly fully voicedthroughout. But in the realisation of the /gt/cluster there was again much variation amongthe speakers. The /t/ was always voiceless, butthe /g/ ranged from fully voiceless (in 43% ofthe tokens) to fully voiced (33%), and only thebeginning of /g/ was voiced in the remaining24% of the tokens. For two speakers all six tokensof /g/ were fully voiceless, for threespeakers four tokens were fully voiceless, andfor five speakers, on the other hand, four ormore tokens were fully voiced. As an exampleof intra-speaker variation, one speaker producedtwo fully voiced, two partially voicedand two fully voiceless /g/ tokens. On thewhole, the speakers used the whole continuum,but favoured the extreme ends: /g/ was usuallyeither fully voiced or fully voiceless, the intermediatedegrees of voicing were less common.This dominant bipartite distribution of tokensalong a phonetic continuum is very differentfrom the more or less Gaussian distribution oneusually finds in corresponding studies of a singlephonological category.Contact influence?Historically, Finnish lacks a laryngeal contrastin the stop system, the basic stops being /p t k/,which are voiceless unaspirated. In the past, allborrowed words were adapted to this pattern,e.g. parkki ‘bark’ (< Swedish bark), tilli ‘dill’(< Sw. dill), katu ‘street’ (< Sw. gata). StandardSpoken Finnish (SSF) also has a type of /d/which is usually fully voiced. However, this /d/is not a plosive proper, but something betweena plosive and a flap, and is called a semiplosiveby Suomi, Toivanen and Ylitalo (2008). Itsplace is apical alveolar, and the duration of itsocclusion is very short, about half of that of /t/,ceteris paribus (Lehtonen 1970: 71; Suomi1980: 103). During the occlusion, the locationof the apical contact with the alveoli alsomoves forward when the preceding vowel is afront vowel and the following vowel is a backvowel (Suomi 1998).What is now /d/ in the native vocabulary,was a few centuries ago /ð/ for all speakers.When Finnish was first written down, themostly Swedish-speaking clerks symbolised /ð/variably, e.g. with the grapheme sequence. When the texts were read aloud, againusually by educated people whose nativetongue was Swedish, was pronounced asit would be pronounced in Swedish. At thesame time, /ð/ was vanishing from the vernacular,and it was either replaced by other conso-62
<strong>Proceedings</strong>, FONETIK <strong>2009</strong>, Dept. of Linguistics, Stockholm Universitynants, or it simply disappeared. Today, /ð/ hasvanished and the former /ð/ is represented by anumber of other consonants or by completeloss, and /d/ does not occur. But /d/ does occurin modern SSF as a result of conscious normativeattempts to promote “good speaking”. Thesecond author, for example, did not have /d/ inhis speech in the early childhood but learnt it atschool. In fully native words, /d/ occurs onlyword medially, e.g. sydän ‘heart’; in recentloanwords it is also found word-initially, e.g.demokraatti, desimaali, devalvaatio, diktaattori.Under the influence of foreign languages,nowadays most notably from English, /b/ and/g/ are entering Standard Spoken Finnish asseparate phonemes in recent loanwords, e.g.baari, bakteeri, baletti, banaani; gaala, galleria,gamma, gaselli. But such words are notyet pronounced with [b] and [g] by all speakers,nor in all speaking situations. On the whole, itcan be concluded that /d/ and especially /b/ and/g/ must be infrequent utterance initially in Finnishdiscourse, especially in informal registers,and consequently prevoicing is seldom heard inFinnish. Instead, utterance-initial stops predominantlyhave short-lag VOT. Even wordmediallyvoiced stops, with the exception of thesemiplosive /d/, are rather infrequent, becausethey only occur in recent loanwords and not forall speakers and not in all registers. Wordfinally— and thus also utterance-finally —voiced plosives do not occur at all becauseloanwords with a voiced final stop in the lendinglanguage are borrowed with an epenthetic/i/ in Finnish, e.g. blogi (< Engl. blog).Our Fenno-Swedish speakers’ /p t k/ hadshort positive VOTs very similar to those observedfor Finnish, assuming that the differencesbetween our utterance-initial /p t k/ andthe word-initial Finnish /p t k/ reported inSuomi (1980) are due to the difference in positionin the utterance. In utterance-initial position,the Fenno-Swedish /p t k/ are unaspiratedwhile the CS Swedish /p t k/ are aspirated. Wesuggest that the Fenno-Swedish /p t k/ havebeen influenced by the corresponding Finnishstops. Reuter (1977: 27) states that “the [Fenno-Swedish] voiceless stops p, t and k are whollyor partially unaspirated […]. Despite this, theyshould preferably be pronounced with astronger explosion than in Finnish, so that oneclearly hears a difference between the voicelessstops and the voiced b, d and g” (translation byKS). As pointed out by Leinonen (2004b), animplication of this normative exhortation is thatspeakers of Fenno-Swedish often pronouncethe voiceless stops in the same way as dospeakers of Finnish. Leinonen’s own measurementssuggest that this is the case.Many of our Fenno-Swedish speakers exhibitedinstability in the degree of voicing in /bd g/. We suggest that this, too, is due to influencefrom Finnish.The Fenno-Swedish speakers’ medial shortand long /d/ had considerably shorter closuredurations than did their medial /b/ and /g/. Inword-final position, this was not the case. TheFinnish semiplosive /d/ occurs word-medially,as does geminate /dd/ in a few recent loanwords(e.g. addikti ‘an addict’). But the Finnishsemiplosive does not occur word-finally. Thus,both short and long Fenno-Swedish /d/ have arelatively short duration in medial position, exactlywhere Finnish /d/ and /dd/ occur, but donot exhibit this typologically rare feature in finalposition where Finnish could not exert aninfluence. With respect to voicing, the Fenno-Swedish short medial /d/ behaved very muchlike Finnish /d/. The mean voiced proportion ofthe occlusion was 90%, and in Suomi (1980:103), all tokens of the medial Finnish /d/ werefully voiced. According to Kuronen and Leinonen(2000), /d/ is dentialveolar in CS Swedish,but alveolar in Fenno-Swedish. Finnish /d/is clearly alveolar and apical (Suomi 1998).Kuronen & Leinonen have confirmed (p. c.)that they mean that Fenno-Swedish /d/ is moreexactly apico-alveolar.Against a wider perspective, the suggestionthat the Fenno-Swedish /p t k/ have been influencedby the corresponding Finnish stops is notimplausible. First, it should be impressionisticallyapparent to anyone familiar with bothFenno-Swedish and CS Swedish that, on thewhole, they sound different, segmentally andprosodically; for empirical support for such animpression, see Kuronen and Leinonen (2000;2008). Second, it should also be apparent toanyone familiar with both Finnish and Swedishthat CS Swedish sounds more different fromFinnish than does Fenno-Swedish; in fact, apartfrom the Fenno-Swedish segments not found inFinnish, Fenno-Swedish sounds very much likeFinnish. Third, Leinonen (2004a) argues convincinglythat CS Swedish has no influence onFenno-Swedish pronunciation today. Leinonencompared what are three sibilants in CS Swedishwith what are two sibilants and an affricatein Fenno-Swedish. He observed clear differencesamong the varieties in each of these consonants,and found little support for an influ-63
<strong>Proceedings</strong>, FONETIK <strong>2009</strong>, Dept. of Linguistics, Stockholm Universityence of the CS Swedish consonants on theseconsonants in Fenno-Swedish. Thus, to the extentthat Fenno-Swedish differs from CS Swedish(or, more generally, any varieties of Swedishspoken in Sweden), a very likely cause ofthe difference is influence from Finnish. In additionto the influence of the Finnish /p t k/ onthe Fenno-Swedish /p t k/, we suggest that anyvariation towards voiceless productions of /b dg/ is also due to Finnish influence.Our results for utterance-initial stops in alanguage in which /b d g/ stops are predominantlyprevoiced are not altogether unprecedented.They resemble the results of Caramazzaand Yeni-Komshian (1974) on CanadianFrench and those of van Alphen and Smits(2004) for Dutch. Caramazza and Yeni-Komshian observed substantial overlap betweenthe VOT distributions of /b d g/ and /p tk/: a large proportion (58%) of the /b d g/ tokenswere produced without prevoicing, while/p t k/ were all produced without aspiration.The authors argued that the Canadian FrenchVOT values are shifting as a result of the influenceof Canadian English. van Alphen andSmits observed that, overall, 25% of the Dutch/b d g/ were produced without prevoicing bytheir 10 speakers, and, as in the present study,there was variation among the speakers: five ofthe speakers prevoiced very consistently, withmore than 90% of their /b d g/ tokens beingprevoiced, while for the other five speakersthere was less prevoicing and considerable inter-speakervariation; one speaker producedonly 38% of /b d g/ with prevoicing. van Alphen& Smits’ list of target words containedwords with initial lenis stops before consonants,which ours did not. They found that theamount of prevoicing was lower when the stopswere followed by a consonant. If we comparethe results for the prevocalic lenis stops in thetwo studies, the results are almost identical(86% prevoicing for van Alphen & Smits, 87%for our speakers). The authors are puzzled bythe question: given the importance of prevoicingas the most reliable cue to the voicing distinctionin Dutch initial plosives, why dospeakers not produce prevoicing more reliably?As a possible explanation to this seeminglyparadoxical situation, van Alphen and Smitssuggest that Dutch is undergoing a soundchange that may be caused or strengthened bythe large influence from English through theeducational system and the media. It may be,however, that van Alphen and Smits’ speakershave also been in contact with speakers of dialectsof Dutch with no prevoicing (and aspiratedstops) or by contact with speakers of German.There is evidence that speakers are verysensitive to the VOTs they are exposed to.Nielsen (2006, 2007) has shown that speakersof American English produced significantlylonger VOTs in /p/ after they were asked toimitate speech with artificially lengthenedVOTs in /p/, and the increased aspiration wasgeneralised to new instances of /p/ (in newwords) and to the new segment /k/. There isalso evidence that native speakers of a languageshift VOTs in their native language as a resultof VOTs in the language spoken around them(Caramazza and Yeni-Komshian, 1974; vanAlphen and Smits, 2004). Sancier and Fowler(1997) show that the positive VOTs in thespeech of a native Brazilian Portuguese speakerwere longer after an extended stay in the UnitedStates and shorter again after an extended stayin Brazil. The authors conclude that the Englishlong-lag /p t k/ influenced the amount of positiveVOT in the speaker’s native BrazilianPortuguese.All of our Fenno-Swedish speakers, like themajority of Fenno-Swedish speakers, are fluentin Finnish (as was observed before and after therecordings). Fenno-Swedish is a minority languagein Finland, and hence for most speakersit is very difficult not to hear and speak Finnish.Consequently, most speakers of Fenno-Swedishare in contact, on a daily basis, with a languagein which there is no aspiration and in whichprevoicing is not often heard. On the basis ofinformation available to us on our speakers’place of birth, age and sex, it is not possible todetect any systematic pattern in the variation inthe degree of voicing in /b d g/ as a function ofthese variables.In brief, the situation in Fenno-Swedishmay be parallel, mutatis mutandis, to that observedin Canadian French and Dutch. Assumingthat prevoicing in Fenno-Swedish /b d g/has been more systematic in the past than it isamong our speakers (which can hardly be verifiedexperimentally), influence from Finnish isan explanation for the variability of prevoicingin Fenno-Swedish that cannot be ruled outeasily. Without such influence it is difficult tosee why speakers would choose to collapsephonemic categories in their native language. 2AcknowledgementsWe are grateful to Mikko Kuronen and Kari64
<strong>Proceedings</strong>, FONETIK <strong>2009</strong>, Dept. of Linguistics, Stockholm UniversityLeinonen for their very useful and informativecomments on earlier versions of this paper. Wealso want to thank Viveca Rabb and Urpo Nikannefor assistance in recruiting subjects,Maria Ek for help with many aspects of thisproject, to Teemu Laine, Riikka Ylitalo, and JuhaniJärvikivi for technical assistance, HeikkiHämäläinen for use of the lab, Pétur Helgasonfor valuable discussions and assistance withour word list and, finally, our subjects. The researchof C. Ringen was supported, in part, bya Global Scholar Award and a Stanley InternationalPrograms/Obermann Center ResearchFellowship (2007) from the University of Iowaand NSF. Grant BCS-0742338.Notes1. We use the broad notations /b d g/ and /p t k/to refer to the phonetically more voiced and tothe phonetically less voiced stops of a language,respectively, without committing ourselvesto any claims about cross-linguistic similarities.E.g., when we talk about /p t k/ inFenno-Swedish and about /p t k/ in English, wedo not claim that the consonants are alike inthe two languages. Similarly the notation /t/ asapplied to Finnish overlooks the fact that theFinnish stop is laminodentialveolar.2. The fact that there was phonetic overlappingbetween tokens of /b d g/ and /p t k/ with respectto parameters related to voicing does notexclude the possibility that the two sets werestill distinguished by some properties notmeasured in this study. Nevertheless, overlappingin parameters directly related to the laryngealcontrast is very likely to reduce the salienceof the phonetic difference between the twosets of stops.ReferencesCaramazza, A. and Yeni-Komshian. G. (1974)Voice onset time in two French dialects.Journal of Phonetics 2, 239-245.Helgason, P. and Ringen, C. (2008) Voicingand aspiration in Swedish stops. Journal ofPhonetics 36, 607-628.Kuronen, M. and Leinonen, K. (2000) Fonetiskaskillnader mellan finlandssvenska ochrikssvenska. Svenskans beskrivning 24.Linköping Electronic Conference <strong>Proceedings</strong>.URL:http://www.ep.liu.se/ecp/006/011/.Kuronen, M. and Leinonen, K. (2008) Prosodiskasärdrag i finlandssvenska. In NordmanM., Björklund S., Laurėn Ch,, Mård-Miettinen K. and Pilke N. (eds) Svenskansbeskrivning 29. Skrifter utgivna av Svensk-Österbottniska samfundet 70, 161-169.Vasa.Lehtonen, J. (1970) Aspects of Quantity inStandard Finnish. Studia Philologica JyväskyläensiaVI, Jyväskylä.Leinonen, K. (2004a) Finlandssvenskt sje-, tjeochs-ljud i kontrastiv belysning. JyväskyläStudies in Humanities 17, Jyväskylä University.Ph.D. Dissertation.Leinonen, K. (2004b) Om klusilerna i finlandssvenskan.In Melander, B., Melander Marttala,U., Nyström, C., Thelander M. andÖstman C. (eds) Svenskans beskrivning 26,179-188). Uppsala: Hallgren & Fallgren.Nielsen, K. (2006) Specificity and generalizabilityof spontaneous phonetic imitiation.In <strong>Proceedings</strong> of the ninth internationalconference on spoken language processing(Interspeech) (paper 1326), Pittsburgh,USA.Nielsen, K. (2007) Implicit phonetic imitationis constrained by phonemic contrast. InTrouvain, J. and Barry, W. (eds) <strong>Proceedings</strong>of the 16th International Congress ofPhonetic Sciences. Universität des Saarlandes,Saarbrücken, Germany, 1961–1964.Reuter, M. (1977) Finlandssvenskt uttal. In PettersonB. and Reuter M. (eds) Språkbrukoch språkvård, 19-45. Helsinki: Schildts.Ringen, C. and Suomi, K. (submitted) Voicingin Fenno-Swedish stops.Sancier, M. & Fowler, C. (1997) Gestural driftin a bilingual speaker of Brazilian Portugueseand English. Journal of Phonetics 25,421-436.Suomi, K. (1980) Voicing in English and Finnishstops. Publications of the Departmentof Finnish and General Linguistics of theUniversity of Turku 10. Ph.D. Dissertation.Suomi, K. (1998) Electropalatographic investigationsof three Finnish coronal consonants.Linguistica Uralica XXXIV, 252-257.Suomi, K., Toivanen J. and Ylitalo, R. (2008)Finnish sound structure. Studia HumanioraOuluensia 9. URL:http://herkules.oulu.fi/isbn9789514289842.van Alphen, A. and Smits, R. (2004) Acousticaland perceptual analysis of the voicing distinctionin Dutch initial plosives: The roleof prevoicing. Journal of Phonetics 32, 455-491.65
<strong>Proceedings</strong>, FONETIK <strong>2009</strong>, Dept. of Linguistics, Stockholm UniversityGrammaticalization of prosody in the brainMikael Roll and Merle HorneDepartment of Linguistics and Phonetics, Lund University, LundAbstractBased on the results from three Event-RelatedPotential (ERP) studies, we show how the degreeof grammaticalization of prosodic featuresinfluences their impact on syntactic and morphologicalprocessing. Thus, results indicatethat only lexicalized word accents influencemorphological processing. Furthermore, it isshown how an assumed semi-grammaticalizedleft-edge boundary tone activates main clausestructure without, however, inhibiting subordinateclause structure in the presence of competingsyntactic cues.IntroductionIn the rapid online processing of speech, prosodiccues can in many cases be decisive forthe syntactic interpretation of utterances. Accordingto constraint-based processing models,the brain activates different possible syntacticstructures in parallel, and relevant syntactic,semantic, and prosodic features work as constraintsthat increase or decrease the activationof particular structures (Gennari and Mac-Donald, 2008). How important a prosodic cueis for the activation of a particular syntacticstructure depends to a large extent on the frequencyof their co-occurrence. Another factorwe assume to play an important role is how‘grammaticalized’ the association is betweenthe prosodic feature and the syntactic structure,i.e. to what degree it has been incorporated intothe language norm.Sounds that arise as side effects of the articulatoryconstraints on speech production maygradually become part of the language norm(Ohala, 1993). In the same vein, speakers seemto universally exploit the tacit knowledge of thebiological conditions on speech production inorder to express different pragmatic meanings(Gussenhoven, 2002). For instance, due to conditionson the exhalation phase of the breathingprocess, the beginning of utterances is normallyassociated with more energy and higher fundamentalfrequency than the end. Mimicking thistendency, the ‘Production Code’ might showthe boundaries of utterances by associating thebeginning with high pitch and the end with lowpitch, although it might not be physically necessary.According to Gussenhoven, the ProductionCode has been grammaticalized in manylanguages in the use of a right edge H% toshow non-finality in an utterance, as well as aleft-edge %H, to indicate topic-refreshment.In the present study, we will first examinethe processing of a Swedish left-edge H tonethat would appear to be on its way to becomingincorporated into the grammar. The H will beshown to activate main clause structure in theonline processing of speech, but without inhibitingsubordinate clause structure when cooccurringwith the subordinating conjunctionatt ‘that’ and subordinate clause word order.The processing dissociation will be related tothe low impact the tone has on normativejudgments in competition with the conjunctionatt and subordinate clause word order constraints.This shows that the tone has a relativelylow degree of grammaticalization,probably related to the fact that it is confined tothe spoken modality, lacking any counterpart inwritten language (such as commas, which correlatewith right-edge boundaries). We will furtherillustrate the influence of lexicalized andnon-lexicalized tones associated with Swedishword accents on morphological processing.The effects of prosody on syntactic andmorphological processing were monitored onlinein three experiments using electroencephalography(EEG) and the Event-Related Potentials(ERP) method. EEG measures changes inthe electric potential at a number of electrodes(here 64) over the scalp. The potential changesare due to electrochemical processes involvedin the transmission of information between neurons.The ERP method time locks this brain activityto the presentation of stimuli, e.g. wordsor morphemes. In order to obtain regular patternscorresponding to the processing of specificstimuli rather than to random brain activity,ERPs from at least forty trials per conditionare averaged and statistically analyzed fortwenty or more participants. In the averagedERP-waveform, recurrent responses to stimuliin the form of positive (plotted downwards) ornegative potential peaks, referred to as ‘components’,emerge.In this contribution, we will review resultsrelated to the ‘P600’ component, a positive66
<strong>Proceedings</strong>, FONETIK <strong>2009</strong>, Dept. of Linguistics, Stockholm UniversityFigure 1. Waveform and F0 contour of an embedded main clause sentence with (H, solid line) or without(∅, dotted line) a left-edge boundary tone.peak around 600 ms following stimuli that triggerreprocessing due to garden path effects orsyntactic errors (Osterhout and Holcomb,1992). The P600 often gives rise to a longersustained positivity from around 500 to 1000ms or more.A semi-grammaticalized toneIn Central Swedish, a H tone is phoneticallyassociated with the last syllable of the first prosodicword of utterances (Horne, 1994; Horneet al., 2001). Roll (2006) found that the H appearsin embedded main clauses but not in subordinateclauses. It thus seems that this ‘leftedgeboundary tone’ functions as a signal that amain clause is about to begin.Swedish subordinate clauses are distinguishedfrom main clauses by their word order.Whereas main clauses have the word order S–V–SAdv (Subject–Verb–Sentence Adverb), asin Afghanerna intog inte Persien ‘(literally)The Afghans conquered not Persia’, where thesentence adverb inte ‘not’ follows the verb intog‘conquered’, in subordinate clauses, thesentence adverb instead precedes the verb (S–SAdv–V), as in …att afghanerna inte intogPersien ‘(lit.) …that the Afghans not conqueredPersia’. In spoken Swedish, main clauses withpostverbal sentence adverbs are often embeddedinstead of subordinate clauses in order toexpress embedded assertions, although manyspeakers consider it normatively unacceptable.For instance, the sentence Jag sa att [afghanernaintog inte Persien] ‘(lit.) I said that theAfghans conquered not Persia’ would be interpretedas an assertion that what is expressed bythe embedded main clause within brackets istrue.Roll et al. (<strong>2009</strong>a) took advantage of theword order difference between main and subordinateclauses in order to study the effects ofthe left-edge boundary tone on the processingof clause structure. Participants listened to sentencessimilar to the one in Figure 1, but withthe sentence adverb ju ‘of course’ instead ofinte ‘not’, and judged whether the word orderwas correct. The difference between the testconditions was the presence or absence of a Hleft-edge boundary tone in the first prosodicword of the embedded clause, as seen in the lastsyllable of the subject afghanerna ‘the Afghans’in Figure 1. Roll et al. hypothesized thata H left-edge boundary tone would increase theactivation of main clause structure, and thusmake the S–V–SAdv word order relativelymore expected than in the corresponding clausewithout a H associated with the first word.When there was no H tone in the embeddedclause, the sentence adverb yielded a biphasicpositivity in the ERPs, interpreted as a P345-P600 sequence (Figure 2). In easily resolvedgarden path sentences, the P600 has been regularlyobserved to be preceded by a positivepeak between 300 and 400 ms (P345). Thebiphasic sequence has been interpreted as thediscovery and reprocessing of unexpectedstructures that are relatively easy to reprocess(Friederici et al. 2001).67
<strong>Proceedings</strong>, FONETIK <strong>2009</strong>, Dept. of Linguistics, Stockholm UniversityFigure 2. ERPs at the sentence adverb ju ‘of course’in sentences with embedded main clauses of thetype Besökaren menar alltså att familjen kännerju… ‘(lit.) The visitor thinks thus that the familyfeels of course…’ In the absence of a precedingleft-edge boundary tone (∅, grey line), there wasincreased positivity at 300–400 (P345) and 600–800ms (P600).The effect found in Roll et al. (<strong>2009</strong>a) henceindicates that in the absence of a left-edgeboundary tone, a sentence adverb showingmain clause word order (S–V–SAdv) is syntacticallyrelatively unexpected, and thus triggersreprocessing of the syntactic structure. Theword order judgments confirmed the effect.Embedded main clauses associated with a leftedgeboundary tone were rated as acceptable in68% of the cases, whereas those lacking a tonewere accepted only 52 % of the time. Generallyspeaking, the acceptability rate was surprisinglyhigh, considering that embedded main clausesare limited mostly to spoken language and areconsidered inappropriate by many speakers.In other words, the tone was used in processingto activate main clause word order and,all other things being equal, it influenced thenormative judgment related to correct word order.However, if the tone were fully grammaticalizedas a main clause marker, it would beexpected not only to activate main clause structure,but also to inhibit subordinate clausestructure. That is to say, one would expect listenersto reanalyze a subordinate clause as anembedded main clause after hearing an initial Htone.In a subsequent study (Roll et al., <strong>2009</strong>b),the effects of the left-edge boundary tone weretested on both embedded main clauses and subordinateclauses. The embedded main clauseswere of the kind presented in Figure 1. Correspondingsentences with subordinate clauseswere recorded, e.g. Stofilerna anser alltså attafghanerna inte intog Persien… ‘(lit.) The oldfogies think thus that the Afghans not conqueredPersia…’ Conditions with embeddedmain clauses lacking left-edge boundary tonesand subordinate clauses with an initial H tonewere obtained by cross-splicing the conditionsin the occlusion phase of [t] in att ‘that’ andintog ‘conquered’ or inte ‘not.’For embedded main clauses, the ERPresultswere similar to those of Roll et al.(<strong>2009</strong>a), but the effect was even clearer: Arather strong P600 effect was found between400 and 700 ms following the onset of the sentenceadverb inte ‘not’ for embedded mainclauses lacking a left-edge boundary tone (Figure3).Figure 3. ERPs at the disambiguation point for theverb in–tog ‘conquered’ (embedded main clauses,EMC, solid lines) or the sentence adverb in–te ‘not’(subordinate clauses, SC, dotted line) in sentenceslike Stofilerna anser alltså att afghanerna in–tog/te… ‘(lit.) The old fogies thus think that the Afghanscon/no–quered/t…’ with (H, black line) orwithout (∅, grey line) a left-edge boundary tone.Embedded main clauses showed a P600 effect at400–700 ms following the sentence adverb, whichwas reduced in the presence of a left-edge tone.Thus, it was confirmed that the left-edgeboundary tone increases the activation of mainclause structure, and therefore reduces the syntacticprocessing load if a following sentenceadverb indicates main clause word order. Asmentioned above, however, if the tone werefully grammaticalized, the reverse effect wouldalso be expected for subordinate clauses: Aleft-edge boundary tone should inhibit the expectationof subordinate clause structure. However,the tone did not have any effect at all onthe processing of the sentence adverb insubordinate clauses. The left-edge boundarytone thus activates main clause structure, albeitwithout inhibiting subordinate clause structure.68
<strong>Proceedings</strong>, FONETIK <strong>2009</strong>, Dept. of Linguistics, Stockholm UniversityInterestingly, in this experiment, involvingboth main and subordinated embedded clauses,the presence of a left-edge boundary tone didnot influence acceptability judgments. Rather,the speakers made their grammaticality decisionsbased only on word order, where subordinateclause word order was accepted in 89%and embedded main clause word order inaround 40% of the cases. Hence, the left-edgeboundary tone would appear to be a less grammaticalizedmarker of clause type than wordorder is. In the next section, we will review theprocessing effects of a prosodic feature that is,in contrast to the initial H, strongly grammaticalized,namely Swedish word accent 2.A lexicalized toneIn Swedish, every word has a lexically specifiedword accent. Accent 2 words have a H*tone associated with the stressed syllable, distinguishingthem from Accent 1 words, inwhich a L* is instead associated with thestressed syllable (Figure 4). Accent 2 is historicallya lexicalization of the postlexical wordaccent assigned to bi-stressed words (Riad,1998). Following Rischel (1963), Riad (inpress) assumes that it is the suffixes that lexicallyspecify whether the stressed stem vowelshould be associated with Accent 2. In the absenceof an Accent 2-specification, Accent 1 isassigned postlexically by default. A stem suchas lek– ‘game’ is thus unspecified for word accent.If it is combined with the Accent 2-specified indefinite plural suffix –ar, thestressed stem syllable is associated with a H*,resulting in the Accent 2-word lekar ‘games’shown in Figure 4. If it is instead combinedwith the definite singular suffix –en, which isassumed to be unspecified for word accent, thestem is associated with a L* by a default postlexicalrule, producing the Accent 1 word leken‘the game’, with the intonation contour shownby the dotted line in Figure 4.Neurocognitively, a lexical specification forAccent 2 would imply a neural association betweenthe representations of the Accent 2 tone(H*) and the grammatical suffix. ERP-studieson morphology have shown that a lexical specificationthat is not satisfied by the combinationof a stem and an affix results in an ungrammaticalword that needs to be reprocessed beforeinterpreting in the syntactic context (Lücket al., 2006). Therefore, affixes with lexicalspecifications left unsatisfied give rise to P600effects.Figure 4. Waveform and F0-contour of a sentence containing the Accent 2 word lekar ‘games’ associatedwith a H* (solid line). The F0 contour for the Accent 1 word leken ‘the game’ is shown by the dotted line(L*).69
<strong>Proceedings</strong>, FONETIK <strong>2009</strong>, Dept. of Linguistics, Stockholm UniversityA H*-specified suffix such as –ar in lekar‘games’ would hence be expected to producean ungrammatical word if combined with astem associated with a clashing L*. The wordwould have to be reprocessed, which would bereflected in a P600 effect. No such effect wouldbe expected for suffixes that usually co-occurwith Accent 1, such as –en in leken ‘the game’,since they are assumed to be unspecified forword accent.Roll et al. (<strong>2009</strong>c) found the expected dissociationwhen they compared 160 sentencescontaining words with either the H*-specifiedsuffix –ar or the unspecified suffix –en, andstems phonetically associated with a H* or aL*, obtained by cross-splicing. The effectswere compared with another 160 sentencescontaining words involving declension errors,such as lekor or leket, which have 1 st and 5 thdeclension instead of 2 nd declension suffixes,and therefore yield a clash between the lexicalspecification of the suffix and the stem. Theresults were similar for declension mismatchingwords and words with a H*-specifying suffixinaccurately assigned an Accent 1 L* (Figure5). In both cases, the mismatching suffix gaverise to a P600 effect at 450 to 900 ms that wasstronger in the case of declension-mismatchingsuffixes. The combination of the lexically unspecifiedsingular suffix –en and a H* did notyield any P600 effect, since there was no specification-mismatch,although –en usually cooccurswith Accent 1.Figure 5. ERPs for the Accent 2-specifying pluralsuffix –ar (L*PL), the word accent-unspecifieddefinite singular suffix –en (L*SG), as well the inappropriatelydeclining –or (L*DECL) and –et(L*NEU), combined with a stem associated withAccent 1 L*. The clash of the H*-specification of –ar with the L* of the stem produced a P600 similarto that of the declension errors at 450–900 ms.The study showed that a lexicalized prosodicfeature has similar effects on morphologicalprocessing as other lexicalized morphologicalfeatures such as those related to declensionmarking.Summary and conclusionsIn the present contribution, two prosodic featureswith different degrees of grammaticalizationand their influence on language processinghave been discussed. It was suggested that aSwedish left-edge boundary tone has arisenfrom the grammaticalization of the physicalconditions on speech production represented byGussenhoven’s (2002) Production Code.Probably stemming from a rise naturally associatedwith the beginning of phrases, the tonehas become associated with the syntactic structurethat is most common in spoken languageand most expected at the beginning of an utterance,namely the main clause. The tone has alsobeen assigned a specific location, the last syllableof the first prosodic word. When hearingthe tone, speakers thus increase the activationof main clause structure.However, the tone does not seem to be fullygrammaticalized, i.e. it does not seem to beable to override syntactic cues to subordinationin situations where both main and subordinateembedded clauses occur. Even when hearingthe tone, speakers seem to be nevertheless biasedtowards subordinate clause structure afterhearing the subordinate conjunction att ‘that’and a sentence adverb in preverbal position inthe embedded clause. However, embeddedmain clauses are easier to process in the contextof a left-edge boundary tone. Thus we can assumethat the H tone activates main clausestructure. Further, the boundary tone influencedacceptability judgments, but only in the absenceof word order variation in the test sentences.The combination of syntactic cues suchas the conjunction att and subordinate word order(S–SAdv–V) thus appears to constitute decisivecues to clause structure and cancel outthe potential influence the initial H could havehad in reprocessing an embedded clause as amain clause.A fully grammaticalized prosodic featurewas also discussed, Swedish Accent 2, whoseassociation with the stem is accounted for by aH* lexically specified for certain suffixes, e.g.plural –ar (Riad, in press). When the H*-specification of the suffix clashed with a L*70
<strong>Proceedings</strong>, FONETIK <strong>2009</strong>, Dept. of Linguistics, Stockholm Universityinappropriately associated with the stem in thetest words, the words were reprocessed, as reflectedin a P600 effect in the ERPs. Significantlylower acceptability judgments confirmedthat the effect was due to the ungrammaticalform of these test words. Similar effects wereobtained for declension errors.The results reviewed in this paper indicatethat prosodic features with a low degree ofgrammaticalization can nevertheless influenceprocessing of speech by e.g. increasing the activationof a particular syntactic structure without,however, inhibiting the activation of parallelcompeting structures. The studies involvingthe semi-grammaticalized left-edge boundarytone show clearly how prosodic cues interactwith syntactic cues in the processing of differentkinds of clauses. In the processing of subordinateembedded clauses, syntactic cues wereseen to override and cancel out the potentialinfluence of the prosodic cue (H boundarytone). In embedded main clauses, however, theprosodic cue facilitated the processing of wordorder. In contrast to these results related to theleft-edge boundary tone, the findings from thestudy on word accent processing show how thiskind of prosodic parameter has a much differentstatus as regards its degree of grammaticalization.The Swedish word accent 2 was seen toaffect morphological processing in a way similarto other morphological features, such as declensionclass, and can therefore be regarded asfully lexicalized.AcknowledgementsThis work was supported by grant 421-2007-1759 from the Swedish Research Council.ReferencesGennari, M. and MacDonald, M. C. (2008)Semantic indeterminacy of object relativeclauses. Journal of Memory and Language58, 161–187.Gussenhoven, C. (2002) Intonation and interpretation:Phonetics and phonology. InSpeech Prosody 2002, 47–57.Horne, M. (1994) Generating prosodic structurefor synthesis of Swedish intonation. WorkingPapers (Dept. of Linguistics, LundUniversity) 43, 72–75.Horne, M., Hansson, P., Bruce, G. Frid, J.(2001) Accent patterning on domain-relatedinformation in Swedish travel dialogues. InternationalJournal of Speech Technology 4,93–102.Lück, M., Hahne, A., and Clahsen, H. (2006)Brain potentials to morphologically complexwords during listening. Brain Research1077(1), 144–152.Ohala, J. J. (1993) The phonetics of soundchange. In Jones C. (ed.) Historical linguistics:Problems and perspectives, 237–278.New York: Longman.Osterhout, L. and Holcomb, P. J. (1992) Eventrelatedbrain potentials elicited by syntacticanomaly. Journal of Memory and Language31, 785–806.Riad, T. (1998) The origin of Scandinaviantone accents. Diachronica 15(1), 63–98.Riad, T. (in press) The morphological status ofaccent 2 in North Germanic simplex forms.In <strong>Proceedings</strong> from Nordic Prosody X,Helsinki.Rischel, J. (1963) Morphemic tone and wordtone i Eastern Norwegian. Phonetica 10,154–164.Roll, M. (2006) Prosodic cues to the syntacticstructure of subordinate clauses in Swedish.In Bruce, G. and Horne, M. (eds.) Nordicprosody: <strong>Proceedings</strong> of the IXth conference,Lund 2004, 195–204. Frankfurt amMain: Peter Lang.Roll, M., Horne, M., and Lindgren, M. (<strong>2009</strong>a)Left-edge boundary tone and main clauseverb effects on embedded clauses—An ERPstudy. Journal of Neurolinguistics 22(1), 55-73.Roll, M., Horne, M., and Lindgren, M. (<strong>2009</strong>b)Activating without inhibiting: Effects of anon-grammaticalized prosodic feature onsyntactic processing. Submitted.Roll, M., Horne, M., and Lindgren, M. (<strong>2009</strong>c)Effects of prosody on morphological processing.Submitted.71
<strong>Proceedings</strong>, FONETIK <strong>2009</strong>, Dept. of Linguistics, Stockholm UniversityFocal lengthening in assertions and confirmationsGilbert AmbrazaitisLinguistics and Phonetics, Centre for Languages and Literature, Lund UniversityAbstractThis paper reports on duration measurements ina corpus of 270 utterances by 9 StandardSwedish speakers, where focus position is variedsystematically in two different speech acts: assertionsand confirmations. The goal is to provideinformation needed for the construction ofa perception experiment, which will test thehypothesis that Swedish has a paradigmaticcontrast between a rising and a falling utterance-levelaccent, which are both capable ofsignalling focus, the falling one being expectedin confirmations. The results of the present studyare in line with this hypothesis, since they showthat focal lengthening occurs in both assertionsand confirmations, even if the target word isproduced with a falling pattern.IntroductionThis paper is concerned with temporal aspects offocus signalling in different types of speech acts– assertions and confirmations – in StandardSwedish. According to Büring (2007), mostdefinitions of focus have been based on either oftwo ‘intuitions’: first, ‘new material is focussed,given material is not’, second, ‘the material inthe answer that corresponds to the wh-constituentin the (constituent) question is focussed’(henceforth, ‘Question-Answer’ definition). Inmany cases, first of all in studies treating focusin assertions, there is no contradiction betweenthe two definitions; examples for usages of focusthat are compatible with both definitions areBruce (1977), Heldner and Strangert (2001), orLadd (2008), where focus is defined, more orless explicitly, with reference to ‘new information’,while a question-answer paradigm is usedto elicit or diagnose focus. In this study, focus isbasically understood in the same sense as in, e.g.Ladd (2008). However, reference to the notionof ‘newness’ in defining focus is avoided, sinceit might seem inappropriate to speak of ‘newinformation’ in confirmations. Instead, the‘Question-Answer’ definition is adopted, however,in a generalised form not restricted towh-questions. Focus signalling or focussing isthen understood as a ‘highlighting’ of the constituentin focus. Focus can refer to constituentsof different size (e.g. individual words or entirephrases), and signalled by different, e.g. morphosyntactic,means, but only narrow focus (i.e.focus on individual words) as signalled byprosodic means is of interest for this paper.For Swedish, Bruce (1977) demonstratedthat focus is signalled by a focal accent – a tonalrise that follows the word accent gesture. In theLund model of Swedish intonation (e.g. Bruce etal., 2000) it is assumed that focal accent may bepresent or absent in a word, but there is noparadigmatic contrast of different focal accents.However, the Lund model is primarily based onthe investigation of a certain type of speech act,namely assertions (Bruce, 1977). This paper ispart of an attempt to systematically includefurther speech acts in the investigation ofSwedish intonation.In Ambrazaitis (2007), it was shown thatconfirmations may be produced without a risingfocal accent (H-). It was argued, however, thatthe fall found in confirmations not merely reflectsa ‘non-focal’ accent, but rather an utterance-levelprominence, which paradigmaticallycontrasts with a H-. Therefore, in Ambrazaitis(in press), it is explored if and how focus can besignalled prosodically in confirmations. To thisend, the test sentence “Wallander <strong>för</strong>länger tillnovember.” (‘Wallander is continuing untilNovember.’) was elicited both as an assertionand as a confirmation, with focus either on theinitial, medial, or final content word. An examplefor a context question eliciting final focus ina confirmation is ‘Until when is Wallandercontinuing, actually? Until November, right?’.As a major result, one strategy of signalling aconfirmation was by means of a lowered H- riseon the target word. However, another strategywas, like in Ambrazaitis (2007), to realise thetarget word with a lack of a H- rise, i.e. withfalling F0 pattern (cf. Figure 1, upper panel).The initial word was always produced with arise, irrespective of whether the initial worditself was in focus or not. Initial, pre-focal riseshave been widely observed in Swedish and receiveddifferent interpretations (e.g. Horne,1991; Myrberg, in press; Roll et al., <strong>2009</strong>). Forthe present paper, it is sufficient to note that aninitial rise is not necessarily associated withfocus.72
<strong>Proceedings</strong>, FONETIK <strong>2009</strong>, Dept. of Linguistics, Stockholm Universitystst1086420-2-41086420-2-4medial rise (n=20)normalised timenormalised timemedial fall (n=17)initial rise (n=38) medial fall (n=17) final fall (n=16)Figure 1. Mean F0 contours of the three contentwords in the test sentence “Wallander <strong>för</strong>länger tillnovember”; breaks in the curves symbolise wordboundaries; time is normalised (10 measurementsper word); semitones refer to an approximation ofindividual speakers’ base F0; adapted from Ambrazaitis(in press). Upper panel: two strategies offocus signalling on the medial word in a confirmation.Lower panel: Focus on the initial, medial, andfinal word in a confirmation; for medial and finalfocus, only the falling strategy is shown.That is, in confirmations with intended focus onthe medial or the final word, one strategy was toproduce a (non-focal) rise on the initial, and twofalling movements, one each on the medial andthe final word. As the lower panel in Figure 1shows, the mean curves of these two cases lookvery similar; moreover, they look similar to thepattern for initial focus, which was alwaysproduced with a rising focal accent. One possiblereason for this similarity could be that medialor final focus, in fact, were not marked at allin these confirmations, i.e. that the entire utterancewould be perceived as lacking any narrowfocus. Another possibility is that all patternsdisplayed in Figure 1 (lower panel) would beperceived with a focal accent on the initial word.Informal listening, however, indicates that inmany cases, an utterance-level prominence,indicating focus, can be perceived on the medialor the final word. Thus, future perception experimentsshould test whether focus can besignalled by the falling pattern found in confirmations,and furthermore, which acousticcorrelates of this fall serve as perceptual cues offocus in confirmations. Prior to that, the acousticcharacteristics of the falling pattern need to beestablished in more detail.It is known for a variety of languages thatprosodically focussed words in assertions arenot only marked tonally, i.e. by a pitch accent,but also temporally, i.e. by lengthening (e.g.Bruce, 1981, Heldner and Strangert, 2001, forSwedish; Cambier-Langeveld and Turk, 1999,for English and Dutch; Kügler, 2008, for German).Moreover, Bruce (1981) suggests thatincreased duration is not merely an adaptation tothe more complex tonal pattern, but rather afocus cue on its own, besides the tonal rise.The goal of this study is to examine the datafrom Ambrazaitis (in press) on focus realisationin assertions and confirmations in more detail asregards durational patterns. The results are expectedto provide information as to whetherduration should be considered as a possible cueto focus and to speech act in future perceptionexperiments. The hypothesis is that, if focus issignalled in confirmations, and if lengthening isa focus cue independent of the tonal pattern,then focal lengthening should be found, not onlyin assertions, but also in confirmations. Furthermore,it could still be the case that durationalpatterns differ in confirmations and assertions.MethodThe following two sections on the material andthe recording procedure are, slightly modified,reproduced from Ambrazaitis (in press).MaterialThe test sentence used in this study was “Wallander<strong>för</strong>länger till november” (‘Wallander iscontinuing until November’). In the case of aconfirmation, the test sentence was preceded by“ja” (‘yes’). Dialogue contexts were constructedin order to elicit the test sentence with focus onthe first, second, or third content word, in eachcase both as an assertion and as a confirmation.These dialogue contexts consisted of a situationalframe context, which was the same forall conditions (‘You are a police officer meetinga former colleague. You are talking about retirementand the possibility to continue working.’),plus six different context questions, one73
<strong>Proceedings</strong>, FONETIK <strong>2009</strong>, Dept. of Linguistics, Stockholm Universityfor each condition (cf. the example in the Introduction).While the frame context was presentedto the subjects exclusively in writtenform, the context question was only presentedauditively. For that, the context questions werepre-recorded by a 30-year-old male nativespeaker of Swedish.Recording procedure and subjectsThe data collection was performed using acomputer program, which both presented thecontexts and test sentences to the subjects andorganised the recording. First, for each trial,only the frame context was displayed on thescreen in written form. The subjects had to readthe context silently and to try to imagine thesituation described in the context. When ready,they clicked on a button to continue with thetrial. Then, the pre-recorded context questionwas played to them via headphones, and simultaneously,the test sentence appeared on thescreen. The subject’s task was to answer thequestion using the test sentence in a normalconversational style. The subjects were allowedto repeat each trial until they were satisfied.Besides the material for this study, the recordingsession included a number of further testcases not reported on in this paper. Five repetitionsof each condition were recorded, and thewhole list of items was randomised. One recordingsession took about 15 minutes perspeaker. Nine speakers of Standard Swedishwere recorded (5 female) in an experimentalstudio at the Humanities Laboratory at LundUniversity. Thus, a corpus of 270 utterancesrelevant to this study (6 conditions, 5 repetitionsper speaker, 9 speakers) was collected.Data analysisA first step in data analysis is reported in Ambrazaitis(in press). There, the goal was to providean overview of the most salient characteristicsof the F0 patterns produced in the differentconditions. To this end, F0 contours were timeand register normalised, and mean contourswere calculated in order to illustrate the generalcharacteristics of the dominant patterns found inthe different conditions (cf. examples in Figure1). The F0 patterns were classified according tothe F0 movement found in connection with thestressed syllable of the target word, as either‘falling’ or ‘rising’.In order to obtain duration measurements, inthe present study, the recorded utterances weresegmented into 10 quasi-syllables using spectrogramsand wave form diagrams. Theboundaries between the segments were set asillustrated by the following broad phonetictranscriptions: [ʋa], [ˈland], [əɹ], [fœ], [ˈlɛŋː], [əɹ],[tɪl], [nɔ], [ˈvɛmb], [əɹ]. In the case of [ˈland] and[ˈvɛmb], the final boundary was set at the time ofthe plosive burst, if present, or at the onset of thepost-stress vowel.It has been shown for Swedish that focallengthening in assertions is non-linear, in thatthe stressed syllable is lengthened more than theunstressed syllables (Heldner and Strangert,2001). Therefore, durational patterns were analysedon two levels, first, taking into accountentire word durations, second, concentrating onstressed syllables only. In both cases, theanalyses focussed on the three content wordsand hence disregarded the word “till”.For each word, two repeated-measuresANOVAs were calculated, one with word durationas the dependant variable, the other forstressed syllable duration. In each of the sixANOVAs, there were three factors: SPEECH ACT(with two levels: assertion, confirmation), FO-CUS (POSITION) (three levels: focus on initial,medial, final word), and finally REPETITION(five repetitions, i.e. five levels).All data were included in these sixANOVAs, irrespective of possible mispronunciations,or the intonation patterns produced (cf.the two strategies for confirmations, Figure 1),in order to obtain a general picture of the effectsof focus and speech act on duration. However,the major issue is whether focus in confirmationsmay be signalled by a falling F0 pattern.Therefore, in a second step, durational patternswere looked at with respect to the classificationof F0 patterns made in Ambrazaitis (in press).ResultsFigure 2 displays mean durations of the threetest words for the six conditions (three focuspositions in two speech acts). The figure onlyshows word durations, since, on an approximatedescriptive level, the tendencies for stressedsyllable durations are similar; the differencesbetween durational patterns based on entirewords and stressed syllables only will, however,be accounted for in the inferential statistics.The figure shows that the final word (“november”)is generally produced relatively longeven when unfocussed, i.e. longer than medialor initial unfocussed words, reflecting thewell-known phenomenon of final lengthening.Moreover, the medial word (“<strong>för</strong>länger”) is74
<strong>Proceedings</strong>, FONETIK <strong>2009</strong>, Dept. of Linguistics, Stockholm Universityms550500450400350300250Wallander <strong>för</strong>länger novemberass 1 ass 2 ass 3 con 1 con 2 con 3Figure 2. Mean durations of the three test words forthe six conditions (ass = assertion; con = confirmation;numbers 1, 2, 3 = initial, medial, final focus),pooled across 45 repetitions by 9 speakers.generally produced relatively short. However,influences of position or individual word characteristicsare not treated in this study. The figurealso shows that each word is producedlonger when it is in focus than when it ispre-focal or post-focal (i.e. when another wordis focussed). This focal lengthening effect can,moreover, be observed in both speech acts, althoughthe effect appears to be smaller in confirmationsthan in assertions. For unfocussedwords, there seem to be no duration differencesbetween the two speech acts.These observations are generally supportedby the inferential statistics (cf. Table 1), althoughmost clearly for the medial word: Asignificant effect was found for the factorsSPEECH ACT and FOCUS, as well as for the interactionof the two factors, both for word duration([fœˈlɛŋːəɹ]) and stressed syllable duration([lɛŋː]); no other significant effects were foundfor the medial word. According to post-hoccomparisons (with Bonferroni correction),[fœˈlɛŋːəɹ] and [lɛŋː] were realised with a longerduration in assertions than in confirmations(ppre-focal (p=.003); stressed syllable: focal >post-focal (p=.023); focal > pre-focal (p=.001)).The situation is similar for the final word, themajor difference in the test results being that theinteraction of FOCUS and REPETITION was significantfor word durations (cf. Table 1). Resolvingthis interaction shows that significantdifferences between repetitions only occur forfinal focus, and furthermore, that they seem tobe restricted to confirmations. A possible explanationis that the two different strategies offocussing the final word in confirmations (risevs. fall) are reflected in this interaction (cf.Figure 3 below). As in the case of the medialword, post-hoc comparisons reveal that both[nɔˈvɛmbəɹ] and [vɛmb] were realised with alonger duration in assertions than in confirmations(p
<strong>Proceedings</strong>, FONETIK <strong>2009</strong>, Dept. of Linguistics, Stockholm Universityfinal > initial (p initial(p=0.19)).Finally, for the initial word, the interactionof FOCUS and SPEECH ACT was not significantfor word duration (cf. Table 1). That is,[vaˈlandəɹ] was produced longer in assertionsthan in confirmations, both when in focus and inpre-focal position (cf. also Figure 2). Post-hoctests for FOCUS show that [vaˈlandəɹ] is realisedwith a longer duration when the word is in focusthan when focus is on the medial (p=.011) orfinal word (p=.003). However, when only thestressed syllable is taken into account, the interactionof SPEECH ACT and FOCUS is significant(cf. Table 1). As shown by post-hoc comparisons,the situation is, however, more complexthan for the interactions found for the otherwords: First, [land] is realised longer in assertionsthan in confirmations not only when theinitial word is in focus (p=.002), but also whenthe final word is in focus (p=.029). Second, inassertions, the duration of [land] differs in allthree focus conditions (initial focus > medialfocus (p=.015); initial > final (p=.036); final >medial (p=.039)), while in confirmations, [land]is significantly longer in focus than in the twopre-focal conditions only (initial > medial(p=.005); initial > final (p=.016)), i.e. no significantdifference is found between the twopre-focal conditions.In the analysis so far, all recordings havebeen included irrespective of the variation of F0patterns produced within an experimental condition.As mentioned in the Introduction, confirmationswere produced with either of twostrategies, as classified in Ambrazaitis (in press)as either ‘rising’ (presence of a (lowered) H-accent on the target word), or ‘falling’ (absenceof a H- accent on the target word), cf. Figure 1.This raises the question as to whether the focallengthening found in confirmations (cf. Figure2) is present in both the rising and the fallingvariants. Figure 3 displays the results for confirmationin a rearranged form, where the F0pattern is taken into account.For the medial word, Figure 3 indicates that,first, the word seems to be lengthened in focuseven when it is produced with a falling pattern(cf. “<strong>för</strong>länger” in conditions ‘medial fall’ vs.‘final fall’, ‘final rise’, and ‘initial rise’), andsecond, the focal lengthening effect still tends tobe stronger when the word is produced with arise (‘medial fall’ vs. ‘medial rise’). However,for the final word, focal lengthening seems to bepresent only when the word is produced with arise. Finally, the initial word seems to bems550500450400350300250initial rise(38)Wallander <strong>för</strong>länger novembermedial fall(17)medialrise (20)final fall(16)final rise(27)Figure 3. Mean durations of the three test words inconfirmations, divided into classes according to theintended focus position (initial, medial, final word)and F0 pattern produced on the target word (rise,fall); n in parentheses.lengthened not only when it is in focus itself, butalso when medial or final focus is produced witha fall, as compared to medial or final focusproduced with a rise.DiscussionThe goal of this study was to examine the durationalpatterns in a data corpus where focus waselicited in two different speech acts, assertionsand confirmations. It is unclear from the previousF0 analysis (cf. Figure 1 and Ambrazaitis, inpress) whether focus was successfully signalledin confirmations, when these were producedwithout a ‘rising focal accent’ (H-). The generalhypothesis to be tested in future perception experimentsis that focus in confirmations mayeven be signalled by a falling pattern, whichwould support the proposal by Ambrazaitis(2007) that there is a paradigmatic utterancelevelaccent contrast in Standard Swedish betweena rising (H-) and a falling accent.The present results are in line with this generalhypothesis, since they have shown that focallengthening can be found not only in assertions,but also in confirmations, although the degree offocal lengthening seems to be smaller in confirmationsthan in assertions. In fact, the speechact hardly affects the duration of unfocussedwords, meaning that speech act signalling interactswith focus signalling. Most importantly,the results also indicate that focal lengtheningmay even be found when the target word isproduced with a falling F0 pattern, although noinferential statistics have been reported for thiscase. In fact, in these cases, duration differencesseem to the more salient than F0 differences (cf.‘medial fall’ and ‘final fall’ in Figures 1 and 3).76
<strong>Proceedings</strong>, FONETIK <strong>2009</strong>, Dept. of Linguistics, Stockholm UniversityThis summary of the results, however, bestmatches the durational patterns found for themedial word. Heldner and Strangert (2001)conclude that the medial position is least affectedby factors other than the focal accentitself, e.g. final lengthening. Based on the presentresults, it seems obvious that even theduration of the initial word is influenced bymore factors than focus, since even if the initialword is pre-focal, its duration seems to varydepending on whether the medial or the finalword is focussed (when only stressed syllable ismeasured), or, in confirmations, whether medialor final focus is produced with a fall or a rise.More research is needed in order to reach abetter understanding of these patterns. In part,durational patterns of initial words could possiblybe related to the role the initial position playsin signalling phrase- or sentence prosody (Myrberg,in press; Roll et al., <strong>2009</strong>).Finally, for the final word, the evidence forfocal lengthening in confirmations is weaker, atendency opposite to the one found by Heldnerand Strangert (2001) for assertions, where finalwords in focus tended to be lengthened morethan words in other positions. In the presentstudy, no focal lengthening was found for thefinal word in confirmations when the word wasproduced with a falling pattern. However, therelative difference in duration between the finaland the medial word was still larger as comparedto the case of intended medial focus producedwith a fall (cf. the duration relations of ‘medialfall’ and ‘final fall’ in Figure 3).Some of the duration differences found inthis study are small and probably irrelevant froma perceptual point of view. However, the generaltendencies indicate that duration is a possiblecue to perceived focus position in confirmationsand thus should be taken into account in theplanned perception experiment.AcknowledgementsThanks to Gösta Bruce and Merle Horne fortheir valuable advice during the planning of thestudy and the preparation of the paper, to MikaelRoll for kindly recording the context questions,and, of course, to all my subjects!ReferencesAmbrazaitis G. (2007) Expressing ‘confirma-tion’ in Swedish: the interplay of word andutterance prosody. <strong>Proceedings</strong> of the 16 thICPhS (Saarbrücken, Germany), 1093–96.Ambrazaitis G. (in press) Swedish and Germanintonation in confirmations and assertions.<strong>Proceedings</strong> of Nordic Prosody X (Helsinki,Finland).Bruce G. (1977) Swedish word accents in sentenceperspective. Lund: Gleerup.Bruce G. (1981) Tonal and temporal interplay.In Fretheim T. (ed) Nordic Prosody II –Papers from a symposium, 63–74. Trondheim:Tapir.Bruce G., Filipsson M., Frid J., Granström B.,Gustafson K., Horne M., and House D.(2000) Modelling of Swedish text and discourseintonation in a speech synthesisframework. In Botinis A. (ed) Intonation.Analysis, modelling and technology,291–320. Dordrecht: Kluwer.Büring D. (2007) Intonation, semantics andinformation structure. In Ramchand G. andReiss C. (eds) The Oxford Handbook ofLinguistic Interfaces, 445–73. Oxford: OxfordUniversity Press.Cambier-Langeveld T. and Turk A.E. (1999) Across-linguistic study of accentual lengthening:Dutch vs. English. Journal of Phonetics27, 255–80.Heldner M. and Strangert E. (2001) Temporaleffects of focus in Swedish. Journal ofPhonetics 29, 329–361.Horne M. (1991) Why do speakers accent“given” information? <strong>Proceedings</strong> of Eurospeech91: 2nd European conference onspeech communication and technology(Genoa, Italy), 1279–82.Kügler F. (2008) The role of duration as aphonetic correlate of focus. <strong>Proceedings</strong> ofthe 4 th Conference on Speech Prosody(Campinas, Brazil), 591–94.Ladd D.R. (2008) Intonational phonology 2 nded. Cambridge: Cambridge University Press.Myrberg S. (in press) Initiality accents in CentralSwedish. <strong>Proceedings</strong> of Nordic ProsodyX (Helsinki, Finland).Roll M., Horne M., and Lindgren, M. (<strong>2009</strong>)Left-edge boundary tone and main clauseverb effects on syntactic processing in embeddedclauses – An ERP study. Journal ofNeurolinguistics 22, 55–73.77
<strong>Proceedings</strong>, FONETIK <strong>2009</strong>, Dept. of Linguistics, Stockholm UniversityOn utterance-final intonation in tonal and non-tonal dialectsof KammuDavid House 1 , Anastasia Karlsson 2 , Jan-Olof Svantesson 2 , Damrong Tayanin 21 Dept of Speech, Music and Hearing, CSC, KTH, Stockholm, Sweden2 Dept of Linguistics and Phonetics, Centre for Languages and Literature, Lund University, SwedenAbstractIn this study we investigate utterance-final intonationin two dialects of Kammu, one tonaland one non-tonal. While the general patternsof utterance-final intonation are similar betweenthe dialects, we do find clear evidencethat the lexical tones of the tonal dialect restrictthe pitch range and the realization of focus.Speaker engagement can have a strong effecton the utterance-final accent in both dialects.IntroductionKammu, a Mon-Khmer language spoken primarilyin northern Laos by approximately600,000 speakers, but also in Thailand, Vietnamand China, is a language that has developedlexical tones rather recently, from thepoint of view of language history. Tones arosein connection with loss of the contrast betweenvoiced and voiceless initial consonants in anumber of dialects (Svantesson and House,2006). One of the main dialects of this languageis a tone language with high or low toneon each syllable, while the other main dialectlacks lexical tones. The dialects differ onlymarginally in other respects. This makes thedifferent Kammu dialects well-suited for studyingthe influence of lexical tones on the intonationsystem.In previous work using material gatheredfrom spontaneous storytelling in Kammu, theutterance-final accent stands out as being especiallyrich in information showing two types offocal realizations depending on the expressiveload of the accent and the speaker’s own engagement(Karlsson et al., 2007). In anotherstudy of the non-tonal Kammu dialect, it wasgenerally found that in scripted speech, thehighest F0 values were located on the utterance-finalword (Karlsson et al., 2008). In thispaper, we examine the influence of tone, focusand to a certain extent speaker engagement onthe utterance-final accent by using the samescripted speech material recorded by speakersof a non-tonal dialect and by speakers of a tonaldialect of Kammu.78Data collection and methodRecordings of both scripted and spontaneousspeech spoken by tonal and non-tonal speakersof Kammu were carried out in November, 2007in northern Laos and in February, 2008 innorthern Thailand. 24 speakers were recordedranging in age from 14 to 72 years.The scripted speech material was comprisedof 47 read sentences. The sentences were composedin order to control for lexical tone, toelicit focus in different positions and to elicitphrasing and phrase boundaries. Kammuspeakers are bilingual with Lao or Thai beingtheir second language. Since Kammu lacks awritten script, informants were asked to translatethe material from Lao or Thai to Kammu.This resulted in some instances of slightly differentbut still compatible versions of the targetsentences. The resulting utterances werechecked and transcribed by one of the authors,Damrong Tayanin, who is a native speaker ofKammu. The speakers were requested to readeach target sentence three times.For the present investigation six of the 47read sentences were chosen for analysis. Thesentences are transcribed below using the transcriptionconvention for the tonal dialect.1) nàa wɛ̀ɛt hmràŋ(she bought a horse)2) nàa wɛ̀ɛt hmràŋ yɨ̀m(she bought a red horse)3) tɛ́ɛk pháan tráak(Tɛɛk killed a buffalo)4) tɛ́ɛk pháan tráak yíaŋ(Tɛɛk killed a black buffalo)5) Ò àh tráak, àh sɨáŋ, àh hyíar(I have a buffalo, a pig and a chicken)6) Ò àh hmràŋ, àh mɛ̀ɛw, àh prùul(I have a horse, a cat and a badger)
<strong>Proceedings</strong>, FONETIK <strong>2009</strong>, Dept. of Linguistics, Stockholm UniversitySentences 1 and 2 contain only words with a St = 12[ln(Hz/100)/ln2] (1)low lexical tone while sentences 3 and 4 containonly words with a high lexical tone. Sentences2 and 4 differ from 1 and 3 only in thatthey end with an additional color adjective followingwhich results in a reference value of St=0 semitonesat 100 Hz, St=12 at 200 Hz and St=-12 at50 Hz. Normalization is performed by subtract-the noun (red and black respectively).Sentences 2 and 4 were designed to elicit focalaccent on the final syllable. Sentences 5 and 6ing each subject’s average F0 in St (measuredacross the three utterances of each target sentence)from the individual St values.convey a listing of three nouns (animals). Theon thenouns all have high lexical tone in sentence 5 Resultsand low lexical tone in sentence 6.Of all the speakers recorded, one non-tonal Plots for sentences 1-4 showing the F0 measurementpoints in normalized semitones arespeaker and four tonal speakers were excludedfrom this study as they had problems reading presented in Figure 1 for the non-tonal dialectand translating from the Lao/Thai script. All and in Figure 2 for the tonal dialect. Alignmentthe other speakers were able to fluently translatethe Lao/Thai script into Kammu and were exhibit a pronounced rise-fall excursionis from the end of the sentences. Both dialectsincluded in the analysis. Thus there were 9 nontonalspeakers (2 women and 7 men) and 10 clear difference in F0 range between the twoutterance-final syllable. There is, however, atonal speakers (6 women and 4 men) included dialects. The non-tonal dialect exhibits a muchin this study. The speakers ranged in ages from wider range of the final excursion (6-7 St) than14 to 72.does the tonal dialect (3-4 St).The subjects were recorded with a portable If we are to find evidence of the influenceEdirol R-09 digital recorder and a lapel microphone.The utterances were digitized at 48 KHz differences between sentence pairs 1 and 2 onof focus on the F0 excursions, we would expectsampling rate and 16-bit amplitude resolution the one hand and 3 and 4 on the other handand stored in .wav file format. Most of the where the final words in 2 and 4 receive focalspeakers were recorded in quiet hotel rooms. accent. In the non-tonal dialect (Figure 1) weOne speaker was recorded in his home and one find clear evidence of this difference. In the tonaldialect there is some evidence of the effectin his native village.Using the WaveSurfer speech analysis program(Sjölander and Beskow, 2000) the waveblyreduced and not statistically significant (seeof focal accent but the difference is consideraform,spectrogram and fundamental frequency Table 1).contour of each utterance was displayed. Table 1. Normalized maximum F0 means for theMaximum and minimum F0 values were then sentence pairs. 1 st and 2 nd refers to the F0 max forst ndannotated manually for successive syllables for the 1 and 2 sentence in the pair. Diff is the differenceeach utterance. For sentences 1-4, there wasgenerally very little F0 movement in the syllablesof the normalized F0 values for the pair, andthe ANOVA column shows the results of a singleleading up to the penult (pre-final syllable).Therefore, measurements were restricted ance is shown in parenthesis.factor ANOVA. Measurement position in the utter-to maximum F0 values on the pre-penultimatesyllables, while both maximum and minimum Sentence pairvalues were measured on the penultimate and Non-tonal1 st 2 nd diff ANOVAultimate syllables. For sentences 5 and 6, the 1-2 (final) 1.73 3.13 -1.40 p
<strong>Proceedings</strong>, FONETIK <strong>2009</strong>, Dept. of Linguistics, Stockholm UniversityFigure 1: Normalized F0 measurement points forsentences 1-4 from nine speakers of the non-tonaldialect. Lexical tone in parenthesis refers to the to-nal dialect.Figure 3: Normalized F0 measurement points forsentences 5-6 from nine speakers of the non-tonaldialect. Lexical tone in parenthesis refers to the to-nal dialect.Figure 2: Normalized F0 measurement points forsentences 1-4 from ten speakers of the tonal dialect.Lexical tone is indicated in parenthesis.Plots for sentences 5 and 6 are presented inFigure 3 for the non-tonal dialect and in Figure4 for the tonal dialect. Alignment is from theend of the sentences. Both dialects show a similarintonation pattern exhibiting rise-fall excursionson each of the three nouns comprising thelisting of the three animals in each sentence. Asis the case for sentences 1-4, there is also here aclear difference in F0 range between the twodialects. The non-tonal dialect exhibits a muchwider overall range (6-9 St) than does the tonaldialect (3-4 St).The nouns in sentence 5 have high tone inthe tonal dialect, while those in sentence 6 haveFigure 4: Normalized F0 measurement points forsentences 5-6 from ten speakers of the tonal dialect.Lexical tone is indicated in parenthesis.low tone. A comparison of the F0 maximum ofthe nouns in the three positions for the nontonaldialect (Figure 3) shows that the noun inthe first and third position has a higher F0 insentence 6 than in sentence 5 but in the secondposition the noun has a higher F0 in sentence 5than in sentence 6. A comparison of the F0maximum of the nouns in the three positionsfor the tonal dialect (Figure 4) shows that theF0 maximum for the high tone (sentence 5) ishigher than the low tone (sentence 6) in the firstand second position but not in the third position.80
<strong>Proceedings</strong>, FONETIK <strong>2009</strong>, Dept. of Linguistics, Stockholm UniversityDiscussionIn general terms, the results presented hereshow considerable similarities in the basic intonationpatterns of the utterance-final accent inthe two dialects. There is a pronounced finalrise-fall excursion which marks the end of theutterance. The presence of lexical tone in thetonal dialect does, however, restrict the intonationin certain specific ways. The most apparentoverall difference is found in the restrictedrange of the tonal dialect. This is an interesting,but perhaps not such an unexpected difference.As the tonal differences have lexical meaningfor the speakers of the tonal dialect, it may beimportant for speakers to maintain control overthe absolute pitch of the syllable which can resultin the general reduction of pitch range.The lexical tones and the reduction of pitchrange seem to have implications for the realizationof focal accent. In the non-tonal dialect,the final color adjectives of sentences 2 and 4showed a much higher F0 maximum than didthe final nouns of sentences 1 and 3. Here thespeakers are free to use rather dramatic F0 excursionsto mark focus. The tonal speakers, onthe other hand, seem to be restricted from doingthis. It is only the final color adjective of sentence4 which is given a markedly higher F0maximum than the counterpart noun in sentence3. Since the adjective of sentence 4 hashigh lexical tone, this fact seems to allow thespeakers to additionally raise the maximum F0.As the adjective of sentence 2 has low lexicaltone, the speakers are not free to raise this F0maximum. Here we see evidence of interplaybetween lexical tone and intonation.In the listing of animals in sentences 5 and6, there is a large difference in the F0 maximumof the final word in the non-tonal dialect.The word “badger” in sentence 6 is spoken witha much higher F0 maximum than the word“chicken” in sentence 5. This can be explainedby the fact that the word “badger” is semanticallymarked compared to the other commonfarm animals in the list. It is quite natural inKammu farming culture to have a buffalo, apig, a chicken, a horse and a cat, but not abadger! Some of the speakers even asked toconfirm what the word was, and therefore it isnot surprising if the word often elicited additionalspeaker engagement. This extra engagementalso shows up in the tonal speakers’ versionsof “badger” raising the low lexical tone toa higher F0 maximum than the word “chicken”in sentence 5 which has high lexical tone. Here,speaker engagement is seen to override the to-81nal restriction, although the overall pitch rangeis still restricted compared to the non-tonal dia-betweenlect. Thus we see an interactionspeaker engagement, tone and intonation.ConclusionsIn this study we see that the general patterns ofintonation for these sentences are similar in thetwo dialects. However, there is clear evidenceof the lexical tones of the tonal dialect restrictingthe pitch range and the realization of focus,especially when the lexical tone is low. Speakerengagement can have a strong effect on the ut-accent, and can even neutralizeterance-finalpitch differences of high and low lexical tone incertain cases.AcknowledgementsThe work reported in this paper has been car-from tone” (SIFT), supported by theried out within the research project, “SeparatingintonationBank of Sweden Tercentenary Foundation withadditional funding from Crafoordska stiftelsen.ReferencesFant, G. and Kruckenberg, A. (2004) Analysisand synthesis of Swedish prosody with outlookson production and perception. In FantG., Fujisaki H., Cao J. and Xu Y (eds.)From traditional phonology to modernspeech processing, 73-95. Foreign LanguageTeaching and Research Press, Beijing.Karlsson A., House D., Svantesson J-O. andTayanin D. (2007) Prosodic phrasing in tonaland ton-tonal dialects of Kammu. <strong>Proceedings</strong>of the 16th International Congressof Phonetic Sciences, Saarbrücken, Germany,1309-1312.Karlsson A., House D. and Tayanin, D. (2008)Recognizing phrase and utterance as prosodicunits in non-tonal dialects of Kammu.In <strong>Proceedings</strong>, FONETIK 2008, 89-92,Department of Linguistics, University ofGothenburg.Sjölander K. and Beskow J. (2000) WaveSurfer- an open source speech tool. In <strong>Proceedings</strong>of ICSLP 2000, 6th Intl Conf on SpokenLanguage Processing, 464-467, Beijing.Svantesson J-O. and House D. (2006) Toneproduction, tone perception and Kammutonogenesis. Phonology 23, 309-333.
<strong>Proceedings</strong>, FONETIK <strong>2009</strong>, Dept. of Linguistics, Stockholm UniversityReduplication with fixed tone pattern in KammuJan-Olof Svantesson 1 , David House 2 , Anastasia Mukhanova Karlsson 1 and Damrong Tayanin 11 Department of Linguistics and Phonetics, Lund University2 Department of Speech, Music and Hearing, KTH, StockholmAbstractIn this paper we show that speakers of both tonaland non-tonal dialects of Kammu use afixed tone pattern high–low for intensifying reduplicationof adjectives, and also that speakersof the tonal dialect retain the lexical tones(high or low) while applying this fixed tone pattern.BackgroundKammu (also known as Khmu, Kmhmu’, etc.)is an Austroasiatic language spoken in thenorthern parts of Laos and in adjacent areas ofVietnam, China and Thailand. The number ofspeakers is at least 500,000. Some dialects ofthis language have a system of two lexicaltones (high and low), while other dialects havepreserved the original toneless state. The tonelessdialects have voicless and voiced syllableinitialstops and sonorants, which have mergedin the tonal dialects, so that the voiceless ~voiced contrast has been replaced with a high ~low tone contrast. For example, the minimalpair klaaŋ ‘eagle’ vs. glaaŋ ‘stone’ in non-tonaldialects corresponds to kláaŋ vs. klàaŋ with highand low tone, respectively, in tonal dialects.Other phonological differences between thedialects are marginal, and all dialects are mutuallycomprehensible. See Svantesson (1983) forgeneral information on the Kammu languageand Svantesson and House (2006) for Kammutonogenesis.This state with two dialects that more orless constitute a minimal pair for the distinctionbetween tonal and non-tonal languages makesKammu an ideal language for investigating theinfluence of lexical tone on different prosodicproperties of a language. In this paper we willdeal with intensifying full reduplication of adjectivesfrom this point of view.Intensifying or attenuating reduplication ofadjectives occurs in many languages in theSoutheast Asian area, including Standard Chinese,several Chinese dialects and Vietnamese.As is well known, Standard Chinese uses fullreduplication combined with the suffixes -r-deto form adjectives with an attenuated meaning(see e.g. Duanmu 2000: 228). The second copyof the adjective always has high tone (denoted¯), irrespective of the tone of the base:jiān ‘pointed’ > jiān-jiān-r-dehóng ‘red’ > hóng-hōng-r-dehǎo ‘good’ > hǎo-hāo-r-demàn ‘slow’ > màn-mān-r-deThus, the identity of the word, including thetone, is preserved in Standard Chinese reduplication,the tone being preserved in the firstcopy of it.In Kammu there is a similar reduplicationpattern, intensifying the adjective meaning. Forexample, blia ‘pretty’ (non-tonal dialect) is reduplicatedas blia-blia ‘very pretty’. This reduplicationhas a fixed tone pattern, the first copybeing higher than the second one (although, aswill be seen below, a few speakers apply anotherpattern).Material and methodWe investigate two questions:(1) Is the high–low pattern in intensifyingreduplication used by speakers of both tonaland non-tonal dialects?(2) For speakers of tonal dialects: is thelexical tone of the adjective preserved in thereduplicated form?For this purpose we used recordings of tonaland non-tonal dialect speakers that we made innorthern Laos in November 2007, and in northernThailand in February 2008. A total of 24speakers were recorded, their ages ranging between14 and 72 years. The recordings includedtwo sentences with reduplicated adjectives:naa blia-blianaa thaw-thaw‘she is very pretty’‘she is very old’This is the form in the non-tonal dialect; inthe tonal dialect, the reduplicated words areplìa-plìa with low lexical tone, and tháw-tháwwith high; the word nàa ‘she’ has low tone inthe tonal dialect. Each speaker was asked to recordthe sentences three times, but for some,only one or two recordings were obtained or82
<strong>Proceedings</strong>, FONETIK <strong>2009</strong>, Dept. of Linguistics, Stockholm Universitypossible to analyse (see table 1 for the numberof recordings for each speaker). Two of thespeakers (Sp2 and Sp4) were recorded twice.For four of the 24 speakers no useable recordingswere made. Of the remaining 20 speakers,8 speak the non-tonal dialect and 12 the tonaldialect.The maximal fundamental frequency wasmeasured in each copy of the reduplicatedwords using the Praat analysis program.Results and discussionThe results are shown in table 1.Concerning question (1) above, the resultsshow that most speakers follow the pattern thatthe first copy of the reduplicated adjective hashigher F0 than the second one. 14 of the 20speakers use this high–low pattern in all theirproductions. These are the 5 non-tonal speakersSp1, Sp3, Sp5, Sp6, Sp10 and the 9 tonalspeakers Sp2, Sp4, Sp13, Sp16, Sp20, Sp21,Sp22, Sp24, Sp25. Two speakers, Sp9 (nontonalmale) and Sp17 (tonal female) use a completelydifferent tone pattern, low–high. Theremaining speakers mix the patterns, Sp8 andSp18 use high–low for blia-blia but low–highfor thaw-thaw, and the two speakers Sp11 andSp23 seem to mix them more or less randomly.As seen in table 1, the difference in F0 betweenthe first and second copy is statistically significantin the majority of cases, especially forthose speakers who always follow the expectedhigh–low pattern. Some of the non-significantresults can probably be explained by the largevariation and the small number of measurementsfor each speakers.The second question is whether or not thetonal speakers retain the tone difference in thereduplicated form. In the last column in table 1,we show the difference between the mean F0values (on both copies) of the productions ofthaw-thaw/tháw-tháw and blia-blia/plìa-plìa. For11 of the 12 speakers of tonal dialects, F0 was,on the average, higher on tháw-tháw than onplìa-plìa, but only 2 of the 8 speakers of nontonaldialects had higher F0 on thaw-thaw thanon blia-blia. An exact binomial test shows thatthe F0 difference is significant (p = 0.0032) forthe tonal speakers but not for the non-tonalones (p = 0.144).One might ask why the majority of nontonalspeakers have higher F0 on blia-blia thanon thaw-thaw. One possible reason is that bliabliawas always recorded before thaw-thaw, andthis may have led to higher engagement whenblia-blia was recorded than when thaw-thaw wasrecorded just after that; see House et al.(forthc.) for the role of the speakers’ engagementfor Kammu intonation.ConclusionThe results show that the great majority of thespeakers we recorded used the expected fixedpattern, high–low, for intensifying reduplication,independent of their dialect type, tonal ornon-tonal. Furthermore, the speakers of tonaldialects retain the contrast between high andlow lexical tone when they apply this fixed tonepattern for adjective reduplication.AcknowledgementsThe work reported in this paper has been carriedout within the research project Separatingintonation from tone (SIFT), supported by thebank of Sweden Tercentenary Foundation (RJ),with additional funding from Crafoordskastiftelsen.ReferencesDuanmu, San (2000) The phonology of StandardChinese. Oxford: Oxford UniversityPress.House, David; Karlsson, Anastasia; Svantesson,Jan-Olof and Tayanin, Damrong(forthc.) The phrase-final accent in Kammu:effects of tone, focus and engagement. Papersubmitted to InterSpeech <strong>2009</strong>.Svantesson, Jan-Olof (1983) Kammu phonologyand morphology. Lund: GleerupSvantesson, Jan-Olof and House, David (2006)Tone production, tone perception andKammu tonogenesis. Phonology 23, 309–333.83
<strong>Proceedings</strong>, FONETIK <strong>2009</strong>, Dept. of Linguistics, Stockholm UniversityTable 1. F0 means for each reduplicated word and each speaker. The columns n1 and n2 show thenumber of repetitions of the reduplicated words, 1st and 2nd refers to the F0 means in the first and secondcopy of the reduplicated adjective, and diff is the difference between them. The test column showsthe results of t-tests for this difference (df = n1 + n2 – 2). The column difference shows the F0 differencebetween each speaker’s productions of thaw-thaw and blia-blia (means of first and second copy).blia/plìathaw/tháwn1 1st 2nd diff test n2 1st 2nd diff testdifferencenon-tonal maleSp1 3 178 120 58 p < 0.001 2 172 124 48 p < 0.05 –1Sp3 3 149 115 34 p < 0.001 3 147 109 38 p < 0.001 –4Sp5 3 216 151 65 p < 0.01 3 205 158 47 p < 0.01 –1Sp6 3 186 161 25 p < 0.01 3 181 142 39 p < 0.05 –9Sp8 3 176 146 30 n.s. 1 155 172 –17 — 2Sp9 3 126 147 –21 n.s 3 105 127 –22 p < 0.05 –20non-tonal femaleSp10 2 291 232 59 n.s 2 287 234 53 n.s. –2Sp11 3 235 224 11 n.s 3 232 234 –2 n.s. 3tonal maleSp13 2 173 140 33 n.s. 3 213 152 61 p < 0.05 25Sp20 4 119 106 13 n.s 3 136 119 17 n.s. 14Sp22 3 192 136 57 p < 0.05 3 206 134 72 n.s 6Sp23 2 190 192 –2 n.s. 2 207 210 –3 n.s. 17Sp24 3 159 132 27 p < 0.01 3 159 129 30 p < 0.01 –2tonal femaleSp2 6 442 246 196 p < 0.001 6 518 291 227 p < 0.001 61Sp4 5 253 202 51 n.s. 6 257 232 25 p < 0.05 17Sp16 3 326 211 115 p < 0.05 3 351 250 101 p < 0.05 31Sp17 3 236 246 –10 n.s. 3 251 269 –18 n.s. 19Sp18 3 249 208 41 p < 0.05 3 225 236 –11 n.s. 2Sp21 5 339 210 129 p < 0.001 6 316 245 71 p < 0.001 6Sp25 3 240 231 9 n.s. 3 269 263 6 p < 0.01 3184
<strong>Proceedings</strong>, FONETIK <strong>2009</strong>, Dept. of Linguistics, Stockholm University85
<strong>Proceedings</strong>, FONETIK <strong>2009</strong>, Dept. of Linguistics, Stockholm UniversityExploring data driven parametric synthesisRolf Carlson 1 , Kjell Gustafson 1,21KTH, CSC, Department of Speech, Music and Hearing, Stockholm, Sweden2Acapela Group Sweden AB, Solna, SwedenAbstractThis paper describes our work on building aformant synthesis system based on both rulegenerated and database driven methods. Threeparametric synthesis systems are discussed:our traditional rule based system, a speakeradapted system, and finally a gesture system.The gesture system is a further development ofthe adapted system in that it includes concatenatedformant gestures from a data-driven unitlibrary. The systems are evaluated technically,comparing the formant tracks with an analysedtest corpus. The gesture system results in a25% error reduction in the formant frequenciesdue to the inclusion of the stored gestures. Finally,a perceptual evaluation shows a clearadvantage in naturalness for the gesture systemcompared to both the traditional system and thespeaker adapted system.IntroductionCurrent speech synthesis efforts, both in researchand in applications, are dominated bymethods based on concatenation of spokenunits. Research on speech synthesis is to a largeextent focused on how to model efficient unitselection and unit concatenation and how optimaldatabases should be created. The traditionalresearch efforts on formant synthesis andarticulatory synthesis have been significantlyreduced to a very small discipline due to thesuccess of waveform based methods. Despitethe well motivated current research path resultingin high quality output, some efforts on parametricmodelling are carried out at our department.The main reasons are flexibility inspeech generation and a genuine interest in thespeech code. We try to combine corpus basedmethods with knowledge based models and toexplore the best features of each of the two approaches.This report describes our progress inthis synthesis work.Parametric synthesisUnderlying articulatory gestures are not easilytransformed to the acoustic domain describedby a formant model, since the articulatory constraintsare not directly included in a formantbasedmodel. Traditionally, parametric speechsynthesis has been based on very labour-intensiveoptimization work. The notion analysis bysynthesis has not been explored except by manualcomparisons between hand-tuned spectralslices and a reference spectrum. When increasingour ambitions to multi-lingual, multispeakerand multi-style synthesis, it is obviousthat we want to find at least semi-automaticmethods to collect the necessary information,using speech and language databases. The workby Holmes and Pearce (1990) is a good exampleof how to speed up this process. With thehelp of a synthesis model, the spectra are automaticallymatched against analysed speech.Automatic techniques such as this will probablyalso play an important role in makingspeaker-dependent adjustments. One advantagewith these methods is that the optimization isdone in the same framework as that to be usedin the production. The synthesizer constraintsare thus already imposed in the initial state.If we want to keep the flexibility of the formantmodel but reduce the need for detailedformant synthesis rules, we need to extract formantsynthesis parameters directly from a labelledcorpus. Already more than ten years agoat Interspeech in Australia, Mannell (1998) reporteda promising effort to create a diphonelibrary for formant synthesis. The procedureincluded a speaker-specific extraction of formantfrequencies from a labelled database. In asequence of papers from Utsunomiya University,Japan, automatic formant tracking hasbeen used to generate speech synthesis of highquality using formant synthesis and an elaboratevoice source (e.g. Mori et al., 2002). Hertz(2002) and Carlson and Granström (2005) reportrecent research efforts to combine datadrivenand rule-based methods. The approachestake advantage of the fact that a unit library canbetter model detailed gestures than the generalrules.In a few cases we have seen a commercialinterest in speech synthesis using the formantmodel. One motivation is the need to generate86
<strong>Proceedings</strong>, FONETIK <strong>2009</strong>, Dept. of Linguistics, Stockholm Universityspeech using a very small footprint. Perhaps theformant synthesis will again be an importantresearch subject because of its flexibility andalso because of how the formant synthesis approachcan be compressed into a limited applicationenvironment.A combined approach for acousticspeech synthesisThe efforts to combine data-driven and rulebasedmethods in the KTH text-to-speech systemhave been pursued in several projects. In astudy by Högberg (1997), formant parameterswere extracted from a database and structuredwith the help of classification and regressiontrees. The synthesis rules were adjusted accordingto predictions from the trees. In an evaluationexperiment the synthesis was tested andjudged to be more natural than the originalrule-based synthesis.Sjölander (2001) expanded the method intoreplacing complete formant trajectories withmanually extracted values, and also includedconsonants. According to a feasibility study,this synthesis was perceived as more naturalsounding than the rule-only synthesis (Carlsonet al., 2002). Sigvardson (2002) developed ageneric and complete system for unit selectionusing regression trees, and applied it to thedata-driven formant synthesis. In Öhlin & Carlson(2004) the rule system and the unit libraryare more clearly separated, compared to ourearlier attempts. However, by keeping the rulebasedmodel we also keep the flexibility tomake modifications and the possibility to includeboth linguistic and extra-linguisticknowledge sources.Figure 1 illustrates the approach in the KTHtext-to-speech system. A database is used tocreate a unit library and the library informationis mixed with the rule-driven parameters. Eachunit is described by a selection of extractedsynthesis parameters together with linguisticinformation about the unit’s original contextand linguistic features such as stress level. Theparameters can be extracted automaticallyand/or edited manually.In our traditional text-to-speech system thesynthesizer is controlled by rule-generated parametersfrom the text-to-parameter module(Carlson et al., 1982). The parameters are representedby time and values pairs including labelsand prosodic features such as duration andintonation. In the current approach some of therule-generated parameter values are replaced byvalues from the unit library. The process is controlledby the unit selection module that takesinto account not only parameter information butalso linguistic features supplied by the text-toparametermodule. The parameters are normalizedand concatenated before being sent to theGLOVE synthesizer (Carlson et al., 1991).Data-baseAnalysisExtractedparametersUnit libraryFeaturesUnit selectionConcatenationUnit-controlledparametersInput textText - to - parameterRule - gen era tedparameters+SynthesizerSpeech outputFigure 1. Rule-based synthesis system using a datadrivenunit library.Creation of a unit libraryIn the current experiments a male speaker recordeda set of 2055 diphones in a nonsenseword context. A unit library was then createdbased on these recordings.When creating a unit library of formant frequencies,automatic methods of formant extractionare of course preferred, due to the amountof data that has to be processed. However,available methods do not always perform adequately.With this in mind, an improved formantextraction algorithm, using segmentationinformation to lower the error rate, was developed(Öhlin & Carlson, 2004). It is akin to thealgorithms described in Lee et al. (1999),Talkin (1989) and Acero (1999).Segmentation and alignment of the waveformwere first performed automatically withnAlign (Sjölander, 2003). Manual correctionwas required, especially on vowel–vowel transitions.The waveform is divided into (overlapping)time frames of 10 ms. At each frame, anLPC model of order 30 is created; the poles arethen searched through with the Viterbi algorithmin order to find the path (i.e. the formanttrajectory) with the lowest cost. The cost is definedas the weighted sum of a number of partialcosts: the bandwidth cost, the frequencydeviation cost, and the frequency change cost.87
<strong>Proceedings</strong>, FONETIK <strong>2009</strong>, Dept. of Linguistics, Stockholm UniversityThe bandwidth cost is equal to the bandwidthin Hertz. The frequency deviation cost is definedas the square of the distance to a givenreference frequency, which is formant, speaker,and phoneme dependent. This requires the labellingof the input before the formant trackingis carried out. Finally, the frequency changecost penalizes rapid changes in formant frequenciesto make sure that the extracted trajectoriesare smooth.Although only the first four formants areused in the unit library, five formants are extracted.The fifth formant is then discarded. Thejustification for this is to ensure reasonable valuesfor the fourth formant. The algorithm alsointroduces eight times over-sampling beforeaveraging, giving a reduction of the variance ofthe estimated formant frequencies. After theextraction, the data is down-sampled to 100 Hz.Synthesis SystemsThree parametric synthesis systems were exploredin the experiments described below. Thefirst was our rule-based traditional system,which has been used for many years in ourgroup as a default parametric synthesis system.It includes rules for both prosodic and contextdependent segment realizations. Several methodsto create formant trajectories have been exploredduring the development of this system.Currently simple linear trajectories in a logarithmicdomain are used to describe the formants.Slopes and target positions are controlledby the transformation rules.The second rule system, the adapted system,was based on the traditional system andadapted to a reference speaker. This speakerwas also used to develop the data-driven unitlibrary. Default formant values for each vowelwere estimated based on the unit library, andthe default rules in the traditional system werechanged accordingly. It is important to emphasizethat it is the vowel space that was datadriven and adapted to the reference speaker andnot the rules for contextual variation.Finally, the third synthesis system, the gesturesystem, was based on the adapted system,but includes concatenated formant gesturesfrom the data-driven unit library. Thus, both theadapted system and the gesture system are datadrivensystems with varying degree of mix betweenrules and data. The next section will discussin more detail the concatenation processthat we employed in our experiments.100 %0 %x % x %phonemephonemeruleunitFigure 2. Mixing proportions between a unit and arule generated parameter track. X=100% equals thephoneme duration.Parameter concatenationThe concatenation process in the gesture systemis a simple linear interpolation between therule generated formant data and the possiblejoining units from the library. At the phonemeborder the data is taken directly from the unit.The impact of the unit data is gradually reducedinside the phoneme. At a position X the influenceof the unit has been reduced to zero (Figure2). The X value is calculated relative to thesegment duration and measured in % of thesegment duration. The parameters in the middleof a segment are thus dependent on both rulesand two units.Technical evaluationA test corpus of 313 utterances was selected tocompare predicted and estimated formant dataand analyse how the X position influences thedifference. The utterances were collected in theIST project SpeeCon (Großkopf et al., 2002)and the speaker was the same as the referencespeaker behind the unit library. As a result, theadapted system also has the same referencespeaker. In total 4853 phonemes (60743 10 msframes) including 1602 vowels (17508 frames)were used in the comparison.A number of versions of each utterancewere synthesized, using the traditional system,the adapted system and the unit system withvarying values of X percent. The label filesfrom the SpeeCon project were used to makethe duration of each segment equal to the recordings.An X value of zero in the unit systemwill have the same formant tracks as theadapted system. Figure 3 shows the results ofcalculating the city-block distance between thesynthesized and measured first three formantsin the vowel frames.88
<strong>Proceedings</strong>, FONETIK <strong>2009</strong>, Dept. of Linguistics, Stockholm UniversityFigure 4 presents a detailed analysis of the datafor the unit system with X=70%. The first formanthas an average distance of 68 Hz with astandard deviation of 43 Hz. Correspondingdata for F2 is (107 Hz, 81 Hz), F3 (111 Hz, 68Hz) and F4 (136 Hz, 67 Hz).Clearly the adapted speaker has a quite differentvowel space compared to the traditionalsystem. Figure 5 presents the distance calculatedon a phoneme by phoneme base. The correspondingstandard deviations are 66 HZ, 58Hz or 46 Hz for the three systems.As expected, the difference between the traditionalsystem and the adapted system is quitelarge. The gesture system results in about a25% error reduction in the formant frequenciesdue to the inclusion of the stored gestures.However, whether this reduction correspondsto a difference in perceived quality cannot bepredicted on the basis of these data. The differencebetween the adapted and the gesture systemis quite interesting and of the same magnitudeas the adaptation data. The results clearlyindicate how the gesture system is able tomimic the reference speaker in more detail thanthe rule-based system. The high standard deviationindicates that a more detailed analysisshould be performed to find the problematiccases. Since the test data as usual is hamperedby errors in the formant tracking procedures wewill inherently introduce an error in the comparison.In a few cases, despite our efforts, wehave a problem with pole and formant numberassignments.Perceptual evaluationA pilot test was carried out to evaluate the naturalnessin the three synthesis systems: traditional,adapted and gesture. 9 subjects workingin the department were asked to rank the threesystems according to perceived naturalness usinga graphic interface. The subjects have beenexposed to parametric speech synthesis before.Three versions of twelve utterances includingsingle words, numbers and sentences wereranked. The traditional rule-based prosodicmodel was used for all stimuli. In total324=3*12*9 judgements were collected. Theresult of the ranking is presented in Figure 6.Hz200150100500Traditional170Adapted12420%11510340%60%Gesture93 90 89 8770%80%Frame by frame city block distance (three formants mean)100%Figure 3. Comparison between synthesized andmeasured data (frame by frame).HZ250200150100500Traditional Adapted Gesture70%Phoneme by phonemeFigure 4. Comparisons between synthesized andmeasured data for each formant (phoneme byphoneme).Hz200150100500175131Traditional Adapted Gesture 70%95f1f2f3f4Phoneme by phoneme city block distance (three formants mean)Figure 5. Comparison between synthesized andmeasured data (phoneme by phoneme).89
<strong>Proceedings</strong>, FONETIK <strong>2009</strong>, Dept. of Linguistics, Stockholm UniversityResponses (%)1007550250Bottom Middle TopRankTraditional Adapted Gesture 70%Figure 6. Rank distributions for the traditional,adapted and gesture 70% systems.The outcome of the experiment should be consideredwith some caution due to the selectionof the subject group. However, the results indicatethat the gesture system has an advantageover the other two systems and that the adaptedsystem is ranked higher than the traditional system.The maximum rankings are 64%, 72% and71% for the traditional, adapted and gesturesystems, respectively. Our initial hypothesiswas that these systems would be ranked withthe traditional system at the bottom and thegesture system at the top. This is in fact true in58% of the cases with a standard deviation of21%. One subject contradicted this hypothesisin only one out off 12 cases while another subjectdid the same in as many as 9 cases. Thehypothesis was confirmed by all subjects forone utterance and by only one subject for anotherone.The adapted system is based on data fromthe diphone unit library and was created toform a homogeneous base for combining rulebasedand unit-based synthesis as smoothly aspossible. It is interesting that even these firststeps, creating the adapted system, are regardedto be an improvement. The diphone library hasnot yet been matched to the dialect of the referencespeaker, and a number of diphones aremissing.Final remarksThis paper describes our work on building formantsynthesis systems based on both rulegeneratedand database driven methods. Thetechnical and perceptual evaluations show thatthis approach is a very interesting path to explorefurther at least in a research environment.The perceptual results showed an advantage innaturalness for the gesture system which includesboth speaker adaptation and a diphonedatabase of formant gestures, compared to boththe traditional reference system and the speakeradapted system. However, it is also apparentfrom the synthesis quality that a lot of workstill needs to be put into the automatic buildingof a formant unit library.AcknowledgementsThe diphone database was recorded using theWaveSurfer software. David Öhlin contributedin building the diphone database. We thankJohn Lindberg and Roberto Bresin for makingthe evaluation software available for the perceptualranking. The SpeeCon database wasmade available by Kjell Elenius. We thank allsubjects for their participation in the perceptualevaluation.ReferencesAcero, A. (1999) “Formant analysis and synthesisusing hidden Markov models”, In:Proc. of Eurospeech'99, pp. 1047-1050.Carlson, R., and Granström, B. (2005) “Datadrivenmultimodal synthesis”, SpeechCommunication, Volume 47, Issues 1-2,September-October 2005, Pages 182-193.Carlson, R., Granström, B., and Karlsson, I.(1991) “Experiments with voice modellingin speech synthesis”, Speech Communication,10, 481-489.Carlson, R., Granström, B., Hunnicutt, S.(1982) “A multi-language text-to-speechmodule”, In: Proc. of the 7th InternationalConference on Acoustics, Speech, and SignalProcessing (ICASSP’82), Paris, France,vol. 3, pp. 1604-1607.Carlson, R., Sigvardson, T., Sjölander, A.(2002) “Data-driven formant synthesis”, In:Proc. of <strong>Fonetik</strong> 2002, Stockholm, Sweden,STL-QPSR 44, pp. 69-72Großkopf, B., Marasek, K., v. d. Heuvel, H.,Diehl, F., Kiessling, A. (2002) “SpeeCon -speech data for consumer devices: Databasespecification and validation”, Proc. LREC.Hertz, S. (2002) “Integration of Rule-BasedFormant Synthesis and Waveform Concatenation:A Hybrid Approach to Text-to-Speech Synthesis”, In: Proc. IEEE 2002Workshop on Speech Synthesis, 11-13, September2002 Santa Monica, USA.90
<strong>Proceedings</strong>, FONETIK <strong>2009</strong>, Dept. of Linguistics, Stockholm UniversityHögberg, J. (1997) “Data driven formant synthesis”,In: Proc. of Eurospeech 97.Holmes, W. J. and Pearce, D. J. B. (1990)“Automatic derivation of segment modelsfor synthesis-by-rule”, Proc ESCA Workshopon Speech Synthesis, Autrans, France.Lee, M., van Santen, J., Möbius, B., Olive, J.(1999) “Formant Tracking Using SegmentalPhonemic Information”, In: Proc.of Eurospeech‘99, Vol. 6, pp. 2789–2792.Mannell, R. H. (1998) “Formant diphone parameterextraction utilising a labeled singlespeaker database”, In: Proc. of ICSLP 98.Mori, H., Ohtsuka, T., Kasuya, H. (2002) “Adata-driven approach to source-formanttype text-to-speech system”, In ICSLP-2002, pp. 2365-2368.Öhlin, D. (2004) “Formant Extraction for DatadrivenFormant Synthesis”, (in Swedish).Master Thesis, TMH, KTH, Stockholm.Öhlin, D., Carlson, R. (2004) “Data-drivenformant synthesis”, In: Proc. <strong>Fonetik</strong> 2004pp. 160-163.Sigvardson, T. (2002) “Data-driven Methodsfor Paameter Synthesis – Description of aSystem and Experiments with CART-Analysis”, (in Swedish). Master Thesis,TMH, KTH, Stockholm, Sweden.Sjölander, A. (2001) “Data-driven FormantSynthesis” (in Swedish). Master Thesis,TMH, KTH, Stockholm.Sjölander, K. (2003) “An HMM-based Systemfor Automatic Segmentation and Alignmentof Speech”, In: Proc. of <strong>Fonetik</strong> 2003,Umeå Universitet, Umeå, Sweden, pp. 93–96.Talkin, D. (1989) “Looking at Speech”, In:Speech Technology, No 4, April/May 1989,pp. 74–77.91
<strong>Proceedings</strong>, FONETIK <strong>2009</strong>, Dept. of Linguistics, Stockholm UniversityUhm… What’s going on? An EEG study on perceptionof filled pauses in spontaneous Swedish speechSebastian Mårback 1 , Gustav Sjöberg 1 , Iris-Corinna Schwarz 1 and Robert Eklund 2, 31 Dept of Linguistics, Stockholm University, Stockholm, Sweden2 Dept of Clinical Neuroscience, Karolinska Institute/Stockholm Brain Institute, Stockholm, Sweden3 Voice Provider Sweden, Stockholm, SwedenAbstractFilled pauses have been shown to play asignificant role in comprehension and longtermstorage of speech. Behavioral andneurophysiological studies suggest that filledpauses can help mitigate semantic and/orsyntactic incongruity in spoken language. Thepurpose of the present study was to explorehow filled pauses affect the processing ofspontaneous speech in the listener. Brainactivation of eight subjects was measured byelectroencephalography (EEG), while theylistened to recordings of Wizard-of-Oz travelbooking dialogues.The results show a P300 component in thePrimary Motor Cortex, but not in the Broca orWernicke areas. A possible interpretation couldbe that the listener is preparing to engage inspeech. However, a larger sample is currentlybeing collected.IntroductionSpontaneous speech contains not only wordswith lexical meaning and/or grammaticalfunction but also a considerable number ofelements, commonly thought of as not part ofthe linguistic message. These elements includeso-called disfluencies, some of which are filledpauses, repairs, repetitions, prolongations,truncations and unfilled pauses (Eklund, 2004).The term ‘filled pause’ is used to describe nonwordslike “uh” and “uhm”, which are commonin spontaneous speech. In fact they make uparound 6% of words in spontaneous speech(Fox Tree, 1995; Eklund, 2004).Corley & Hartsuiker (2003) also showedthat filled pauses can increase listeners’attention and help them interpret the followingutterance segment. Subjects were asked to pressbuttons according to instructions read out tothem. When the name of the button waspreceded by a filled pause, their response timewas shorter than when it was not preceded by afilled pause.Corley, MacGregor & Donaldson (2007)showed that the presence of filled pauses inutterances correlated with memory andperception improvement. In an event-relatedpotential (ERP) study on memory, recordingsof utterances with filled pauses before targetwords were played back to the subjects.Recordings of utterances with silent pauseswere used as comparison. In a subsequentmemory test subjects had to report whethertarget words, presented to them one at a time,had occurred during the previous session or not.The subjects were more successful inrecognizing words preceded by filled pauses.EEG scans were performed starting at the onsetof the target words. A clearly discernable N400component was observed for semanticallyunpredictable words as opposed to predictableones. This effect was significantly reducedwhen the words were preceded by filled pauses.These results suggest that filled pauses canaffect how the listener processes spokenlanguage and have long-term consequences forthe representation of the message.Osterhout & Holcomb (1992) reported froman EEG experiment where subjects werepresented with written sentences containingeither transitive or intransitive verbs. In someof the sentences manipulation produced agarden path sentence which elicited a P600wave in the subjects, indicating that P600 isrelated to syntactic processing in the brain.Kutas & Hillyard (1980) presented subjectswith sentences manipulated according to degreeof semantic congruity. Congruent sentences inwhich the final word was contextuallypredictable elicited different ERPs thanincongruent sentences containing unpredictablefinal words. Sentences that were semanticallyincongruent elicited a clear N400 whereascongruent sentences did not.We predicted that filled pauses evoke eitheran N400 or a P600 potential as shown in thestudies above. This hypothesis has explanatoryvalue for the mechanisms of the previously92
<strong>Proceedings</strong>, FONETIK <strong>2009</strong>, Dept. of Linguistics, Stockholm Universitymentioned attention-enhancing function offilled pauses (Corley & Hartsuiker, 2003).Moreover, the present study is explorative innature in that it uses spontaneous speech, incontrast to most previous EEG studies ofspeech perception.Given the present knowledge of the effectof filled pauses on listeners’ processing ofsubsequent utterance segments, it is clear thatdirect study of the immediate neurologicalreactions to filled pauses proper is of interest.The aim of this study was to examinelisteners’ neural responses to filled pauses inSwedish speech. Cortical activity was recordedusing EEG while the subjects listened tospontaneous speech in travel booking dialogs.MethodSubjectsThe study involved eight subjects (six men andtwo women) with a mean age of 39 years andan age range of 21 to 73 years. All subjectswere native speakers of Swedish and reportedtypical hearing capacity. Six of the subjectswere right-handed, while two consideredthemselves to be left-handed. Subjects werepaid a small reward for their participation.ApparatusThe cortical activation of the subjects wasrecorded using instruments from ElectricalGeodesics Inc. (EGI), consisting of a HydrocelGSN Sensor Net with 128 electrodes. Thesehigh impedance net types permit EEGmeasurement without requiring gel applicationwhich permits fast and convenient testing. Theamplifier Net Amps 300 increased the signal ofthe high-impedance nets. To record and analyzethe EEG data the EGI software Net Station 4.2was used. The experiment was programmed inthe Psychology Software Tools’ software E-Prime 1.2.StimuliThe stimuli consisted of high-fidelity audiorecordings from arranged phone calls to a travelbooking service. The recordings were made in a“Wizard-of-Oz” setup using speakers (twomales/two females) who were asked to maketravel bookings according to instructions (seeEklund, 2004, section 3.4 for a detaileddescription of the data collection).The dialogs were edited so that only the partybooking the trip (customer/client) was heardand the responding party’s (agent) speech wasreplaced with silence. The exact times for atotal of 54 filled pauses of varying duration(200 to 1100 ms) were noted. Out of these, 37were utterance-initial and 17 were utterancemedial.The times were used to manuallyidentify corresponding sequences from theEEG scans which was necessary due to thenature of the stimuli. ERP data from a period of1000 ms starting at stimulus onset wereselected for analysis.ProcedureThe experiment was conducted in a soundattenuated, radio wave insulated and softly litroom with subjects seated in front of a monitorand a centrally positioned loud speaker.Subjects were asked to remain as still aspossible, to blink as little as possible, and tokeep their eyes fixed on the screen. Thesubjects were instructed to imagine that theywere taking part in the conversation − assumingthe role of the agent in the travel bookingsetting − but to remain silent. The total durationof the sound files was 11 min and 20 sec. Theexperimental session contained three shortbreaks, offering the subjects the opportunity tocorrect for any seating discomfort.Processing of dataIn order to analyze the EEG data for ERPs,several stages of data processing were required.A band pass filter was set to 0.3−30 Hz toremove body movement artefacts and eyeblinks. A period of 100 ms immediately prior tostimulus onset was used as baseline. The datasegments were then divided into three groups,each 1100 ms long, representing utteranceinitialfilled pauses, utterance-medial filledpauses and all filled pauses, respectively. Datawith artefacts caused by bad electrode channelsand muscle movements such as blinking wereremoved and omitted from analysis. Badchannels were then replaced with interpolatedvalues from other electrodes in their vicinity.The cortex areas of interest roughlycorresponded to Broca’s area (electrodes 28,34, 35, 36, 39, 40, 41, 42), Wernicke’s area(electrodes 52, 53, 54, 59, 60, 61, 66, 67), andPrimary Motor Cortex (electrodes 6, 7, 13, 29,30, 31, 37, 55, 80, 87, 105, 106, 111, 112).Theaverage voltage of each session was recordedand used as a subjective zero, as shown inFigure 1.93
<strong>Proceedings</strong>, FONETIK <strong>2009</strong>, Dept. of Linguistics, Stockholm UniversityPMCWFigure 1. Sensor net viewed from above (nose up).Groups of electrodes roughly corresponding toBroca area marked in black, Wernicke area inbright grey and Primary Motor Cortex in dark grey.Finally, nine average curves were calculated onthe basis of selected electrode groups. Thegroups were selected according to their scalplocalization and to visual data inspection.ResultsAfter visual inspection of the single electrodecurves, only curves generated by the initialfilled pauses (Figure 2) were selected forfurther analysis. No consistent pattern could bedetected in the other groups. In addition to theelectrode sites that can be expected to reflectlanguage-related brain activation in Broca’sand Wernicke’s areas, a group of electrodeslocated at and around Primary Motor Cortexwas also selected for analysis as a P300component was observed in that area. The P300peaked at 284 ms with 2.8 µV. The effectdiffered significantly (p
<strong>Proceedings</strong>, FONETIK <strong>2009</strong>, Dept. of Linguistics, Stockholm UniversityDiscussionContrary to our initial hypotheses, no palpableactivation was observed in either Broca orWernicke related areas.However, the observed − and somewhatunexpected − effect in Primary Motor Cortex isno less interesting. The presence of a P300component in or around the Primary MotorCortex could suggest that the listener ispreparing to engage in speech, and that filledpauses could act as a cue to the listener toinitiate speech.The fact that it can often be difficult todetermine where the boundary between medialfilled pauses and the rest of the utterance iscould provide an explanation as to why it isdifficult to discern distinct ERPs connected tomedial filled pauses.In contrast to the aforementioned study byCorley, MacGregor & Donaldson (2007) whichused the word following the filled pause asERP onset and examined whether the presenceof a filled pause helped the listener or not, thisstudy instead examined the immediateneurological response to the filled pause per se.Previous research material has mainlyconsisted of laboratory speech. However, it ispotentially problematic to use results from suchstudies to make far-reaching conclusions aboutprocessing of natural speech. In this respect thepresent study − using spontaneous speech −differs from past studies, although ecologicallyvalid speech material makes it harder to controlfor confounding effects.A larger participant number could result inmore consistent results and a stronger effect.Future studies could compare ERPsgenerated by utterance-initial filled pauses onthe one hand and initial function words and/orinitial content words on the other hand, assyntactically related function words andsemantically related content words have beenshown to generate different ERPs (Kutas &Hillyard, 1980; Luck, 2005; Osterhout &Holcomb, 1992). Results from such studiescould provide information about how the braindeals with filled pauses in terms of semanticsand syntax.AcknowledgementsThe data and basic experimental design used inthis paper were provided by Robert Eklund aspart of his post-doctoral fMRI project ofdisfluency perception at Karolinska Institute/Stockholm Brain Institute, Dept of ClinicalNeuroscience, MR-Center, with ProfessorMartin Ingvar as supervisor. This study wasfurther funded by the Swedish ResearchCouncil (VR 421-2007-6400) and the Knut andAlice Wallenberg Foundation (KAW2005.0115).ReferencesCorley, M. & Hartsuiker, R.J. (2003).Hesitation in speech can… um… help alistener understand. In <strong>Proceedings</strong> of the25th Meeting of the Cognitive ScienceSociety, 276−281.Corley, M., MacGregor, L.J., & Donaldson,D.I. (2007). It’s the way that you, er, say it:Hesitations in speech affect languagecomprehension. Cognition, 105, 658−668.Eklund, R. (2004). Disfluency in Swedishhuman-human and human-machine travelbooking dialogues. PhD thesis, LinköpingStudies in Science and Technology,Dissertation No. 882, Department ofComputer and Information Science,Linköping University, Sweden.Fox Tree, J.E. (1995). The effect of false startsand repetitions on the processing ofsubsequent words in spontaneous speech.Journal of Memory and Language, 34,709−738.Kutas, M. & Hillyard, S.A. (1980). Readingsenseless sentences: Brain potentials reflectsemantic incongruity. Science, 207, 203−205.Luck S.J. (2005). An introduction to the eventrelatedpotential technique. Cambridge,MA: MIT Press.Osterhout, L. & Holcomb, P.J. (1992). Eventrelatedpotentials elicited by syntacticanomaly. Journal of Memory andLanguage, 31, 785−806.95
<strong>Proceedings</strong>, FONETIK <strong>2009</strong>, Dept. of Linguistics, Stockholm UniversityHöraTal – a test and training program for children whohave difficulties in perceiving and producing speechAnne-Marie ÖsterSpeech, Music and Hearing, CSC, KTH, StockholmAbstractA computer-aided analytical speech perceptiontest and a helpful training program have beendeveloped. The test is analytical and seeks toevaluate the ability to perceive a range ofsound contrasts used in the Swedish language.The test is tailored for measurements with children,who have not yet learnt to read, by usingeasy speech stimuli, words selected on the basisof familiarity, and pictures that represent thetest items unambiguously. The test is intendedto be used with small children, from 4 years ofage, with difficulties to perceive and producespoken language.Especially prelingually hearing-impairedchildren show very different abilities to learnspoken language. The potential to develop intelligiblespeech is unrelated to their pure toneaudiograms. The development of this test is aneffort to find a screening tool that can predictthe ability to develop intelligible speech. Theinformation gained from this test will providesupplementary information about speech perceptionskills, auditory awareness, and the potentialfor intelligible speech and specify importantrecommendations for individualizedspeech-training programs.The intention is that this test should benormalized to various groups of children so theresult of one child could be compared to groupdata. Some preliminary results and referencedata from normal-hearing children, aged 4 to 7years, with normal speech development are reported.IntroductionThere exist several speech perception tests thatare used with prelingually and profoundly hearingimpaired children and children with specificlanguage impairment to assess theirspeech processing capabilities; the GASP test(Erber, 1982), the Merklein Test (Merklein,1981), Nelli (Holmberg and Sahlén, 2000) andthe Maltby Speech Perception Test (Maltby,2000). Results from these tests provide informationconcerning education and habilitationthat supplements the audiogram and the articulationindex, because it indicates a person’sability to perceive and to discriminate betweenspeech sounds. However, no computerized testshave so far been developed in Swedish for usewith young children who have difficulties inperceiving and producing spoken language.The development of the computer-aidedanalytical speech perception test, described inthis paper, is an effort to address the big needfor early diagnoses. It should supply informationabout speech perception skills and auditoryawareness.More important, a goal of this test is tomeasure the potential for children to produceintelligible speech given their difficulties toperceive and produce spoken language. Theexpectation is that the result of this test willgive important recommendations for individualtreatment with speech-training programs(Öster, 2006).Decisive factors for speech tests withsmall childrenThe aim of an analytical speech perception testis to investigate how sensitive a child is to thedifferences in speech patterns that are used todefine word meanings and sentence structures(Boothroyd, 1995). Consequently, it is importantto use stimuli that represent those speechfeatures that are phonologically important.Since the speech reception skills in profoundlyhearing-impaired children are quite limited, andsince small children in general have a restrictedvocabulary and reading proficiency, the selectionof the speech material was crucial. Thewords selected had to be familiar and meaningfulto the child, be represented in pictorial formand contain the phonological contrasts of interest.Thus, presenting sound contrasts as nonsensesyllables, so that the perception is not dependenton the child’s vocabulary, was not asolution. It has been shown that nonsense syllablestend to be difficult for children to respondto and that they often substitute the nearestword they know (Maltby, 2000). Other importantfactors to pay attention to were:96
<strong>Proceedings</strong>, FONETIK <strong>2009</strong>, Dept. of Linguistics, Stockholm University• what order of difficulty of stimulus presentationis appropriate• what are familiar words for children atdifferent ages and with different hearinglosses• what is the most unambiguous way toillustrate the chosen test wordsMoreover, the task had to be meaningful, naturaland well understood by the child; otherwisehe/she will not cooperate. Finally, the test mustrapidly give a reliable result, as small childrendo not have particularly good attention and motivation.The child answers by pointing with the mouseor with his/her finger to one of the boxes on thescreen. The results are presented in percent correctresponses on each subtest showing a profileof a child’s functional hearing, see figure 2(Öster, 2008)Table 1. The eighteen subtests included in the test.Description of HöraTal-TestIn the development of this analytical speechperception test the above mentioned factorswere taken into consideration (Öster et al,2002).The words contain important phonologicalSwedish contrasts and each contrast is tested inone of eighteen different subtests by 6 wordpairs presented twice. In Table 1 a summary ofthe test shows the phonological contrasts evaluatedin each subtest, an explanation of the discriminationtask and one example from eachsubtest. The words used were recorded by onefemale speaker. An illustrated word (the target)is presented to the child on a computer screentogether with the female voice reading theword. The task of the child is to discriminatebetween two following sounds without illustrationsand to decide which one is the same as thetarget word, see figure 1.Figure 1. An example of the presentation of teststimuli on the computer screen. In this case thephonological contrast of vowels differing at lowfrequencies tested through the words båt-bot[bo:tbu׃t] (boat-remedy).Figure 2. Example of a result profile for a child.Percent correct responses are shown for each subtest.97
<strong>Proceedings</strong>, FONETIK <strong>2009</strong>, Dept. of Linguistics, Stockholm UniversityConfusion matrixes are also available where allerrors are displayed. Such results are useful forthe speech therapist for screening purposes andgive good indications of the child’s difficultiesin perceiving and subsequently producing thesounds of the Swedish language.Description of HöraTal-TrainingA training program consisting of computerizedgame-like exercises has been developed. Twodifferent levels are available. A figure is guidedaround in a maze searching for fruit. Everytime the figure reaches a fruit two words areread by the female voice. The child should decidewhether the two words are the same or not.Correct answers are shown through the numbersof diamonds in the bottom of the screen.There is a time limit for the exercise andobstacles are placed in the figure’s way to jumpover. If the figure smashes an obstacle or if thetime runs out one of three “lives” will be lost. Ifthe child succeeds to collect enough points(diamonds) he/she is passed to the second andmore difficult level.and 7 years of age and twelve were between 9and 19 years of age. Nine children had a moderatehearing impairment and were between 4and 6 years old and fifteen children had a profoundhearing impairment and were between 6and 12 years of age. Four of these had a cochlearimplant and were between 6 and 12years of age. Table 2 shows a summary of thechildren who tried out some of the subtests.Table 2. Description of the children who participatedin the development of the test. Averageof pure-tone hearing threshold levels at500, 1000 and 2000 Hz), age and number ofchildren are shown.Normal-hearingchildren with specificlanguage impairmentHearing-impairedchildren< 60 dBHL > 60 dBHL4-7 yearsof age9-19 yearsof age4-6 years ofage6-12 yearsof ageNo. = 18 No. = 12 No. = 9 No. = 15Figure 4. shows profiles for all 24 hearingimpairedchildren on some subtests. Black barsshow mean results of the whole group andstriped bars show the profile of one child with60 dBHL pure tone average (500, 1000 and2000 Hz.)Number of syllablesGross discrimination of long vowelsVowels differing at low frequenciesVowels differing at high frequenciesVowel quantityDiscrimination of voiced consonantsFigure 3. An example of HöraTal-Training showingone of the mazes with obstacles and fruits to collect.Preliminary resultsStudies of children with special languageimpairment and prelinguallyhearing impaired childrenDuring the development of HöraTal-Test, 54children of different ages and with differenttypes of difficulty in understanding and producingspeech took part in the development andevaluation of the different versions (Öster et al.,1999). Eighteen normally hearing children withspecial language impairment were between 4Discrimination of voiceless consonantsManner of articulationPlace of articulationVoicingNasality0 20 40 60 80 100Figure 4. Results for the hearing-impaired children(N=24). Black bars show average results of thewhole group and striped bars show the result of onechild with 60 dBHL.The result indicates that the child has greaterdifficulties on the whole to perceive importantacoustical differences between speech soundsthan the mean result of the 24 children. Many98
<strong>Proceedings</strong>, FONETIK <strong>2009</strong>, Dept. of Linguistics, Stockholm Universityof his results of the subtests were on the levelof guessing (50%). The result might be a goodtype of screening for what the child needs totrain in the speech clinic.The results for the children with specificlanguage impairment showed very large differences.All children had difficulties with severalcontrasts. Especially consonantal features andduration seemed to be difficult for them to perceive.Studies of normal-hearing children withnormal speech developmentTwo studies have been done to receive referencedata for HöraTal-Test from children withnormal hearing and normal speech development.One study reported results from childrenaged between 4;0 and 5;11 years. (Gadeborg &Lundgren, 2008) and the other study (Möllerström& Åkerfeldt, 2008) tested children between6;0 and 7;11 years.In the first study (Gadeborg & Lundgren,2008) 16 four-year-old children and 19 fiveyear-oldchildren participated. One of the conclusionsof this study was that the four-year-oldchildren were not able to pass the test. Only 3of the four-year-old children manage to do thewhole test. The rest of the children didn’t wantto finish the test, were too unconcentrated ordidn’t understand the concept of same/different.13 of the five-year-old children did thewhole test, which are 16 subtests as the firsttwo subtests were used in this study to introducethe test to the children.10090807060504030201003 4 5 6 7 8 9 10 11 12 13 14 15 16 17 18Figure 5. Mean result on 16 subtests (the first twosubtests were used as introduction) for 13 normalhearingfive-year-old children with normal speechdevelopment.The children had high mean scores on the subtests(94,25 % correct answers) which indicatesthat a five-year-old child with normal hearingand normal speech development should receivehigh scores on HöraTal-Test.In the other study (Möllerström & Åkerfeldt,2008) 36 children aged between 6:0 and7:11 years were assessed with all subtests ofHöraTal-Test to provide normative data. Ingeneral, the participants obtained high scoreson all subtests. Seven-year-old participants performedbetter (98,89%) than six-year-olds onaverage (94,28%)100%95%90%85%80%75%70%65%60%55%50%1 2 3 4 5 6 7 8 9 10 11 12 13 14 15 16 17 18Figure 6. Mean result on all 18 subtests for 18 sixyear-oldnormal-hearing children with normalspeech development (grey bars) and 18 seven-yearoldnormal-hearing children with normal speechdevelopment (black bars).ConclusionsThe preliminary results reported here indicatethat this type of a computerized speech testgives valuable information about which speechsound contrasts a hearing or speech disordedchild has difficulties with. The child’s resultson the different subtests, consisting of bothacoustic and articulatory differences betweencontrasting sounds, form a useful basis as anindividual diagnosis of the child’s difficulties.This can be of great relevance for the work ofthe speech therapists.The intention is that this test should be normalizedto various groups of children so theresult of one child could be compared to groupdata. The test is useful supplementary informationto the pure tone audiogram. Hopefully itwill meet the long-felt need for such a test forearly diagnostic purposes in recommending anddesigning pedagogical habilitation programsfor small children with difficulties in perceivingand producing speech.99
<strong>Proceedings</strong>, FONETIK <strong>2009</strong>, Dept. of Linguistics, Stockholm UniversityReferencesBoothroyd A. (1995) Speech perception testsand hearing-impaired children, Profounddeafness and speech communication. G.Plant and K-E Spens. London, Whurr PublishersLtd, 345-371.Erber NP. (1982) Auditory training. AlexanderBell Association for the Deaf.Gadeborg J., Lundgren M. (2008) Hur barn iåldern 4;0-5;11 år presterar på taluppfattningstestetHöraTal. En analys av resultatenfrån en talperceptions och en talproduktionsuppgift,Uppsala universitet, Enheten<strong>för</strong> logopedi.Holmberg E., Sahlén B. (2000) Nya Nelli, PedagogiskDesign, Malmö.Maltby M (2000). A new speech perception testfor profoundly deaf children, Deafness &Education international, 2, 2. 86–101.Merklein RA. (1981). A short speech perceptiontest. The Volta Review, January 36-46.Möllerström, H. & Åkerfeldt, M. (2008) Höra-Tal-Test Hur presterar barn i åldrarna 6;0-7;11 år och korrelerar resultaten med fonemiskmedvetenhet. Uppsala universitet, Enheten<strong>för</strong> logopedi.Öster, A-M., Risberg, A. & Dahlquist, M.(1999). Diagnostiska metoder <strong>för</strong> tidig bedömning/behandlingav barns <strong>för</strong>måga attlära sig <strong>för</strong>stå tal och lära sig tala. SlutrapportDnr 279/99. KTH, <strong>Institutionen</strong> <strong>för</strong> tal,musik och hörsel.Öster, A-M., Dahlquist, M. & Risberg, A.(2002). Slut<strong>för</strong>andet av projektet ”Diagnostiskametoder <strong>för</strong> tidig bedömning/behandlingav barns <strong>för</strong>måga att lärasig <strong>för</strong>stå tal och lära sig tala”. SlutrapportDnr 2002/0324. KTH, <strong>Institutionen</strong> <strong>för</strong> tal,musik och hörsel.Öster A-M. (2006) Computer-based speechtherapy using visual feedback with focus onchildren with profound hearing impairments,Doctoral thesis in speech and musiccommunication, TMH, CSC, KTH.Öster, A-M. (2008) Manual till HöraTal Test1.1. Frölunda Data AB, Göteborg.100
<strong>Proceedings</strong>, FONETIK <strong>2009</strong>, Dept. of Linguistics, Stockholm University101
<strong>Proceedings</strong>, FONETIK <strong>2009</strong>, Dept. of Linguistics, Stockholm UniversityTransient visual feedback on pitch variation for Chinesespeakers of EnglishRebecca Hincks 1 and Jens Edlund 21 Unit for Language and Communication, KTH, Stockholm2 Centre for Speech Technology, KTH, StockholmAbstractThis paper reports on an experimental studycomparing two groups of seven Chinese studentsof English who practiced oral presentationswith computer feedback. Both groups imitatedteacher models and could listen to recordingsof their own production. The testgroup was also shown flashing lights that respondedto the standard deviation of the fundamentalfrequency over the previous two seconds.The speech of the test group increasedsignificantly more in pitch variation than thecontrol group. These positive results suggestthat this novel type of feedback could be used intraining systems for speakers who have a tendencyto speak in a monotone when makingoral presentations.IntroductionFirst-language speech that is directed to a largeaudience is normally characterized by morepitch variation than conversational speech(Johns-Lewis, 1986). In studies of English andSwedish, high levels of variation correlate withperceptions of speaker liveliness (Hincks,2005; Traunmüller & Eriksson, 1995) and charisma(Rosenberg & Hirschberg, 2005;Strangert & Gustafson, 2008).Speech that is delivered without pitch variationaffects a listener’s ability to recall information,and is not favored by listeners. This wasestablished by Hahn (2004) who studied listenerresponse to three versions of the sameshort lecture: delivered with correct placementof primary stress or focus, with incorrect or unnaturalfocus, and with no focus at all (monotone).She demonstrated that monotonous delivery,as well as delivery with misplaced focus,significantly reduced a listener’s ability torecall the content of instructional speech, ascompared to speech delivered with natural focusplacement. Furthermore, listeners preferredincorrect or unnatural focus to speech with nofocus at all.A number of researchers have pointed to thetendency for Asian L1 individuals to speak in amonotone in English. Speakers of tone languageshave particular difficulties using pitchto structure discourse in English. Because intonal languages pitch functions to distinguishlexical rather than discourse meaning, they tendto strip pitch movement for discourse purposesfrom their production of English. Penningtonand Ellis (2000) tested how speakers of Cantonesewere able to remember English sentencesbased on prosodic information, andfound that even though the subjects were competentin English, the prosodic patterns thatdisambiguate sentences such as Is HE drivingthe bus? from Is he DRIVing the bus? were noteasily stored in the subjects’ memories. Theirconclusion was that speakers of tone languagessimply do not make use of prosodic informationin English, possibly because for them pitchpatterns are something that must be learned arbitrarilyas part of a word’s lexical representation.Many non-native speakers have difficultyusing intonation to signal meaning and structurein their discourse. Wennerstrom (1994)studied how non-native speakers used pitch andintensity contrastively to show relationships indiscourse. She found that “neither in … oralreadingor in … free-speech tasks did the L2groups approach the degree of pitch increase onnew or contrastive information produced bynative speakers.” (p. 416). This more monotonespeech was particularly pronounced for thesubjects whose native language was Thai, likeChinese a tone language. Chinese-native teachingassistants use significantly fewer risingtones than native speakers in their instructionaldiscourse (Pickering, 2001) and thereby missopportunities to ensure mutual understandingand establish common ground with their students.In a specific study of Chinese speakersof English, Wennerstrom (1998) found a significantrelationship between the speakers’ abilityto use intonation to distinguish rhetoricalunits in oral presentations and their scores on atest of English proficiency. Pickering (2004)applied Brazil’s (1986) model of intonationalparagraphing to the instructional speech of Chi-102
<strong>Proceedings</strong>, FONETIK <strong>2009</strong>, Dept. of Linguistics, Stockholm Universitynese-native teaching assistants at an Americanuniversity. By comparing intonational patternsin lab instructions given by native and nonnativeTAs, she showed that the non-nativeslacked the ability to create intonational paragraphsand thereby to facilitate the students’understanding of the instructions. The analysisof intonationnal units in Pickering’s work was“hampered at the outset by a compression ofoverall pitch range in the [international teachingassistant] teaching presentations as comparedto the pitch ranges found in the [nativespeaker teaching assistant] data set” (2004,).The Chinese natives were speaking more monotonouslythan their native-speaking colleagues.One pedagogic solution to the tendency forChinese native speakers of English to speakmonotonously as they hold oral presentationswould be simply to give them feedback whenthey have used significant pitch movement inany direction. The feedback would be divorcedfrom any connection to the semantic content ofthe utterance, and would basically be a measureof how non-monotonously they are speaking.While a system of this nature would not be ableto tell a learner whether he or she has madepitch movement that is specifically appropriateor native-like, it should stimulate the use ofmore pitch variation in speakers who underusethe potential of their voices to create focus andcontrast in their instructional discourse. It couldbe seen as a first step toward more native-likeintonation, and furthermore to becoming a betterpublic speaker. In analogy with other learningactivities, we could say that such a systemaims to teach students to swing the club withoutnecessarily hitting the golf ball perfectly thefirst time. Because the system would give feedbackon the production of free speech, it wouldstimulate and provide an environment for theautonomous practice of authentic communicationsuch as the oral presentation.Our study was inspired by three points concludedfrom previous research:1. Public speakers need to use varied pitchmovement to structure discourse and engagewith their listeners.2. Second language speakers, especiallythose of tone languages, are particularly challengedwhen it comes to the dynamics of Englishpitch.3. Learning activities are ideally based onthe student’s own language, generated with anauthentic communicative intent.These findings generated the following primaryresearch question: Will on-line visualfeedback on the presence and quantity of pitchvariation in learner-generated utterances stimulatethe development of a speaking style thatincorporates greater pitch variation?Following previous research on technologyin pronunciation training, comparisons weremade between a test group that received visualfeedback and a control group that was able toaccess auditory feedback only. Two hypotheseswere tested:1. Visual feedback will stimulate a greaterincrease in pitch variation in training utterancesas compared to auditory-only feedback.2. Participants with visual feedback willbe able to generalize what they have learnedabout pitch movement and variation to the productionof a new oral presentation.MethodThe system we used consists of a base systemallowing students to listen to teacher recordings(targets), read transcripts of these recordings,and make their own recordings of their attemptsto mimic the targets. Students may also makerecordings of free readings. The interface keepstrack of the students’ actions, and some of thisinformation, such as the number of times a studenthas attempted a target, is continuously presentedto the student.The pitch meter is fed data from an onlineanalysis of the recorded speech signal. Theanalysis used in these experiments is based onthe /nailon/ online prosodic analysis software(Edlund & Heldner, 2006) and the Snack soundtoolkit. As the student speaks, a fundamentalfrequency estimation is continuously extractedusing an incremental version of getF0/RAPT(Talkin, 1995). The estimation frequency istransformed from Hz to logarithmic semitones.This gives us a kind of perceptual speaker normalization,which affords us easy comparisonbetween pitch variation in different speakers.After the semitone transformation, the nextstep is a continuous and incremental calculationof the standard deviation of the student’s pitchover the last 10 seconds. The result is a measureof the student’s recent pitch variation.For the test students, the base system wasextended with a component providing online,instantaneous and transient feedback visualizingthe degree of pitch variation the student iscurrently producing. The feedback is presentedin a meter that is reminiscent of the amplitude103
<strong>Proceedings</strong>, FONETIK <strong>2009</strong>, Dept. of Linguistics, Stockholm Universitybars used in the equalizers of sound systems:the current amount of variation is indicated bythe number of bars that are lit up in a stack ofbars, and the highest variation over the past twoseconds is indicated by a lingering top bar. Themeter has a short, constant latency of 100ms.The test group and the control group eachconsisted of 7 students of engineering, 4women and 3 men each. The participants wererecruited from English classes at KTH, andwere exchange students from China, in Swedenfor stays of six months to two years. Participants’proficiency in English was judged bymeans of an internal placement test to be at theupper intermediate to advanced level. The participantsspoke a variety of dialects of Chinesebut used Mandarin with each other and for theirstudies in China. They did not speak Swedishand were using English with their teachers andclassmates.Each participant began the study by givingan oral presentation of about five minutes inlength, either for their English classes or for asmaller group of students. Audio recordingswere made of the presentations using a smallclip-on microphone that recorded directly into acomputer. The presentations were also videorecorded,and participants watched the presentationstogether with one of the researchers,who commented on presentation content, deliveryand language. The individualized trainingmaterial for each subject was prepared from theaudio recordings. A set of 10 utterances, eachof about 5-10 seconds in length, was extractedfrom the participants’ speech. The utteranceswere mostly non-consecutive and were chosenon the basis of their potential to provide examplesof contrastive pitch movement within theindividual utterance. The researcher recordedher own (native-American speaking) versionsof them, making an effort to use her voice asexpressively as possible and making more pitchcontrasts than in the original student version.For example, a modeled version of a student’sflat utterance could be represented as: “AndTHIRDly, it will take us a lot of TIME and EFfortto READ each piece of news.”The participants were assigned to the controlor test groups following the preparation oftheir individualized training material. Participantswere ranked in terms of the global pitchvariation in their first presentation, as follows:they were first split into two lists according togender, and each list was ordered according toinitial global pitch variation. Participants wererandomly assigned pair-wise from the list to thecontrol or test group, ensuring gender balanceas well as balance in initial pitch variation.Four participants who joined the study at a laterdate were distributed in the same manner.Participants completed approximately threehours of training in half-hour sessions; someparticipants chose to occasionally have back-tobacksessions of one hour. The training sessionswere spread out over a period of fourweeks. Training took place in a quiet and privateroom at the university language unit, withoutthe presence of the researchers or otheronlookers. For the first four or five sessions,participants listened to and repeated the teacherversions of their own utterances. They were instructedto listen and repeat each of their 10 utterancesbetween 20 and 30 times. Test groupparticipants received the visual feedback describedabove and were encouraged to speak sothat the meter showed a maximum amount ofgreen bars. The control group was able to listento recordings of their production but receivedno other feedback.Upon completion of the repetitions, bothgroups were encouraged to use the system topractice their second oral presentation, whichwas to be on a different topic than the firstpresentation. For this practice, the part of theinterface designated for ‘free speech’ was used.In these sessions, once again the test participantsreceived visual feedback on their production,while control participants were only ableto listen to recordings of their speech. Within48 hours of completing the training, the participantsheld another presentation, this time aboutten minutes in length, for most of them as partof the examination of their English courses.This presentation was audio recorded.ResultsWe measured development in two ways: overthe roughly three hours of training per student,in which case we compared pitch variation inthe first and the second half of the training foreach of the 10 utterances used for practice, andin generalized form, by comparing pitch variationin two presentations, one before and oneafter training. Pitch estimations were extractedusing the same software used to feed the pitchvariation indicator used in training, an incrementalversion of the getF0/RAPT (Talkin,1995) algorithm. Variation was calculated in amanner consistent with Hincks (2005) by calcu-104
<strong>Proceedings</strong>, FONETIK <strong>2009</strong>, Dept. of Linguistics, Stockholm Universitylating the standard deviation over a moving 10second window.In the case of the training data, recordingscontaining noise only or those that were emptywere detected automatically and removed. Foreach of the 10 utterances included in the trainingmaterial, the data were split into a first anda second half, and the recordings from the firsthalf were spliced together to create one continuoussound file, as were the recordings fromthe second half. The averages of the windowedstandard deviation of the first and the secondhalf of training were compared.Average standard deviation in semitones1210864201st presentation 1st half training 2nd half training 2nd presentationFigure 1. Average pitch variation over 10 secondsof speech for the two experimental conditions duringthe 1st presentation, the 1st half of the training,the 2nd half of the training and the 2nd presentation.The test group shows a statistically significanteffect of the feedback they were given.The mean standard deviations for each dataset and each of the two groups are shown inFigure 1. The y-axis displays the mean standarddeviation per moving 10-second frame ofspeech in semitones, and the x-axis the fourpoints of measurement: the first presentation,the first half of training, the second half oftraining, and the second oral presentation. Theexperimental group shows a greater increase inpitch variation across all points of measurementfollowing training. Improvement is most dramaticin the first half of training, where the differencebetween the two groups jumps significantlyfrom nearly no difference to one of morethan 2.5 semitones. The gap between the twogroups narrows somewhat in the production ofthe second presentation.testcontrolThe effect of the feedback method (testgroup vs. control group) was analyzed using anANOVA with time of measurement (1st presentation,1st half of training, 2nd half of training,2nd presentation) as a within-subjects factor.The sphericity assumption was met, and themain effect of time of measurement was significant(F = 8.36, p < .0005, η² = 0.45) indicatingthat the speech of the test group receivingvisual feedback increased more in pitchvariation than the control group. Betweensubjecteffect for feedback method was significant(F = 6.74, p =.027, η² = 0.40). The two hypothesesare confirmed by these findings.DiscussionOur results are in line with other research thathas shown that visual feedback on pronunciationis beneficial to learners. The visual channelprovides information about linguistic featuresthat can be difficult for second language learnersto perceive audibly. The first language ofour Chinese participants uses pitch movementto distinguish lexical meaning; these learnerscan therefore experience difficulty in interpretingand producing pitch movement at a discourselevel in English (Pennington & Ellis,2000; Pickering, 2004; Wennerstrom, 1994).Our feedback gave each test participant visualconfirmation when they had stretched the resourcesof their voices beyond their own baselinevalues. It is possible that some participantshad been using other means, particularly intensity,to give focus to their English utterances.The visual feedback rewarded them for usingpitch movement only, and could have been apowerful factor in steering them in the directionof an adapted speaking style. While our datawere not recorded in a way that would allowfor an analysis of the interplay between intensityand pitch as Chinese speakers give focus toEnglish utterances, this would be an interestingarea for further research.Given greater resources in terms of time andpotential participants, it would have been interestingto compare the development of pitchvariation with other kinds of feedback. For example,we could have displayed pitch tracingsof the training utterances to a third group ofparticipants. It has not been an objective of ourstudy, however, to prove that our method is superiorto showing pitch tracings. We simplyfeel that circumventing the contour visualizationprocess allows for the more autonomoususe of speech technology. A natural develop-105
<strong>Proceedings</strong>, FONETIK <strong>2009</strong>, Dept. of Linguistics, Stockholm Universityment in future research will be to have learnerspractice presentation skills without teachermodels.It is important to point out that we cannotdetermine from these data that speakers becamebetter presenters as a result of their participationin this study. A successful presentation entails,of course, very many features, and usingpitch well is only one of them. Other vocal featuresthat are important are the ability to clearlyarticulate the sounds of the language, the rate ofspeech, and the ability to speak with an intensitythat is appropriate to the spatial setting. Inaddition, there are numerous other features regardingthe interaction of content, delivery andaudience that play a critical role in how thepresentation is received. Our presentation data,gathered as they were from real-life classroomsettings, are in all likelihood too varied to allowfor a study that attempted to find a correlationbetween pitch variation and, for example, theperceived clarity of a presentation. However,we do wish to explore perceptions of the speakers.We also plan to develop feedback gaugesfor other intonational features, beginning withrate of speech. We see potential to develop language-specificintonation pattern detectors thatcould respond to, for example, a speaker’s tendencyto use French intonation patterns whenspeaking English. Such gauges could form atype of toolbox that students and teachers coulduse as a resource in the preparation and assessmentof oral presentations.Our study contributes to the field in a numberof ways. It is, to the best of our knowledge,the first to rely on a synthesis of online fundamentalfrequency data in relation to learnerproduction. We have not shown the speakersthe absolute fundamental frequency itself, butrather how much it has varied over time as representedby the standard deviation. This variableis known to characterize discourse intendedfor a large audience (Johns-Lewis,1986), and is also a variable that listeners canperceive if they are asked to distinguish livelyspeech from monotone (Hincks, 2005; Traunmüller& Eriksson, 1995). In this paper, wehave demonstrated that it is a variable that caneffectively stimulate production as well. Furthermore,the variable itself provides a meansof measuring, characterizing and comparingspeaker intonation. It is important to point outthat enormous quantities of data lie behind thevalues reported in our results. Measurements offundamental frequency were made 100 times asecond, for stretches of speech up to 45 minutesin length, giving tens of thousands of datapoints per speaker for the training utterances.By converting the Hertz values to the logarithmicsemitone scale, we are able to make validcomparisons between speakers with differentvocal ranges. This normalization is an aspectthat appears to be neglected in commercial pronunciationprograms such as Auralog’s Tell MeMore series, where pitch curves of speakers ofdifferent mean frequencies can be indiscriminatelycompared. There is a big difference inthe perceptual force of a rise in pitch of 30Hzfor a speaker of low mean frequency and onewith high mean frequency, for example. Thesedifferences are normalized by converting tosemitones.Secondly, our feedback can be used for theproduction of long stretches of free speechrather than short, system-generated utterances.It is known that intonation must be studied at ahigher level than that of the word or phrase inorder for speech to achieve proper cohesiveforce over longer stretches of discourse. Bypresenting the learners with information abouttheir pitch variation in the previous ten secondsof speech, we are able to incorporate and reflectthe vital movement that should occur when aspeaker changes topic, for example. In an idealworld, most teachers would have the time to sitwith students, examine displays of pitch tracings,and discuss how peaks of the tracings relateto each other with respect to theoreticalmodels such as Brazil’s intonational paragraphs(Levis & Pickering, 2004). Our system cannotapproach that level of detail, and in fact cannotmake the connection between intonation and itslexical content. However, it can be used bylearners on their own, in the production of anycontent they choose. It also has the potential forfuture development in the direction of morefine-grained analyses.A third novel aspect of our feedback is thatit is transient and immediate. Our lights flickerand then disappear. This is akin to the way wenaturally process speech; not as something thatcan be captured and studied, but as soundwaves that last no longer than the millisecondsit takes to perceive them. It is also more similarto the way we receive auditory and sensoryfeedback when we produce speech – we onlyhear and feel what we produce in the very instancewe produce it; a moment later it is gone.Though at this point we can only speculate, itwould be interesting to test whether transient106
<strong>Proceedings</strong>, FONETIK <strong>2009</strong>, Dept. of Linguistics, Stockholm Universityfeedback might be more easily integrated andautomatized than higher-level feedback, whichis more abstract and may require more cognitiveprocessing and interpretation. The potentialdifference between transient and enduring feedbackhas interesting theoretical implicationsthat could be further explored.This study has focused on Chinese speakersbecause they are a group where many speakerscan be expected to produce relatively monotonespeech, and where the chances of achievingmeasurable development in a short period oftime were deemed to be greatest. However,there are all kinds of speaker groups who couldbenefit from presentation feedback. Like manycommunicative skills that are taught in advancedlanguage classes, the lessons can applyto native speakers as well. Teachers who producemonotone speech are a problem to studentseverywhere. Nervous speakers can alsotend to use a compressed speaking range, andcould possibly benefit from having practiceddelivery with an expanded range. Clinically,monotone speech is associated with depression,and can also be a problem that speech therapistsneed to address with their patients. However,the primary application we envisage hereis an aid for practicing, or perhaps even delivering,oral presentations.It is vital to use one’s voice well whenspeaking in public. It is the channel of communication,and when used poorly, communicationcan be less than successful. If listeners eitherstop listening, or fail to perceive what ismost important in a speaker’s message, then allactors in the situation are in effect wastingtime. We hope to have shown in this paper thatstimulating speakers to produce more pitchvariation in a practice situation has an effectthat can transfer to new situations. People canlearn to be better public speakers, and technologyshould help in the process.AcknowledgementsThis paper is an abbreviated version of an articleto be published in Language Learning andTechnology in October <strong>2009</strong>. The technologyused in the research was developed in partwithin the Swedish Research Council project#2006-2172 (Vad gör tal till samtal).ReferencesBrazil, D. (1986). The Communicative Value ofIntonation in English. Birmingham UK:University of Birmingham, English LanguageResearchEdlund, J., & Heldner, M. (2006). /nailon/ --Software for Online Analysis of Prosody.<strong>Proceedings</strong> of Interspeech 2006Hahn, L. D. (2004). Primary Stress and Intelligibility:Research to Motivate the Teachingof Suprasegmentals. TESOL Quarterly,38(2), 201-223.Hincks, R. (2005). Measures and perceptions ofliveliness in student oral presentation speech:a proposal for an automatic feedback mechanism.System, 33(4), 575-591.Johns-Lewis, C. (1986). Prosodic differentiationof discourse modes. In C. Johns-Lewis(Ed.), Intonation in Discourse (pp. 199-220).Breckenham, Kent: Croom Helm.Levis, J., & Pickering, L. (2004). Teaching intonationin discourse using speech visualizationtechnology. System, 32, 505-524.Pennington, M., & Ellis, N. (2000). CantoneseSpeakers' Memory for English Sentenceswith Prosodic Cues The Modern LanguageJournal 84(iii), 372-389.Pickering, L. (2001). The Role of Tone Choicein Improving ITA Communication in theClassroom. TESOL Quarterly, 35(2), 233-255.Pickering, L. (2004). The structure and functionof intonational paragraphs in native and nonnativespeaker instructional discourse. Englishfor Specific Purposes, 23, 19-43.Rosenberg, A., & Hirschberg, J. (2005). Acoustic/Prosodicand Lexical Correlates of CharismaticSpeech. Paper presented at the Interspeech2005, Lisbon.Strangert, E., & Gustafson, J. (2008). Subjectratings, acoustic measurements and synthesisof good-speaker characteristics. Paperpresented at the Interspeech 2008, Brisbane,Australia.Talkin, D. (1995). A robust algorithm for pitchtracking (RAPT). In W. B. Klejin, & Paliwal,K. K (Ed.), Speech Coding and Synthesis(pp. 495-518): Elsevier.Traunmüller, H., & Eriksson, A. (1995). Theperceptual evaluation of F 0 excursions inspeech as evidenced in liveliness estimations.Journal of the Acoustical Society ofAmerica, 97(3), 1905-1915.Wennerstrom, A. (1994). Intonational meaningin English discourse: A Study of Non-NativeSpeakers Applied Linguistics, 15(4), 399-421.Wennerstrom, A. (1998). Intonation as Cohesionin Academic Discourse: A Study ofChinese Speakers of English Studies in SecondLanguage Acquisition, 20, 1-25.107
<strong>Proceedings</strong>, FONETIK <strong>2009</strong>, Dept. of Linguistics, Stockholm UniversityPhonetic correlates of unintelligibility in VietnameseaccentedEnglishUna CunninghamSchool of Arts and Media, Dalarna University, FalunAbstractVietnamese speakers of English are often ableto communicate much more efficiently in writingthan in speaking. Many have quite highproficiency levels, with full command of advancedvocabulary and complex syntax, yetthey have great difficulty making themselvesunderstood when speaking English to both nativeand non-native speakers. This paper exploresthe phonetic events associated withbreakdowns in intelligibility, and looks at compensatorymechanisms which are used.IntelligibilityThe scientific study of intelligibility has passedthrough a number of phases. Two strands thathave shifted in their relative prominence are thematter of to whom non-native speakers are tobe intelligible. In one strand the emphasis is onthe intelligibility of non-native speakers to nativeEnglish-speaking listeners (Flege, Munro etal. 1995; Munro and Derwing 1995; Tajima,Port et al. 1997). This was the context in whichEnglish was taught and learned – the majorityof these studies have been carried out in whatare known as inner circle countries, which, inturn, reflects the anglocentricism which hascharacterised much of linguistics. The otherstrand focuses on the position of English as alanguage of international communication,where intelligibility is a two-way affair betweena native or non-native English-speaking speakerand a native or non-native English-speakinglistener (Irvine 1977; Flege, MacKay et al.1999; Kirkpatrick, Deterding et al. 2008; Rooy<strong>2009</strong>).The current study is a part of a larger studyof how native speakers of American English,Swedish, Vietnamese, Urdu and Ibo are perceivedby listeners from these and other languagebackgrounds. Vietnamese-accentedspeech in English has been informally observedto be notably unintelligible for native Englishspeakinglisteners and even for Vietnamese listenersthere is great difficulty in choosingwhich of four words has been uttered (Cunningham<strong>2009</strong>).There are a number of possible ways inwhich intelligibility can be measured. Listenerscan be asked to transcribe what they hear or tochoose from a number of alternatives. Stimulivary from spontaneous speech through texts tosentences to wordlists. Sentences with varyingdegrees of semantic meaning are often used(Kirkpatrick, Deterding et al. 2008) to controlfor the effect of contextual information on intelligibility.Few intelligibility studies appear to beconcerned with the stimulus material. The questionof what makes an utterance unintelligible isnot addressed in these studies. The current paperis an effort to come some way to examiningthis issue.Learning English in VietnamThe pronunciation of English presents severechallenges to Vietnamese-speaking learners.Not only is the sound system of Vietnamesevery different from that of English, but there arealso extremely limited opportunities for hearingand speaking English in Vietnam. In addition,there are limited resources available to teachersof English in Vietnam so teachers are likely topass on their own English pronunciation to theirstudents.University students of English are introducedto native-speaker models of English pronunciation,notably Southern educated British,but they do not often have the opportunity tospeak with non-Vietnamese speakers of English.Most studies of Vietnamese accents inEnglish have been based in countries whereEnglish is a community language, such as theU.S. (Tang 2007) or Australia (Nguyen 1970;In-gram and Nguyen 2007). This study is thusunusual in considering the English pronunciationof learners who live in Vietnam. Thespeech material presented here was produced bymembers of a group of female students fromHanoi.Vietnamese accents of EnglishThe most striking feature of VietnameseaccentedEnglish is the elision of consonants, inparticular in the syllable coda. This can obvi-108
<strong>Proceedings</strong>, FONETIK <strong>2009</strong>, Dept. of Linguistics, Stockholm Universityously be related to the phonotactic constraintsoperational in Vietnamese, and it is clearly aproblem when speaking English which places aheavy semantic load on the coda in verb formsand other suffixes. Consonant clusters are generallysimplified in Vietnamese-accent Englishto a degree that is not compatible with intelligibility.Even single final consonants are oftenabsent or substituted for by another consonantwhich is permitted in the coda in Vietnamese.Other difficulties in the intelligibility ofVietnamese-accented English are centred invowel quality. English has a typologically relativelyrich vowel inventory, and this createsproblems for learners with many L1s, includingVietnamese. The distinction between the vowelsof KIT and FLEECE to use the word classterminology developed by John Wells (Wells1982) or ship and sheep to allude to the popularpronunciation teaching textbook (Baker 2006)is particularly problematic.Other problematic vowel contrasts are thatbetween NURSE and THOUGHT (e.g. work vswalk) and between TRAP AND DRESS (e.g.bag vs beg). The failure to perceive or producethese vowel distinctions is a major hinder to theintelligibility of Vietnamese-accented English.Vowel length is not linguistically significantin Vietnamese and the failure to notice or producepre-fortis clipping is another source of unintelligibility.Another interesting effect that isattributable to transfer from Vietnamese is theuse in English of the rising sac tone on syllablesthat have a voiceless stop in the coda. Thiscan result in a pitch prominence that may beinterpreted as stress by listeners.Vietnamese words are said to be generallymonosyllabic, and are certainly written asmonosyllables with a space between each syllable.This impression is augmented (or possiblyexplained) by the apparent paucity of connectedspeech phenomena in Vietnamese and consequentlyin Vietnamese-accented English.AnalysisA number of features of Vietnamese-accentedEnglish will be analysed here. They are a) thevowel quality distinction between the wordssheep and ship, b) the vowel duration distinctionbetween seat and seed, and c) the causes ofglobal unintelligibility in semantically meaningfulsentences taken from an earlier study(Munro and Derwing 1995).Vowel qualityThe semantic load of the distinction betweenthe KIT and FLEECE vowels is significant.This opposition seems to be observed in mostvarieties of English, and it is one that has beenidentified as essential for learners of English tomaster (Jenkins 2002). Nonetheless, this distinctionis not very frequent in the languages ofthe world. Consequently, like any kind of newdistinction, a degree of effort and practice isrequired before learners with many first languages,including Vietnamese, can reliably perceiveand produce this distinction.Figure 1. F1 vs F2 in Bark for S15 for the wordsbead, beat, bid, bit.Fig.1 shows the relationship between F1 andF2 in Bark for the vowels in the words beat,bead, bit and bid for S15, a speaker of Vietnamese(a 3 rd year undergraduate English majorstudent at a university in Hanoi). This speakerdoes not make a clear spectral distinction betweenthe vowels. As spectral quality is themost salient cue to this distinction for nativespeakers of English (Ladefoged 2006; Cruttenden2008), the failure to make a distinction isobviously a hinder to intelligibility.Vowel durationEnhanced pre-fortis clipping is used in manyvarieties of English as a primary cue to postvocalicvoicelessness (Ladefoged 2006; Cruttenden2008). It has been well documented thatphonologically voiced (lenis) post-vocalic consonantsare often devoiced by native speakersof many varieties of English (e.g. Cruttenden2008). This means that in word sets such asbead, beat, bid, bit native speakers will signalpostvocalic voicing primarily by shortening theprevocalic vowel in beat and bit. In addition,native speakers will have a secondary durationalcue to the bead, beat vs bid, bit voweldistinction where the former vowel is system-109
<strong>Proceedings</strong>, FONETIK <strong>2009</strong>, Dept. of Linguistics, Stockholm Universityatically longer than the latter (Cruttenden2008).Figure 2. Average vowel and stop duration in msfor S15 for 5 instances of the words bead, beat, bid,bit.So, as is apparent from Figure 2, speaker S15manages to produce somewhat shorter vowelsin bid and bit than in beat and bit. This is theprimary cue that this speaker is using to dissimilatethe vowels, although not, unfortunatelythe cue expected as most salient by native listeners.But there is no pre-fortis clipping apparent.This important cue to post-vocalic voicingis not produced by this speaker. In conjunctionwith the lack of spectral distinction between thevowels of bead, bead vs. bid, bit seen in Figure1, the result is that these four words are percievedas indistinguishable by native and notnativelisteners (Cunningham <strong>2009</strong>).Sentence intelligibilityA number of factors work together to confoundthe listener of Vietnamese-accented English inconnected speech. Not only is it difficult to perceivevowel identity and post vocalic voicing asin the above examples, but there are a numberof other problems. Consider the sentence Myfriend’s sheep is often green. This is taken fromthe stimuli set used for the larger study mentionedabove. The advantage of sentences ofthis type is that the contextual aids to interpretabilityare minimised while connected speechphenomena are likely to be elicited. There arehere a number of potential pitfalls for the Vietnamesespeaker of English. The cluster at theend of friend’s, especially in connection withthe initial consonant in sheep can be expectedto prove difficult and to be simplified in someway. The quality and duration of the vowels insheep and green can be expected to cause confusion(as illustrated in Figures 1 and 2 above.The word often is liable to be pronounced witha substitution of /p/ for the /f/ at the end of thefirst syllable, as voiceless stops are permissiblein coda position in Vietnamese while fricativesare not.Let us then see what happens when speakerV1, a 23-year old male graduate student of Englishfrom Hanoi, reads this sentence. In fact hemanages the beginning of the utterance well,with an appropriate (native-like) elision of the/d/ in friends. Things start to go wrong after thatwith the word sheep. Figure 3 shows a spectrogramof this word using Praat (Boersma andWeenink <strong>2009</strong>). As can be seen, the final consonantcomes out as an ungrooved [s].Figure 3. The word sheep as pronounced by speakerV1.Now there is a possible explanation for this. Asmentioned above, final /f/ as in the word if isoften pronounced as [ip]. This pronunciation isviewed as characteristic of VietnameseaccentedEnglish in Vietnam – teacher and thuslearner awareness of this is high, and the featureis stigmatised. Thus the avoidance of the final/p/ of sheep may be an instance of hypercorrection.It is clearly detrimental to V1’s intelligibility.Another problematic part of this sentence byV1 is that he elides the /z/ in the word is. Thereis silence on either side of this vowel. Again,this leads to intelligibility problems. The finaldifficulty for the listener in this utterance is amatter of VOT in the word green. V1 has novoice before the vowel begins as is shown infigure 4. The stop is apparently voiceless andthe release is followed by a 112ms voicelessaspiration. This leads to the word being misinterpretedby listeners as cream.110
<strong>Proceedings</strong>, FONETIK <strong>2009</strong>, Dept. of Linguistics, Stockholm UniversityFigure 4 the word green as pronounced by speakerV1. The marking shows aspiration after the releaseof the initial stop.ConclusionSo it can be seen that the intelligibility of theseVietnamese speakers of English is a majorproblem for them and their interlocutors. Notonly do they have non-native pronunciation featuresthat are clear instances of transfer fromtheir L1, Vietnamese, they also have other,spontaneous, modifications of the targetsounds. This is part of the general variabilitythat characterises non-native pronunciation, butwhen the sounds produced are as far from thetarget sounds as they are in the speech of V1,communication is an extreme effort.ReferencesBaker, A. (2006). Ship or sheep: an intermediatepronunciation course. Cambridge, CambridgeUniversity Press.Boersma, P. and D. Weenink (<strong>2009</strong>). Praat: doingphonetics by computer.Cruttenden, A. (2008). Gimson's Pronunciationof English. London, Hodder ArnoldCunningham, U. (<strong>2009</strong>). Quality, quantity andintelligibility of vowels in VietnameseaccentedEnglish. Issues in Accents of EnglishII: Variability and Norm. E. Waniek-Klimczak. Newcastle, Cambridge ScholarsPublishing Ltd.Flege, J. E., I. R. A. MacKay, et al. (1999). NativeItalian speakers' perception and productionof English vowels. Journal of theAcoustical Society of America 106(5):2973-2987.Flege, J. E., M. J. Munro, et al. (1995). Factorsaffecting strength of perceived foreign accentin a 2nd language. Journal of theAcoustical Society of America 97(5): 3125-3134.Ingram, J. C. L. and T. T. A. Nguyen (2007).Vietnamese accented English: Foreign accentand intelligibility judgement by listenersof different language backgrounds, Universityof Queensland.Irvine, D. H. (1977). Intelligibility of Englishspeech to non-native English speakers. Languageand Speech 20: 308-316.Jenkins, J. (2002). A sociolinguistically based,empirically researched pronunciation syllabusfor English as an international language.Applied Linguistics 23(1): 83-103.Kirkpatrick, A., D. Deterding, et al. (2008). Theinternational intelligibility of Hong KongEnglish. World Englishes 27(3-4): 359-377.Ladefoged, P. (2006). A Course in Phonetics.Boston, Mass, Thomson.Munro, M. J. and T. M. Derwing (1995). Processingtime, accent, and comprehensibilityin the perception of native and foreignaccentedspeech. Language and Speech 38:289-306.Nguyen, D. L. (1970). A contrastive phonologicalanalysis of English and Vietnamese.Canberra, Australian National University.Rooy, S. C. V. (<strong>2009</strong>). Intelligibility and perceptionsof English proficiency. World Englishes28(1): 15-34.Tajima, K., R. Port, et al. (1997). Effects oftemporal correction on intelligibility of foreign-accentedEnglish, Academic Press Ltd.Tang, G. M. (2007). Cross-linguistic analysis ofVietnamese and English with implicationsfor Vietnamese language acquisition andmaintenance in the United States. Journal ofSoutheast Asian American Education andAdvancement 2.Wells, J. C. (1982). Accents of English. Cambridge,Cambridge University Press111
<strong>Proceedings</strong>, FONETIK <strong>2009</strong>, Dept. of Linguistics, Stockholm UniversityPerception of Japanese quantity by Swedish speakinglearners: A preliminary analysisMiyoko InoueDepartment of Japanese Language & Culture, Nagoya University, JapanAbstractSwedish learners’ perception of Japanesequantity was investigated by means of an identificationtask. Swedish informants performedsimilarly to native Japanese listeners inshort/long identification of both vowel andconsonant. The Swedish and Japanese listenersreacted similarly both to the durational variationand to the F0 change despite the differentuse of F0 fall in relation with quantity in theirL1.IntroductionA quantity language is a language that has aphonological length contrast in vowels and/orconsonants. Japanese and Swedish are known assuch languages, and they employ both vowelsand consonants for the long/short contrast (Han,1965, for Japanese; Elert, 1964, for Swedish).Both of the languages use duration as a primaryacoustic cue to distinguish the long/short contrast.Quantity in Japanese is known to be difficultto acquire for learners (e.g. Toda, 2003), however,informants in previous research havemainly been speakers of non-quantity languages.In their research on L2 quantity in Swedish,McAllister et al. (2002) concluded that the degreeof success in learning L2 Swedish quantityseemed to be related to the role of the durationfeature in learners’ L1. It can, then, be anticipatedthat Swedish learners of Japanese may berelatively successful in acquiring Japanesequantity. The present study, thus, aims to investigatewhether Swedish learners are able toperform similarly to the Japanese in the perceptionof Japanese quantity of vowels and consonants.In addition to duration, there can be otherphonetic features that might supplement thequantity distinction in quantity languages. InSwedish, quality is such an example, but such afeature may not be necessarily utilized in otherlanguages. For example, quality does not seemto be used in the quantity contrast in Japanese(Arai et al., 1999).Fundamental frequency (F0) could be such asupplementary feature in Japanese. Kinoshita etal. (2002) and Nagano-Madsen (1992) reportedthat the perception of quantity in L1 Japanesewas affected by the F0 pattern. In theirexperiments, when there was a F0 fall within avowel, Japanese speakers tended to perceive thevowel as ‘long’. On the other hand, a vowelwith long duration was heard as ‘short’ when theonset of F0 fall was at the end of the vowel(Nagano-Madsen, 1992).These results are in line with phonologicaland phonetic characteristics of word accent inJapanese. It is the first mora that can be accentedin a long vowel, and the F0 fall is timed with theboundary of the accented and the post-accentmorae of the vowel. Since the second mora in along vowel does not receive the word accent, aF0 fall should not occur at the end of a longvowel.In Swedish, quantity and word accent seemonly to be indirectly related to the stress in sucha way that the stress is signaled by quantity andthe F0 contour of word accent is timed with thestress. In the current research, it is also examinedif Swedish learners react differently tostimuli with and without F0 change. Responseto unaccented and accented words will becompared. An unaccented word in Japanesetypically has only a gradual F0 declination,while an accented word is characterized by aclear F0 fall. It can be anticipated that Swedishlearners would perform differently from nativeJapanese speakers.MethodologyAn identification task was conducted in order toexamine the categorical boundary between longand short vowels and consonants and the consistencyof the categorization. The task wascarried out in a form of forced-choice test, andthe results were compared between Swedish andJapanese informants.StimuliThe measured data of the prepared stimuli 1 areshown in Table 1 and112
<strong>Proceedings</strong>, FONETIK <strong>2009</strong>, Dept. of Linguistics, Stockholm UniversityTable 2. The original sound, accented and unaccented/mamama, mama:ma/ (for long/shortvowel) and /papapa, papap:a/ (for long/shortconsonant), was recorded by a female nativeJapanese speaker. For the accented version, the2nd mora was accented for both ma- andpa-series. The stimuli were made by manipulatinga part of recorded tokens with Praat(Boersma and Weenink, 2004) so that the longsound shifts to short in 7 steps. Thus, a total of28 tokens (2 series x 7 steps x 2 accent type)were prepared. The F0 peak, the location of F0peak in V2 and the final F0 were fixed at theaverage value of long and short sounds.Table 1. The measurements of the stimuli inma-series (adopted from Kanamura, 2008: 30 (Table2-2) and 41 (Table 2-5), with permission). Theunaccented and the accented stimuli are differentiatedby the utterance final F0 (rightmost column).No. RatioC3Duration(ms)WordDuration(ms)1 0.25 78 5822 0.40 128 6273 0.55 168 6734 0.70 213 7185 0.85 259 7646 1.00 303 8107 1.15 349 855F0Peak(Hz)PeakLocationinV2330 48%FinalF0 (Hz)242(unacc)136(acc)Table 2. The measurements of the stimuli inpa-series. The unaccented and the accented stimuliare differentiated by the utterance final F0 (rightmostcolumn).No. RatioC3Duration(ms)WordDuration(ms)1 0.25 85 4632 0.40 136 5143 0.55 188 5664 0.70 239 6175 0.85 290 6686 1.00 341 7197 1.15 392 770F0Peak(Hz)PeakLocationinV2295 96%FinalF0 (Hz)231(unacc)116(acc)InformantsThe informants were 23 Swedish learners ofJapanese (SJ) at different institutions in Japanand Sweden. The length of studying Japanesevaried from 3 to 48 months. 2 Thirteen nativespeakers of standard Japanese (NJ) also participatedin the task in order for comparison.ProcedureAn identification task was conducted usingExperimentMFC of Praat. Four sessions(ma-/pa-series x 2 accent) were held for eachinformant. In each session, an informant listenedto 70 stimuli (7 steps x 10 times) randomlyand answered whether the stimulus played was,for example, /mamama/ or /mama:ma/ byclicking on a designated key.Calculation of the categorical boundaryand the ‘steepness’ of categorical functionThe location of the categorical boundary betweenlong and short, and also the consistency(‘steepness’) of the categorization function wascalculated following Ylinen et al. (2005). Thecategorical boundary is indicated in milliseconds.The value of steepness is interpreted insuch a way that the smaller the value, thestronger the consistency of the categorizationfunction.ResultsIt was reported in Kanamura (2008) that severalof the Chinese informants did not show correspondencebetween the long/short responses andthe duration of V2 in the mamama/mama:mastimuli. She excluded the data of such informantsfrom the analysis. No such inconsistencybetween the response and the duration wasfound for the Swedes or for the Japanese in thecurrent study, and thus none of the data wereomitted in this regard. However, the data of oneJapanese informant was eliminated from theresult of ma-series since the calculated boundarylocation of that person was determined as extremelyhigh compared with the others.Perception of long and short vowel(ma-series)Figure 1 indicates the percentage of ‘short’ responseto the stimuli. The leftmost stimulus onx-axis (labeled as ‘0.25’) is the shortest soundand the rightmost the longest (‘1.15’). Theplotted responses traced s-shaped curves, andthe curves turned out to be fairly close to eachother. Differences are found at 0.55 and 0.70,and the ‘short’ responses by NJ differ visiblybetween unaccented and accented stimuli. The‘short’ response to the accented stimuli at 0.55113
<strong>Proceedings</strong>, FONETIK <strong>2009</strong>, Dept. of Linguistics, Stockholm Universitydropped to a little below 80%, but the unaccentedstimuli remained as high as almost 100%.SJ’s responses to unaccented/accented stimuli at0.55 appeared closely to each other. Besides, thes-curves of SJ looked somewhat more gradualthan those of NJ.Figure 1. The percentage of “short” responses forstimuli with the shortest to the longest V2 (from leftto right on x-axis).Table 3 shows the mean category boundaryand the steepness of the categorization function.Two-way ANOVAs were conducted for thefactors Group (SJ, NJ) and Accent Type (Unaccented,Accented) separately for the categoryboundary and the steepness.Table 3. The category boundary location (ms) andthe steepness of the categorization function in theunaccented (flat) and the accented stimuli ofma-series.Unaccented(flat)AccentedSJ NJ SJ NJBoundary (ms) 199.6 200.0 191.3 182.6SD 13.6 15.1 13.4 13.2Steepness 27.8 16.3 27.6 18.8SD 7.7 8.9 9.7 10.5For the categorical boundary, the interactionbetween Group and Accent Type tended to besignificant (F(1,33)=3.31, p
<strong>Proceedings</strong>, FONETIK <strong>2009</strong>, Dept. of Linguistics, Stockholm UniversityThe result for steepness was similar to that ofma-series. There was no significant interactionbetween the factors Group and Accent Type(F(1,34)=0.00, n.s.), but there was a significantmain effect of Group (F(1,34)=11.47, p
<strong>Proceedings</strong>, FONETIK <strong>2009</strong>, Dept. of Linguistics, Stockholm UniversityAutomatic classification of segmental second languagespeech quality using prosodic featuresEero Väyrynen 1 , Heikki Keränen 2 , Juhani Toivanen 3 and Tapio Seppänen 41 2,4 MediaTeam, University of Oulu3 MediaTeam, University of Oulu & Academy of FinlandAbstractAn experiment is reported exploring whetherthe general auditorily assessed segmental qualityof second language speech can be evaluatedwith automatic methods, based on a number ofprosodic features of the speech data. The resultssuggest that prosodic features can predictthe occurrence of a number of segmental problemsin non-native speech.IntroductionOur research question is: is it possible, by lookinginto the supra-segmentals of a second languagevariety, to gain essential informationabout the segmental aspects, at least in a probabilisticmanner? That is, if we know what kindsof supra-segmental features occur in a secondlanguage speech variety, can we predict whatsome of the segmental problems will be?The aim of this research is to find if suprasegmentalspeech features can be used to constructa segmental model of Finnish secondlanguage speech quality. Multiple nonlinear polynomialregression methods (for general referencesee e.g. Khuri (2003)) are used in an attemptto construct a model capable of predictingsegmental speech errors based solely onglobal prosodic features that can be automaticallyderived from speech recordings.Speech dataThe speech data used in this study was producedby 10 native Finnish speakers (5 maleand 5 female), and 5 native English speakers (2male and 3 female). Each of them read twotexts: first, a part of the Rainbow passage, andsecond, a conversation between two people.Each rendition was then split roughly from themiddle into two smaller parts to form a total of60 speech samples (4 for each person). The datawas collected by Emma Österlund, M.A.Segmental analysisThe human rating of the speech material wasdone by a linguist who was familiar with thetypes of problems usually encountered by Finnswhen learning and speaking English. The ratingwas not based on a scale rating of the overallfluency or a part thereof, but instead on countingthe number of errors in individual segmentalor prosodic units. As a guideline for theanalysis, the classification by Morris-Wilson(1992) was used to make sure that especiallythe most common errors encountered by Finnslearning English were taken into account.The main problems for the speakers were,as was expected for native Finnish speakers,problems with voicing (often with the sibilants),missing friction (mostly /v, θ, ð/), voiceonset time and aspiration (the plosives /p, t, k,b, d, g/), and affricates (post-alveolar instead ofpalato-alveolar). There were also clear problemswith coarticulation, assimilation, linking,rhythm and the strong/weak form distinction,all of which caused unnatural pauses withinword groups.The errors were divided into two rough categories,segmental and prosodic, the lattercomprising any unnatural pauses and wordlevelerrors – problems with intonation wereignored. Subsequently, only the data on thesegmental errors was used for the acousticanalysis.Acoustic analysisFor the speech data, features were calculatedusing the f0Tool software (Seppänen et al.2003). The f0Tool is a software package for automaticprosodic analysis of large quanta ofspeech data. The analysis algorithm first distinguishesbetween the voiced and voiceless partsof the speech signal using a cepstrum basedvoicing detection logic (Ahmadi & Spanias1999) and then determines the f0 contour forthe voiced parts of the signal with a high precisiontime domain pitch detection algorithm(Titze & Haixiang 1993). From the speech signal,over forty acoustic/prosodic parameterswere computed automatically. The parameterswere:116
<strong>Proceedings</strong>, FONETIK <strong>2009</strong>, Dept. of Linguistics, Stockholm UniversityA) general f0 features: mean, 1%, 5%,50%, 95%, and 99% values of f0(Hz), 1%- 99% and 5%-95% f0ranges (Hz)B) features describing the dynamics off0 variation: average continuous f0rise and fall (Hz), average f0 riseand fall steepness (Hz/cycle), maxcontinuous f0 rise and fall (Hz), maxsteepness of f0 rise and fall(Hz/cycle)C) additional f0 features: normalisedsegment f0 distribution width variation,f0 variance, trend correctedmean proportional random f0 perturbation(jitter)D) general intensity features: mean,median, min, and max RMS intensities,5% and 95% values of RMS intensity,min-max and 5%-95% RMSintensity rangesE) additional intensity features: normalisedsegment intensity distributionwidth variation, RMS intensity variance,mean proportional random intensityperturbation (shimmer)F) durational features: average lengthsof voiced segments, unvoiced segmentsshorter than 300ms, silencesegments shorter than 250ms, unvoicedsegments longer than 300ms,and silence segments longer than250ms, max lengths of voiced, unvoiced,and silence segmentsG) distribution and ratio features: percentagesof unvoiced segmentsshorter than 50ms, between 50-250ms, and between 250-700ms, ratioof speech to long unvoiced segments(speech = voiced + unvoiced
<strong>Proceedings</strong>, FONETIK <strong>2009</strong>, Dept. of Linguistics, Stockholm Universitythe data is drawn from a distribution consistentwith the null hypothesis where the prosodic datais assumed containing no explanatory linearcomponents at all. Finally, the consistency ofthe speaker independent regression coefficientswas inspected to ensure the validity and stabilityof the model.ResultsThe first feature selection resulted in a featurevector that contains no second order polynomials.The 15 features are described in Table 1. Aselected cross term is indicated as “feature Xfeature”.Table 1. Selected features in the first searchtrend corrected mean proportional random f0perturbation (jitter)average lengths of unvoiced segments longerthan 300msnormalised segment intensity distributionwidth variation50% values of f0 X percentages of unvoicedsegments between 250-700ms1% values of f0 X max lengths of silence segmentsaverage continuous f0 rise X average continuousf0 fallaverage continuous f0 fall X max steepness off0 fallaverage continuous f0 fall X max lengths ofvoiced segmentsmax continuous f0 fall X ratio of speech tolong unvoiced segments (speech = voiced + unvoiced
<strong>Proceedings</strong>, FONETIK <strong>2009</strong>, Dept. of Linguistics, Stockholm UniversityError residualFigure 1. Cross-validated regression residuals. Thedata is ordered in an ascending human error withthe circles indicating the residual errors.The resulting regression residuals indicatethat perhaps some nonrandom trend is stillpresent. Some relevant information not includedby the regression model is therefore possiblystill present in the residual errors. It maybe that the used prosodic features do not includethis information or that more coefficientsin the model could be justified.Regression estimate1050−52520151050Cross−validated residuals5 10 15 20 25 30 35 40 45 50 55 60Sample #Scatterplot−50 5 10 15 20 25Human estimateFigure 2. A scatterplot of human errors against thecorresponding cross-validated regression estimates.The solid line shows for reference where a perfectlinear correspondence is located and the dashed lineis a least squares fit of the data.The scatter plot shows a linear dependenceof 0.76 between human and regression estimateswith 66% of variance explained.ConclusionThe results suggest that segmental fluency or“correctness” in second language speech can bemodelled using prosodic features only. It seemsthat segmental and supra-segmental second languagespeech skills are interrelated. Parametersdescribing the dynamics of prosody (notably,the steepness and magnitude of f0 movements –see Table 1) are strongly correlated with theevaluated segmental quality of the second languagespeech data. Generally, it may be thecase that segmental and supra-segmental (prosodic,intonational) problems in second languagespeech occur together: a command of onepronunciation aspect may improve the other.Some investigators actually argue that good intonationand rhythm in a second language will,almost automatically, lead to good segmentalfeatures (Pennington, 1989). From a technologicalviewpoint, it can be concluded that amodel capable of estimating segmental errorscan be constructed using prosodic features. Furtherresearch is required to evaluate if a robusttest and index of speech proficiency can beconstructed. Such an objective measure can beseen as a speech technology application of greatinterest.ReferencesAhmadi, S. & Spanias, A.S. (1999) Cepstrumbased pitch detection using a new statisticalV/UV classification algorithm. IEEE Transactionon Speech and Audio Processing 7(3), 333–338.Hubert, M., Rousseeuw, P.J., Vanden Branden,K. (2005) ROBPCA: a new approach to robustprincipal component analysis. Technometrics47, 64–79.Khuri, A.I. (2003) Advanced Calculus withApplications in Statistics, Second Edition.Wiley, Inc., New York, NY.Morris-Wilson, I. (1992) English segmentalphonetics for Finns. Loimaa: Finn Lectura.Pennington, M.C. (1989) Teaching pronunciationfrom the top down. RELC Journal, 20-38.Pudil, P., Novovičová, J. & Kittler J. (1994)Floating search methods in feature selection.Pattern Recognition Letters 15 (11),1119–1125.Seppänen, T., Väyrynen, E. & Toivanen, J.(2003). Prosody-based classification ofemotions in spoken Finnish. <strong>Proceedings</strong> ofthe 8th European Conference on SpeechCommunication and TechnologyEUROSPEECH-2003 (Geneva, Switzerland),717–720.Titze, I.R. & Haixiang, L. (1993) Comparisonof f0 extraction methods for high-precisionvoice perturbation measurements. Journal ofSpeech and Hearing Research 36, 1120–1133.119
<strong>Proceedings</strong>, FONETIK <strong>2009</strong>, Dept. of Linguistics, Stockholm UniversityChildren’s vocal behaviour in a pre-school environmentand resulting vocal functionMechtild Tronnier 1 and Anita McAllister 21 Department of Culture and Communication, University of Linköping2 Department of Clinical and Experimental Medicine, University of LinköpingAbstractThis study aims to shed some light onto the relationshipbetween the degree of hoarseness inchildren’s voices observed at different timesduring a day in pre-school and different aspectsof their speech behaviour. Behaviouralaspects include speech activity, phonation time,F0 variation, speech intensity and the relationshipbetween speech intensity and backgroundnoise intensity. The results show that childrenbehave differently and that the same type of behaviourhas a varied effect on the differentchildren. It can be seen from two children withotherwise very similar speech behaviour, thatthe fact that one of them produces speech at ahigher intensity level also brings about an increaseof hoarseness by the end of the day inpre-school. The speech behaviour of the childwith highest degree of hoarseness on the otherhand cannot be observed to be putting an extremeload on the vocal system.IntroductionSpeaking with a loud voice in noisy environmentsin order to making oneself heard demandssome vocal effort and has been shown toharm the voice in the long run.In several studies on vocal demands for differentprofessions it has been shown that preschoolteachers are rather highly affected andthat voice problems are common (Fritzell,1996; Sala, Airo, Olkinuora, Simberg, Ström,Laine, Pentti, & Suonpää 2002; Södersten,Granqvist, Hammarberg & Szabo, 2002). Thisproblem is to a large extent based on the needof the members of this professional group tomake themselves heard over the surroundingnoise, mainly produced by the children present.It is reasonable to assume that children’svoices are equally affected by background noiseas adult voices. As children most of the timecontribute to the noise in a pre-school settingthemselves – rather then other environmentalfactors as traffic etc. – they are exposed to thenoise source even more potently as they arecloser to the noise source. Another factor pointingin the same direction is their shorter bodylength compared to pre-school teachers.In an earlier study by McAllister et al.,(2008, in press), the perceptual evaluation ofpre-school children showed that the girls’voices revealed higher values on breathiness,hyperfunction and roughness by the end of theday, which for the boys was only the case forhyperfunction.In the present study the interest is directedto speech behaviour of children in relation tothe background noise and the affect on the vocalfunction. Diverse acoustic measurementswere carried out for this purpose.The investigation of speech activity is chosento show the individuals’ liveliness in thepre-school context and includes voiced andvoiceless speech segments, even non speechvoiced segments such as laughter, throat clearing,crying etc. In addition, measurements onphonation time were chosen, reflecting the vocalload. It should be noted that in some parts ofspeech intended voicing could fail due to theirregularity of the vocal fold vibrations – thehoarseness of the speaker’s voice. Therefore,both measurements, speech activity and phonationtime were considered important. In a studyon phonation time for different professions,Masuda et al. (1993) showed that the proportionfor pre-school teachers corresponded to20% during working time, which is considereda high level compared to e.g. nurses with a correspondinglevel of 5.3% (Ohlsson, 1988). Havingthese findings in mind, the degree of children’sspeech activity and phonation time andthe consequences for perceived voice quality isan interesting issue.Other factors for the analysis of vocal loadconsist of F0 including F0-variation and speechintensity including intensity variation. A vocaltrauma can be based on using high fundamentalfrequency and high vocal loudness (and hyperfunction,which this study is not focusing on inparticular), as Södersten et al. point out.One further aspect that may increase therisk for voice problems is the need of a speakerto be heard over background noise. Therefore,120
<strong>Proceedings</strong>, FONETIK <strong>2009</strong>, Dept. of Linguistics, Stockholm Universitythe relationship speech intensity/backgroundnoise intensity is investigated. According to theresults of Södersten et al. the subjects speechwas 9.1dB louder than the environmental noise,in an already noisy environment.Material and MethodThe material investigated in the present study ispart of the data gathered for the project Barnoch buller (Children and noise). The project is acooperation between the University ofLinköping and KTH, Stockholm, within the largerBUG project (Barnröstens utveckling ochgenusskillnader; Child Voice Development andGenderDifferences;http://www.speech.kth.se/music/projects/BUG/abstract.html). It consists of the data of selectedrecordings from four five-year-old children, attendingdifferent pre-schools in Linköping.These children were recorded using a binauraltechnique (Granqvist, 2001) three times duringone day at the pre-school: at arriving in themorning (m) and gathering, during lunch (l)and in the afternoon during play time (a). Thebinaural recording technique makes it possibleto extract one audio file containing the child’sspeech activity (1) and one file containing thesurrounding sound (2). Each recording consistedof two parts. First a recording with a controlledcondition was made, where the childrenwere asked to repeat the following phrases threetimes: “En blå bil. En gul bil. En röd bil”. Furthermorespontaneous speech produced duringthe following activities at the pre-school wererecorded for approximately one hour.The recordings of the controlled condition,comprising the phrase repetitions, were used inan earlier study (McAllister et al., in press) toperceptually assess the degree of hoarseness,breathiness, hyperfunction and roughness bythree professional speech pathologists. Assessmentwas carried out by marking the degree ofeach of the four voice qualities plus an optionalparameter on a Visual Analog Scale (VAS).The averaged VAS-ratings by the speechpathologists for the four children regarding thecomprehensive voice quality hoarseness wereused as a selection criterion in the present investigation.The selected children showed differenttendencies regarding the hoarsenessvariation over the day at pre-school (see e.g.Table 1).• child A showed a marked increase ofhoarseness,• child B showed some increase of hoarseness,• child C showed no increase of hoarseness,• child D showed a clear decrease of hoarseness.The development of the children’s voicesover the day was compared to the developmentof several acoustic measures of the recordingsof spontaneous speech, shedding light on thechildren’s speech behaviour and activity andthe use of the voiceThe speech activity of each child duringeach recording session was calculated by settingthe number of obtained intensity counts in relationto the potential counts of the whole recordingaccording to an analysis in PRAAT witha sampling rate of 100Hz (in %).Furthermore phonation time was calculatedby setting the number of obtained F0-measuresin relation to the potential counts of the wholerecording according to an analysis in PRAATwith a sampling rate of 100Hz (in %).An analysis of the fundamental frequencyand the intensity was carried out in PRAAT witha sampling rate of 100Hz for file (1), whichcontains the child’s speech. Intensity measureswere also normalised in comparison to a calibrationtone and with regard to microphone distancefrom the mouth to 15 cm.For both F0- and intensity measurements,the mean value, standard deviation and median(in Hz and dB) was calculated. For the sake ofinterpretation of the results regarding the measurementsof fundamental frequency, additionalF0-measurements of controlled speech obtainedfrom the BUG-material for each child is givenin the results.Concerning the background noise investigation,the intensity was calculated in PRAAT witha sampling rate of 100Hz for file (2). Intensitymeasurements for this channel were normalisedin comparison to a calibration tone.Descriptive statistics for the interpretation ofthe measurements was used. The degree ofhoarseness is not a direct consequence of thespeech behaviour reflected by the acousticmeasurements presented in the same rows inthe tables below, because the recordings of thecontrolled condition were made before the recordingsof spontaneous speech.ResultsIn this section the results of the diverse measurementsare presented. In the tables, the perceptualratings of degree of hoarseness obtainedfrom an earlier study are shown, too. They are,however, not considered any further here but121
<strong>Proceedings</strong>, FONETIK <strong>2009</strong>, Dept. of Linguistics, Stockholm Universityare relevant for the next section, for the discussion.Speech activity and phonation timeSpeech activity increases for the children A, Band D between morning and afternoon and ishighest for the children B and C (Table 1).Child C has a higher activity in the morning andduring lunch, but decreases activity in the afternoon.Phonation time is in general highest forchild B, who also shows the strongest increaseover the day. The children A and D show lowestphonation time, however child A shows aclearly higher level in the afternoon. Child Chas a degree of phonation time in between withthe highest measure at lunchtime.Table 1. Degree of hoarseness, speech activity andphonation time.CHILDRecordingHoarsenessin mmVASSpeechactivityin (%)phonationtimein (%)A m 53 20.6 9.5A l 81 19.4 9.9A a 72.5 30.5 13B m 16.5 26.5 14.5B l 21 33.3 17.7B a 25.5 39.7 25.2C m 29.5 34.1 11.9C l 26 34.2 14.2C a 28.5 24.9 12.3D m 20.5 16.9 8.1D l 18.5 21.2 9.9D a 10 28.8 9.7speechactivityin%voicing in relation to speech454035302520151050R 2 = 0,63810 10 20 30phonation time in %Figure 1. Correlation between speech activity andphonation time.There is generally a good correlation betweenspeech activity and phonation time as can beseen in Figure 1. This means that both measurespoint in the same direction giving an outline towhether a child is an active speaker or not.Fundamental frequency (F0)Table 2 shows not only the results from spontaneousspeech but even measures of the meanfundamental frequency obtained from the BUGrecordingwith controlled speech.Child B produces speech on a relativelyhigh mean F0 with a large F0-range in themorning and decreases mean F0 and range overthe rest of the day. Furthermore, child B is producingspeech on a clearly higher mean F0 inspontaneous speech compared to controlledspeech.Child C presents a relatively strong increaseof mean F0 over the day, however the range isbroad in the morning and at lunch but lessbroad in the afternoon. Mean F0 is relativelyhigh for spontaneous speech compared to thecontrolled condition in the afternoon but rathermoderately higher for the other times of theday.Child D shows a moderate increase of F0and maintains a fairly stable F0-range over theday. F0-mean is higher in the morning and atlunch for spontaneous speech compared to controlledspeech, however for the afternoon recordingF0 is much higher for the controlledcondition.Table 2. Degree of hoarseness, mean fundamentalfrequency, F0-standard deviation, F0-median andmean F0 for controlled speech.CHILDand recordingHoarsenessinmmVASF0meanin [Hz]F0sd in[Hz]F0 medianin [Hz]F0 meancontrolledin [Hz]A, m 53 322 77 308 354A, l 81 331 79 325 307A, a 72.5 328 74 315 275B, m 16.5 369 100 358 266B, l 21 308 88 295 236B, a 25.5 305 85 296 236C, m 29.5 290 108 292 284C, l 26 302 110 306 285C, a 28.5 335 92 328 279D, m 20.5 312 91 298 270D, l 18.5 321 88 311 279D, a 10 332 90 318 354No clear tendency over the day can be observedfor Child A; possibly a moderate F0-increasefor lunch and a slight F0-decrease in the after-122
<strong>Proceedings</strong>, FONETIK <strong>2009</strong>, Dept. of Linguistics, Stockholm Universitynoon. Range varies little between morning andlunch and decreases somewhat in the afternoon.Even the relationship between the F0-measurements of the different conditions showsquite a discrepancy: higher F0 occurs for thecontrolled recording in the morning, but at theother two instances F0 is higher for the spontaneousrecordings, where the difference is largestin the afternoon.Child A uses in general a narrow F0-range,whereas child C shows the broadest F0-range.Speech intensityChild B produces speech with highest intensityin general and child C with lowest intensity(Table 3). Child B presents little variation inintensity at lunch and in the afternoon, which isequally high for both times of the day. Also themedian of intensity is clearly higher for lunchand in the afternoon compared to the other childrenand for all recordings higher then themean. This means that child B is producingspeech at high vocal loudness most of the time.Table 3. Degree of hoarseness, mean intensity,standard deviation and median of intensity.CHILDand recordingHoarse-ness inmm VASIntensitymeanin [dB]Intensity,sd in[dB]Intensity,medianin [dB]A, m 53 71 18 72A, l 81 72 18 75A, a 72.5 71 19 72B, m 16.5 76 23 80B, l 21 73 17 76B, a 25.5 78 17 83C, m 29.5 64 16 65C, l 26 65 17 67C, a 28.5 70 17 72D, m 20.5 72 17 77D, l 18.5 71 17 75D, a 10 70 17 72Speech intensity and background noiseIt can be seen in Table 4 that the speech intensityof the children’s speech is lower than theintensity of the background noise in most cases.However, child C, who is exposed to the highestlevel of background noise, produces speechwith the lowest intensity level. Child B, whoalso is exposed to a fairly high level of backgroundnoise on the other hand, also producesspeech at a relatively high intensity level, whichin the afternoon is even higher than the level ofbackground noise. In the case of the lowestmeasured level of background noise (70dB and71dB) the children exposed to that level producespeech either slightly stronger (child D) orat the same intensity level (child A).Table 4. Degree of hoarseness, mean backgroundnoise intensity, mean speech intensity and the differencebetween the intensity levels.CHILDand recordingHoarse-ness inmmVASBackgroundintensitymeanin [dB]Child’sspeech intensity,mean in [dB]differenceA, m 53 75 71 -4A, l 81 79 72 -7A, a 72.5 71 71 0B, m 16.5 82 76 -6B, l 21 76 73 -3B, a 25.5 73 78 5C, m 29.5 81 64 -17C, l 26 81 66 -15C, a 28.5 78 70 -8D, m 20.5 70 72 2D, l 18.5 75 71 -4D, a 10 73 71 -2DiscussionIn this section the relationship between thechildrens speech behaviour presented in the resultsand the degree of hoarseness obtainedfrom an earlier study (McAllister et al.) are discussed.As there is a good correlation betweenspeech activity and phonation time (see Figure1), these parameters will be discussed together.Hoarseness vs. speech activity andphonation timeThe child with highest increase of speech activityand phonation time over the day – child B –also shows a clear increase of hoarseness. ChildB, however is not the child with the highest degreeof hoarseness. The child with the highestdegree and increase of hoarseness – child A –does not show the highest degree of speech activityand phonation time. Child A reveals mostspeech activity and highest phonation time inthe afternoon, but highest degree of hoarsenessaround lunchtime. Child C is an active child,but does not present us with a change for theworse in terms of hoarseness. However, thischild exhibits a slightly higher degree ofhoarseness then child B. Child D shows a fairlylow level and an increase of speech activityover the day, but a decrease in hoarseness.123
<strong>Proceedings</strong>, FONETIK <strong>2009</strong>, Dept. of Linguistics, Stockholm UniversityThe parameters speech activity and phonationtime solely do therefore not give a clear explanationto vocal fatigue. However, child B,who suffers from vocal fatigue by the end of theday presents us with an amount of phonationtime comparable to what has been found forpre-school teachers (Masuda et al. 1993).Hoarseness vs. fundamental frequencyChild B presents us with particularly high meanF0 - much higher then F0 under controlled condition- and a broad F0-range in the morning,followed by an increase of hoarseness later inthe day. However, Child C with fairly high F0-increase over the day and a high F0-range is notaffected by a change of hoarseness for theworse. Child A with fairly stable mean F0 andF0-range over the day presents us with higherdegree of hoarseness after the morning recordings.Child D with comparably stable meanF0 and F0-range on the other hand improvedthe voice condition over the day.The use of high F0, a high F0-range solelydoes not seem to account for voice deterioration.Hoarseness vs. speech intensityThe child (B) producing speech at highestloudness level is the one that suffers most fromincreased voice problems later in the day.Strenuous speech production with high intensitytherefore seems to be an important parameterto take into consideration when accountingfor voice problems in children.Hoarseness vs. speech intensity andbackground noiseThe children react in a different way to the levelof background noise. Being exposed to a highlevel of background noise, one of the activechildren (B) seems to be triggered for a loudvoice use, whereas one other speech activechild (C) does not behave in the same way, butproduces a much softer voice. The child reactingwith a stronger voice (B) also responds withincreased hoarseness later in the day.As has been presented in the results, thechildren never produce speech at a loudness of9.1dB above background noise, the level thathad been found by Södersten et al. to occur forpre-school teachers. However, normalizationwith regard to microphone distance for thechildren’s speech might be a question to beconsidered, since no comparable normalisationhas been carried out for the recordings of thebackground noise.General discussionIt can be found that child B refers to a typicalchild in a risk zone who suffers from voiceproblems by the end of the day due to hazardousvoice use: being a lively child in a verynoisy environment leads to making use of aloud, strong voice with a relatively high fundamentalfrequency and a high fundamental frequencyrange, resulting in vocal fatigue at theend of the day, reflected by an increase ofhoarseness. The results for this child agree withSödersten et al. that producing high fundamentalfrequency at high vocal loudness can lead tovocal trauma.Child A on the other hand does not showany particularly unusual voice use. However thedegree of hoarseness was already very high inthe first recording made in the morning and increasesfurther in during the day. The high degreeof hoarseness could have had influence onthe calculation of different acoustic measurements,e.g. phonation time is fairly low, becausethe algorithm is not able to pick periodicalparts of speech. Even the low measure ofintensity might have been affected, since voicedsounds show stronger intensity, which might belacking due to the child’s high degree ofhoarseness. It should however be noted thatchild A does not present us with high numberof measurements on speech activity, so that alow degree of phonation time is unlikely to bebased on period picking problems. This childmight have a predisposition for a hoarse voice,or an already obtained voice problem.Child C seems to be typical for a lively childwith high speech activity (Table 1) and a broadF0-range (Table 2). On the other hand, thischild shows lowest speech intensity (Table 3)which seems to be a good prerequisite to preventvoice problems. This child presents uswith a somewhat higher degree of hoarsenessthen child B, but there is no change for worseover the day. When taking a look at how childC uses her voice, one can find out that she ishumming a lot by herself.Child D is most lively in the afternoon,where the degree of hoarseness is lowest (Table1). Obviously, this child is seems to need towarm up the voice during the day, which resultsin highest activity later in the day combinedwith best voice condition.124
<strong>Proceedings</strong>, FONETIK <strong>2009</strong>, Dept. of Linguistics, Stockholm UniversityIn summary, the children behave in a differentway. Being an active child in a noisy environmentcan lead to a high level of speech activityand phonation time, and high F0 and F0range. However, increase of hoarseness ratherseems to occur if speech is produced with highintensity on top of high level measures of theother parameters. The child reacting with alouder voice also responds with increasedhoarseness later in the day. As has been shownabove, another speech active child’s voice hasnot been affected in the same direction as itproduces speech at a much weaker intensity.Sala, E., Airo, E., Olkinuora, P., Simberg, S.,Ström, U., Laine, A., Pentti, J. & Suonpää,J. (2002) Vocal loading among day carecenter teachers. Logopedics Phoniatrics Vocology.;27:21-28.Södersten, M., Granqvist, S., Hammarberg, B.,and Szabo, A. (2002). Vocal behavior andvocal loading factors for preschool teachersat work studied with binaural DAT recordings.Journal of Voice, 16(3), 356–371.ConclusionsA lively child with high speech activity in anoisy environment feeling the need to competewith the background noise by producing loudspeech is at risk to suffer from vocal fatigue. Anequally lively child without the need to makeher/himself heard in en equally noisy environmentprevents a child from a similar outcome.Putting a high vocal load on the voice by producingspeech at a high intensity level is thereforelikely to be the key-parameter leading to araised level of hoarseness. A child with a predispositionfor hoarseness seems to be at risk tosuffer from even stronger hoarseness later in theday even if there are no signs for extreme use ofthe voice.ReferencesFritzell, B. (1996). Voice disorders and occupations.Logopedics Phoniatrics Vocology, 21,7-21.Granqvist, S. (2001). The self-to-other ratio appliedas a phonation detector. Paper presentedat: The IV Pan European Voice Conference,Stockholm August 2001.Masuda, T., Ikeda, Y., Manako, H., and Komiyama,S. (1993). Analysis of vocal abuse:fluctuations in phonation time and intensityin 4 groups of speakers, Acta Oto-Laryngol.113(4), 547–552.McAllister, A., Granqvist, S., Sjölander, P.,Sundberg, J. 2008 (in press) Child voiceand noise, A pilot study of noise in day caresand the effects on 10 childrens’ voicequality according to perceptual evaluation.Journal of Voicedoi:10.1016/j.jvoice.2007.10.017Ohlsson, A.-C. (1988). Voice and Working Environments.Gothenburg: Gothenburg University(doctoral dissertation).125
<strong>Proceedings</strong>, FOETIK <strong>2009</strong>, Dept. of Linguistics, Stockholm UniversityMajor parts-of-speech in child language – division inopen and close class wordsE. Klintfors, F. Lacerda and U. SundbergDepartment of Linguistics, Stockholm University, StockholmAbstractThe purpose of this study was to assess relationsbetween major parts-of-speech in 14-to43-months-old infants. Therefore a division inopen class and close class words was made.Open class words consist of nouns, verbs andadjectives, while the group of close class wordsis mainly constituted of grammatical wordssuch as conjunctions, prepositions and adverbs.The data was collected using the Swedish EarlyCommunicative Development Inventory, a versionof the MacArthur Communicative DevelopmentInventory. The number of open andclose class words was estimated by summarizingitems from diverse semantic categories. Thestudy was performed as a mixture of longitudinaland cross-sectional data based on 28completed forms. The results showed that whilethe total number of items in the children’s vocabulariesgrew as the child got older; the proportionaldivision in open vs. close class words– proximally 90-10% – was unchanged.IntroductionThis study is performed within the multidisciplinaryresearch project: Modeling InteractiveLanguage Learning 1 (MILLE, supported by theBank of Sweden Tercentenary Foundation). Thegoal of the project is to study how general purposemechanisms may lead to emergence oflinguistic structure (e.g. words) under the pressureof exposure to the ambient language. Thehuman subject part of the project use data frominfant speech perception and production experimentsand from adult-infant interaction. Thenon-human animal part of the project use datafrom gerbil discrimination and generalizationexperiments on natural speech stimuli. And finally,within the modeling part of the project1 A collaboration between Department of Linguistics,Stockholm University (SU, Sweden), Department of Psychology,Carnegie Mellon University (CMU, USA), andDepartment of Speech, Music and Hearing, Royal Instituteof Technology (KTH, Sweden).mathematical models simulating infants’ andanimals’ performances are implemented. Inthese models the balance between variance inthe input and the formation of phonologicallikecategories under the pressure of differentamounts of available memory representationspace are of interest.The aim of the current study is to explorethe major parts-of-speech in child language.Therefore an analysis of questionnaire databased on parental reports of their infants’ communicativeskills regarding open and close classwords was carried out.BackgroundThe partition in words that belong to the socalled open class and those that belong to closeclass is a basic division in major parts-ofspeech.The open class is “open” in the sensethat there is no upper limit for how many unitsthe class may contain, while the close class hasrelatively few members. The open and closeclass words also tend to have different functionsin the language: the open class words oftencarry contents, while the close class wordsmodify the relations of the semantically loadedcontent words.Why would children pay attention to openclass words? Children, as well as adults, lookfor meaning in what they see and hear. Therefore,the areas of interest and the cognitive developmentof the child are naturally factors thatconstrain what is learned first. Close classwords seldom refer to something concrete thatcan be pointed out in the physical world in theway open class words do (Strömqvist, 2003).Also, close class words are not expected to belearned until the child has reached certaingrammatical maturity (Håkansson, 1998). Perceptualprominence and frequency are otherfactors that influence what is learned first(Strömqvist, 1997). Prosodic features such aslength and stress make some content wordsmore salient than others. Also, if a word occurs126
<strong>Proceedings</strong>, FOETIK <strong>2009</strong>, Dept. of Linguistics, Stockholm Universitymore often in the language input of the child, itis easier to recognize.Estimations of children’s use of open vs.close class words may be based on appreciationsof types and occurrences. For example, ina longitudinal study on four Swedish childrenand their parents it was shown that the 20 mostfrequent types of words stand for approximately35-45% of all the word occurrences in childlanguage, as well as in adult’s speech directedtowards children (Strömqvist, 1997). And evenmore notably, there were almost none openclass words among these 20 most frequentwords in child language or in child-directedspeech (CDS) in the Swedish material. On thecontrary, close class words such as de, du, va, e,ja, den, å, så constituted the most commonword forms. These word forms were most oftenunstressed and phonologically/phonetically reduced(e.g. the words were monosyllabic, andthe vowels were centralized). Nevertheless, itshould be mentioned that the transcriptionsused were not disambiguated in the sense thatone sound might stand for much more than thechild is able to articulate. For example, the frequente might be generalized to signify är (eng.is), det (eng. it/that), ner (eng. down) etc.In the current study, the questionnairesbased on parental reports prompted for wordstypes produced by the child. The use of wordswas differentiated by whether the word in questionwas used “occasionally” or “often” by thechild, but no estimations of number of wordoccurrences were made. Therefore the materialsused in the current study allow only forcomparison of types of words used.Based on the earlier study by Strömqvist weshould thus expect our data to show large andmaybe growing proportion of close class words.For example, the proportion of open vs. closeclass words measured at three different timepoints, corresponding to growing vocabularysizes, could progress as follows: 90-10%, 80-20%, 70-30% etc. But on the other hand, thetypically limited amount of close class words inlanguages should be reflected in the sample andtherefore our data should – irrespective of thechild’s vocabulary size – reveal large and stableproportion of open class words as compared toclose class words, measured at different timepoints corresponding to growing vocabularysizes (e.g. 90-10%, 90-10%, 90-10% etc.).Eriksson and Berglund (1995) indicate thatSECDI can to certain to extent to be used forscreening purposes to detect and follow upchildren who show tendencies of delayed oratypical language development. The currentstudy is a step in the direction for finding referencedata for typical development of open vs.close class words. Atypical development ofclose class words might thus give informationon potentially deviant grammatical development.MethodThe Swedish Early Communicative DevelopmentInventory (SECDI) based on parental reportsexists in two versions, one version onwords & gestures for 8-to 16-months-old childrenand the other version on words & sentencesfor 16-to-28-months-old children. In this studythe latter version, divided in checklists of 711words belonging to 21 semantic categories, wasused. The inventory may be used to estimatereceptive and productive vocabulary, use ofgestures and grammar, maximal length of utterance,as well as pragmatic abilities (Eriksson &Berglund, 1995).SubjectsThe subjects were 24 Swedish children (13girls, and 11 boys, age range 6.1- to 20.6-months by the start point of the project) randomlyselected from the National Swedish addressregister (SPAR). Swedish was the primarylanguage spoken in all the families with the exceptionof two mothers who primarily spokeFrench and Russian respectively. The parents ofthe subjects were not paid to participate in thestudy. Children who only participated duringthe first part of the collection of longitudinaldata (they had only filled in the version ofSECDI for 8-to 16-months-old children) wereexcluded from the current study resulting in 28completed forms filled by 17 children (10 girls,7 boys, age range 14- to 43-months at the timepoint of data collection). The data collected wasa mixture of longitudinal and cross-sectionaldata as follows: 1 child completed 4 forms, 1child completed 3 forms, 6 children completed2 forms, and 9 children completed 1 form.MaterialsTo estimate the number of open class words thesections through A2 to A12, as well as A14 andA15 were included. The semantic categories ofthese sections are listed in Table 1. Section A1-Sound effects/animal sounds (e.g. mjau) andA13-Games/routines (e.g. god natt, eng. goodnight) were not considered as representative127
<strong>Proceedings</strong>, FOETIK <strong>2009</strong>, Dept. of Linguistics, Stockholm Universityopen class words and were therefore excludedfrom the analysis. The sections A16-A21 constitutedthe group of close class words belongingto the semantic categories listed in Table 2.Table 1. The semantic categories included for estimationof number of open class words.Section Semantic category Examples of wordsA2 Animals (real/toys) anka (eng. duck)A3 Vehicles (real/toys) bil (eng. car)A4 Toys boll (eng. ball)A5 Food and beverage apelsin (eng. orange)A6 Clothes jacka (eng. jacket)A7 Body parts mun (eng. mouth)A8 Small objects/things blomma (eng. flower)A9 Furniture and rooms badkar (eng. bathtub)A10 Objects outdoors gata (eng. street)A11 Places to go affär (eng. store)A12 People flicka (eng. girl)A14 Actions arbeta (eng. work)A15 Adjectives arg (eng. angry)Table 2. The semantic categories included for estimationof number of close class words.Section Semantic category Examples of wordsA16 Pronouns de (eng. they)A17 Time expressions dag (eng. day)A18 Prepositions/location bakom (eng. behind)A19 Amount and articles alla (eng. everybody)A20 Auxiliary verbs ha (eng. have)A21 Connectors/questions och (eng. and)ProcedureThe materials were collected 2004-2007 bymembers of the Development group, Phoneticlaboratory, Stockholm University. The subjectsand their parents visited the lab approximatelyonce/month. Each visit started off with an eyetrackingsession to explore specific speech perceptionresearch questions, and then a videorecording (app. 15-20 minutes) of adult-infantinteraction was made. Towards the end of thevisit, one of the experimenters entered the studioand filled the questionnaire based on parentalinformation while the parent was playingwith the child. Occasionally, if the parent had toleave the lab immediately after the recordingsession, she/he returned the questionnaire to thelab within about one week (Klintfors, Lacerda,Sundberg, 2007).ResultsThe results based on 28 completed formsshowed that the child with the smallest vocabulary(4 open class words) had yet not started touse words from close class. The child who producedthe most of the open class words (564open class words) had developed her/his use ofclose class words into 109 close class words.Figure 1. Total number of open class and closeclass words produced per each completed form.Number of open class words (the light line) andclose class words (the dark line) – shown on they-axis are plotted for each completed form –listed on the x-axis.When a child knows approximately 100 openclass words, she/he knows about 10 close classwords – in other words the close class wordsconstitute 10% of the total vocabulary (Figure1). And further, when a child knows about 300open class words, she/he knows about 35 closewords – that is the close class words constitute12% of the total vocabulary. And finally, whena child knows approximately 600 open classwords, she/he knows about 100 close classwords corresponding to 17% of the total vocabulary.DiscussionThe results showed that children’s vocabulariesinitially contain proportionally more open classwords as compared to close class words. Thereafter,the larger the vocabulary size, the biggerproportion of it is devoted for close classwords. The proportion of open vs. close classwords corresponding to total vocabulary size of100, 300, and 600 words, was as follows: 90-10%, 88-12%, 83-17%.Children might pay more attention to openclass words since content words are typicallystressed and more prominent (e.g. the vowelspace of content words is expanded) in CDS(Kuhl et al., 1997; van de Weijer, 1998). Fur-128
<strong>Proceedings</strong>, FOETIK <strong>2009</strong>, Dept. of Linguistics, Stockholm Universityther, the open class words often refer to concreteobjects in the physical world and mighttherefore be learned earlier (Gentner & Boroditsky,2001). Nor are children expected to useclose class words until they have reached certaingrammatical maturity (Håkansson, 1998).The youngest subjects in the current studywere 1.2-years old and some of the forms completedearly on – with vocabularies < 50 words– did not contain any close class words. Shortlythereafter – for vocabularies > 50 words, all thechildren can be assumed to have reachedgrammatical maturity. The current study doesthus not reveal the exact time point for startingto use close class words. Nevertheless, the agegroup of the current study ranged between 1.2-years to 3.6-years and likely captured the timepoint for onset of word spurt. The onset ofword spurt has been documented to take placesometime between the end of the first and theend of the third year of life (Bates et al., 1994).Therefore, the proportional increase of closeclass words being almost twice as large (17%)for vocabulary size of 300 to 600 words, ascompared to vocabulary size from 100 to 300words (10%) is not surprising.One reason for expecting close class wordsto later enter the children’s vocabularies is thatchildren might have more difficult to understandthe abstract meaning of close class words.But closer inspection of the results shows thatchildren start to use close class words althoughthe size of their vocabularies is still relativelysmall. For example, one of the subjects showedat one occasion to have one close class wordand five open class words. But a question to beasked next is how close class words are used inchild language. That is, has the child understoodthe abstract functions of the words used? Itis reasonable that children use close class wordsto express other functions than the originalfunction of the word in question. For example,the word upp (eng. up) might not be the understoodas the abstract content of the prepositionup, but instead used to refer to the action lyftmig upp (eng. lift med up). Using the particle ofa verb and omitting the verb referring to the actionis typical in child language (Håkansson,1998). Thus, the close class words are oftenphonotactically less complex (compare upp tolyfta) and therefore likely more available for thechild. But the use of the word per se does notindicate that the child has understood thegrammatical role of the close class words in thelanguage. The close class words used by the 14-to 43-month-old children in the current studywere Pronouns, Time expressions, prepositions/wordsfor spatial locations, word forAmount and articles, Auxiliary verbs, Connectorsand question words. It may thus be speculatedthat the children in the current study havestarted to perceive and explore the grammaticalstatus of the close class words.AcknowledgementsResearch supported by The Bank of SwedenTercentenary Foundation, and European Commission.We thank Ingrid Broomé, AndreaDahlman, Liz Hultby, Ingrid Rådholm, andAmanda Thorell for data analysis within theirB-level term paper in Logopedics.ReferencesBates, e., Marchman, V., Thal, D., Fenson, L.,Dale, P., Reilly, J., Hartung, J. (1994) Developmentaland stylistic variation in the compositionof early vocabulary. Journal ofChild Language 21, 85-123.Eriksson, M. and Berglund, E. (1995) Instruments,scoring manual and percentile levelsof the Swedish Early Communicative DevelopmentInventory, SECDI, FoUnämnden.Högskolan i Gävle.Gentner, D. and Boroditsky, L. (2001) Individuation,relativity, and early word learning.In Bowerman, M. and Levinson, S. (eds)Language acquisition and conceptual development,215-256. Cambridge UniversityPress, UK.Håkansson, G. (1998). Språkinlärning hos barn.Studentlitteratur.Klintfors, E., Lacerda, F., and Sundberg, U.(2007) Estimates of Infants’ vocabularycomposition and the role of adultinstructionsfor early word-learning.<strong>Proceedings</strong> of <strong>Fonetik</strong> 2007, TMH-QPSR(Stockholm, Sweden) 50, 69-72.Kuhl, K. P., Andruski, J. E., Chistovich, I. A,Chistovich, L. A., Kozhevnikova, E. V.,Ryskina V. L., Stolyarova, E. I., Sundberg,U. and Lacerda, F. (1997) Cross-languageanalysis of phonetic units in language addressedto infants. Science, 277, 684-686.Strömqvist, S. (1997) Om tidig morfologiskutveckling. In Söderberg, R. (ed) Från jollertill läsning och skrivning, 61-80. Gleerups.Strömqvist, S. (2003) Barns tidigaspråkutveckling. In Bjar, L. and Liberg, S.(eds) Barn utvecklar sitt språk, 57-77.Studentlitteratur.Weijer, J. van de (1998) Language input forword discovery. Ph.D thesis. Max PlanckSeries in Psycholinguistics 9.129
<strong>Proceedings</strong>, FOETIK <strong>2009</strong>, Dept. of Linguistics, Stockholm UniversityLanguage-specific speech perception as mismatchnegativity in 10-month-olds’ ERP dataIris-Corinna Schwarz 1 , Malin Forsén 2 , Linnea Johansson 2 , Catarina Lång 2 , Anna Narel 2 , TanyaValdés 2 , and Francisco Lacerda 11 Department of Linguistics, Stockholm University2 Department of Clinical Science, Intervention, and Technology, Speech Pathology Division,Karolinska Institutet, StockholmAbstractDiscrimination of native and nonnative speechcontrasts, the heart of the concept of languagespecificspeech perception, is sensitive to developmentalchange in speech perception duringinfancy. Using the mismatch negativityparadigm, seven Swedish language environment10-month-olds were tested on their perceptionof six different consonantal and tonalThai speech contrasts, native and nonnative tothe infants. Infant brain activation in responseto the speech contrasts was measured withevent-related potentials (ERPs). They showmismatch negativity at 300 ms, significant forcontrast change in the native condition, but notfor contrast change in the nonnative condition.Differences in native and nonnative speech discriminationare clearly reflected in the ERPsand confirm earlier findings obtained by behaviouraltechniques. ERP measurement thussuitably complements infant speech discriminationresearch.IntroductionSpeech perception bootstraps language acquisitionand forms the basis for later language development.During the first six months of life,infants are ‘citizens of the world’ (Kuhl, 2004)and perform well in both nonnative and nativespeech discrimination tasks (Burnham, Tyler, &Horlyck, 2002).For example, 6-month-old English andGerman infants tested on a German, but notEnglish contrast [dut]-[dyt], and an English, butnot German contrast [dɛt]-[dæt], discriminatedboth contrasts equally well (Polka & Bohn,1996). Around the age of six months, a perceptualshift occurs in favour of the native language,earlier for vowels than for consonants(Polka & Werker, 1994). Around that time infants’nonnative speech discrimination performancestarts to decline (Werker & Lalonde,1988), while they continue to build their nativelanguage skills (Kuhl, Williams, Lacerda, Stevens,& Lindblom, 1992). For example, 10- to12-month-old Canadian English environmentinfants could neither discriminate the nonnativeHindi contrast [ʈɑ]-[tɑ] nor the nonnativeThompson 1 contrast [ki]-[qi] whereas their 6- to8-month-old counterparts still could (Werker &Tees, 1984).This specialisation in the native languageholds around six months of age even on a supra-segmentallanguage level: American Englishlanguage environment infants younger thansix months are equally sensitive to all stresspatterns of words, and do not only prefer theones predominantly present in their native languageas infants older than six months do(Jusczyk, Cutler, & Redanz, 1993).During the first year of life, infants’ speechperception changes from language-general tolanguage-specific in several features. Adults arealready so specialised in their native languagethat their ability to discriminate nonnativespeech contrasts is greatly diminished and canonly partially be retrained (Tees & Werker,1984; Werker & Tees, 1999, 2002). By contrastingnative and nonnative discriminationperformance the degree of language-specificityin speech perception is shown and developmentalchange can be described (Burnham, 2003).In the presence of experience with the nativelanguage, language-specific speech perceptionrefines, whereas in the absence of experiencenonnative speech perception declines. Thisstudy focuses on 10-month-olds whose speechperception is language-specific.A common behavioural paradigm used totest discrimination abilities in infants youngerthan one year is the conditioned head-turnmethod (e.g., Polka, Colantonio, & Sundara,2001). This method requires the infant to beable to sit on the parent’s lap and to controlhead movement. Prior to the experimental test130
<strong>Proceedings</strong>, FOETIK <strong>2009</strong>, Dept. of Linguistics, Stockholm Universityphase, a training phase needs to be incorporatedinto the experiment to build up the associationbetween perceived changes in contrast presentationand reward display in the infants. Thenumber of trials that it takes the infant to reachcriterion during training significantly reducesthe possible number of later test trials since thetotal test time of 10 min maximum remains invariantin infants.Can electroencephalography (EEG) measurementprovide a physiological correlate to thebehavioural discrimination results? The answeris yes. Brain activation waves in response tostimulus presentation are called event-relatedpotentials (ERPs) and often show a stimulustypicalcurve (Teplan, 2002). This can be forexample a negativity response in the ERP,called mismatch negativity (MMN), reflectingstimulus change in a series of auditory signals(Näätänen, 2000). MMN reflects automaticchange detection processes on neural level(Kushnerenko, Ceponiene, Balan, Fellman, &Näätänen, 2002). It is also used in neonate testingas it is the earliest cognitive ERP componentmeasurable (Näätänen, 2000). The generaladvantage of using ERPs in infant research liesexactly within in the automaticity of these processesthat does neither demand attention nortraining (Cheour, Leppänen, & Kraus, 2000).For example, mismatch negativity represents6-month-olds’ discrimination of consonantduration changes in Finnish non-sensewords (Leppänen et al., 2002). Similarly, differencesin the stress patterns of familiar wordsare reflected in the ERPs of German and French4-month-olds (Friederici, Friedrich, & Christophe,2007). This reveals early language-specificspeech perception at least in suprasegmentalaspects of language.How infant language development fromlanguage-general to language-specific discriminationof speech contrasts can be mapped ontoneural response patterns was demonstrated in astudy with 7- and 11-month-old American Englishenvironment infants (Rivera-Gaxiola,Silva-Pereya, & Kuhl, 2005). The infants couldbe classed into different ERP patterns groups,showing not only negativity at discriminationbut also positive differences. Discrimination ofSpanish voice-onset time (VOT) differenceswas present in the 7-month-olds but not in the11-month-olds (Rivera-Gaxiola et al., 2005).HypothesisIf ERPs and especially mismatch negativity areconfirmed by the current study as physiologicalcorrelates to behavioural infant speech discriminationdata, 10-month-old Swedish languageenvironment children would discriminatenative, but not nonnative contrast changes, asthey should perceive speech in a languagespecificmanner at this stage of their development.MethodParticipantsSeven 10-month-old infants (four girls andthree boys) participated in the study. Their averageage was ten months and one week, withan age range of ten to eleven months. The participants’contact details were obtained from thegovernmental residence address registry. Familieswith 10-month-old children who live inGreater Stockholm were randomly chosen andinvited to participate via mail. They expressedtheir interest in the study by returning a form onthe basis of which the appointment was bookedover the phone. All children were growing upin a monolingual Swedish-speaking environment.As reward for participation, all familiesreceived certificates with a photo of the infantwearing the EEG net.StimuliSpeech stimuli were in combination with thevowel /a/ the Thai bilabial stops /b̬ /, /b/, and/p h / and the dental/alveolar plosives /d̬ /, /d/, and/t h / in mid-level tone (0), as well as the velarplosive [ka] in low (1), high falling (2), and lowrising (4) tone. Thai distinguishes three voicinglevels. In the example of the bilabial stops thismeans that /b̬ / has a VOT of -97 ms, /b/ of 6 msand /p h / of 64 ms (Burnham, Francis, & Webster,1996). Out of these three stimulus setscontrast pairs were selected that can be contrastive(native) or not contrastive (nonnative) inSwedish. The consonantal contrasts [ba]-[p h a]and [da]-[t h a] are contrastive in Thai and inSwedish, whereas the consonantal contrasts[b̬ a]-[ba] and [d̬ a]-[da] are only contrastive inThai.Both consonantal contrasts were mid-toneexemplars but the third set of contrasts was tonal.It presents the change between high fallingand low rising tone in the contrast [ka2]-[ka4]131
<strong>Proceedings</strong>, FOETIK <strong>2009</strong>, Dept. of Linguistics, Stockholm Universityand between low and low rising tone in the contrast[ka1]-[ka4]. Although the two tonal contrastsmust be considered nonnative to Swedishinfants, non-Thai listeners in general seem torely on complex acoustic variables when tryingto discriminate tone (Burnham et al., 1996),which therefore makes it difficult to predict thediscrimination of tonal contrast change.After recording, all speech stimuli were presentedto an expert panel consisting of two Thainative speakers and one trained phonetician inorder to select the three best exemplars perstimulus type out of ten (see Table 1 for variationof utterance duration between the selectedexemplars).Table 1. The table shows utterance duration in msfor all selected exemplars per stimulus type andaverage duration in ms per stimulus type (Thai toneis demarcated by number).b̬ a0 ba0 p h a0 da0 d̬ a0 ta h 0 ka1 ka2 ka41 606 576 667 632 533 607 613 550 5352 626 525 646 634 484 528 558 502 5383 629 534 629 599 508 585 593 425 502M 620 545 647 622 508 573 588 492 525Within each trial, the first contrast of each pairwas repeated two to five times until the secondcontrast was presented twice after a brief interstimulusinterval of 300 ms. Each stimulus type(native consonantal, nonnative consonantal,nonnative tonal) was presented twelve timeswithin a block. Within each block, there were36 change trials and nine no-change trials. Achange trial repeated identical exemplars for thefirst contrast and then presented the identicalexemplar of the second contrast twice. A nochangetrial had identical first and secondsound exemplars, presented randomly betweenfour and seven times. A completed experimentconsisted of three blocks à 145 trials.EquipmentThe EEG recordings took place in a radiationinsulatednear-soundproof test chamber at thePhonetics Lab at Stockholm University.Infant brain activation was measured byEGI Geodesic Hydrocel GSN Sensor nets with124 electrodes on the infant net sizes. These nettypes permit EEG measurement without requiringgel application which makes them particularlycompatible with infant research; potassiumchloride and generic baby shampoo serveas conductive lubricants instead. All electrodeimpedances were kept below 50 kΩ at measurementonset. All EEG channel data was amplifiedwith an EGI NetAmps 300 amplifier andrecorded with a sampling rate of one sampleevery 4 ms. The program Netstation 4.2.1 wasused to record and analyse the ERPs.The stimuli were presented with KOSSloudspeakers, mounted at a distance of about100 cm in front of the child. The volume wasset to 55 dB at the source. The experiment wasprogrammed and controlled by the e-prime 1.2software.ProcedureAll infant participants were seated in their parent’slap, facing a TV screen on which silencedshort cartoon movie clips played during the experimentto entertain the infants and keep themas motionless as possible. The infants werepermitted to eat, breastfeed, sleep, as well assuck on dummies or other objects during stimulusexposure.Dependent on the randomisation of the firstcontrast between two and five repetitions, theduration of the entire experiment varied between10 and 13 min. Infant and parent behaviourwas monitored through an observer windowand the experiment was aborted in the caseof increasing infant fussiness - this happened inone case after 8 min of stimulus exposure.Data treatmentThe EEG recordings were filtered with a bandpassfilter of 0.3 to 50 Hz and clipped into 1000ms windows starting at the onset of the secondcontrast. These windows were then cleanedfrom all 10 ms segments during which the ERPcurve changed faster than 200 µV to removemeasurement artefacts caused by body movementand eye blinks. If more than 80% of thesegments of one single electrode were markedas artefacts, the entire data from that electrodewas not included in the average.ResultsIn accordance with other infant speech perceptionERP studies (e.g., Friederici et al., 2007),the international 10-20 electrode system wasselected to structure the EEG data. Within thissystem, the analysis focused on electrode T3,situated at the temporal lobe in the left hemisphere,as MMN in 8-month-old infants haspreviously been found to be largest in T3 (Panget al., 1998).132
<strong>Proceedings</strong>, FOETIK <strong>2009</strong>, Dept. of Linguistics, Stockholm UniversityComparing native and nonnative consonantalcontrast change trials, the curve for [ba]-[p h a] and [da]-[t h a] that are contrastive both inThai and in Swedish shows a dip between 200and 350 ms (Figure 1).µVFigure 1. The graph compares the ERPs for the nativeand nonnative consonantal contrast change trialsduring 1000 ms after stimulus onset of the secondcontrast. The ERP for the native conditionshows mismatch negativity in µV between 200 and350 ms, typical for the discrimination of auditorychange. The ERP for the nonnative condition howeveronly shows a stable continuation of the curve.This negativity response is mismatch negativityand at the same time a sign that the 10-montholdsdiscriminated the contrast change. It peaksat 332 ms with -6.3 µV.µVFigure 2. The graph shows the ERPs for the nonnativetonal change and no-change trials in µV during1000 ms after stimulus onset of the second contrast(which is of course identical to the first in the nochangecondition). No mismatch negativity can beobserved in either condition.msmsHowever, the curve for [b̬ a]-[ba] and [d̬ a]-[da]that are contrastive in Thai, but not in Swedish,shows no negativity response. The infants werenot able to detect the contrast change in thenonnative consonantal condition, as the flatgraph indicates. The two curves differ significantlybetween 200 and 350 ms (p
<strong>Proceedings</strong>, FOETIK <strong>2009</strong>, Dept. of Linguistics, Stockholm University10-month-old infants, further studies with infantsyounger than six months are necessaryand currently under way to provide the requireddevelopmental comparison.MMN was strongest in the nonnative consonantalchange condition in this study. Eventhough the tonal stimuli are generally very interestingfor infants and potentially not processedthe same way as speech, the absence ofclear mismatch negativity shows that the 10-month-olds’ brains did not react in the sameway to change in tones as they did to change inconsonants in the native condition. Furthermore,repetition of the same tone elicited higherabsolute activation than change in a series oftonal speech sounds.Interestingly, MMN is in this study the onlyresponse pattern to a detected change in a seriesof speech sounds. Rivera-Gaxiola and colleagueshad found subgroups with positive ornegative ERP discrimination curves in 11-month-olds (2005), whereas MMN is a strongand stable indicator of discrimination in ourparticipants. And this is the case even withvarying repetition distribution of the first contrasttaking up between 50 % and 70 % of atrial (corresponding to two to five times) incomparison to the fixed presentation of the secondcontrast (two times). Leppänen and colleagues(2002) presented the standard stimuluswith 80% and each of their two deviant stimuluswith 10 % probability with a 610 ms interstimulusinterval observe MMN in 6-montholds.The MMN effect is therefore quite robustto changes in trial setup, at least in 10-montholds.ConclusionsThe ERP component mismatch negativity(MMN) is a reliable sign for the detection ofchange in a series of speech sounds in 10-month-old Swedish language environment infants.For the consonantal contrasts, the infants’neural response shows discrimination for native,but not nonnative contrasts. Neither do theinfants indicate discrimination of the nonnativetonal contrasts. This confirms previous findings(Rivera-Gaxiola et al., 2005) and providesphysiological evidence for language-specificspeech perception in 10 month-olds.AcknowledgementsThis study is the joint effort of the language developmentresearch group at the Phonetics Labat Stockholm University and was funded by theSwedish Research Council (VR 421-2007-6400), the Knut and Alice Wallenberg Foundation(Grant no. KAW 2005.0115), and the Bankof Sweden Tercentenary Foundation (MILLE,RJ K2003-0867), the contribution of all ofwhich we acknowledge gratefully. We wouldalso like to thank all participating families:without your interest and dedication, our researchwould not be possible.Footnotes1 Thompson is an Interior Salish (ative Indian)language spoken in south central BritishColumbia. In native terms, it is calledthlakampx or Inslekepmx. The example contrastdiffers in place of articulation.ReferencesBurnham, D. (2003). Language specific speechperception and the onset of reading. Readingand Writing: An Interdisciplinary Journal,16(6), 573-609.Burnham, D., Francis, E., & Webster, D.(1996). The development of tone perception:Cross-linguistic aspects and the effect oflinguistic context. Paper presented at thePan-Asiatic Linguistics: Fourth InternationalSymposium on Language and Linguistics,Vol. 1: Language and Related Sciences,Institute of Language and Culture forRural Development, Mahidol University,Salaya, Thailand.Burnham, D., Tyler, M., & Horlyck, S. (2002).Periods of speech perception developmentand their vestiges in adulthood. In P. Burmeister,T. Piske & A. Rohde (Eds.), An integratedview of language development:Papers in honor of Henning Wode (pp. 281-300). Trier: Wissenschaftlicher Verlag.Cheour, M., Leppänen, P. H. T., & Kraus, N.(2000). Mismatch negativity (MMN) as atool for investigating auditory discriminationand sensory memory in infants andchildren. Clinical europhysiology, 111(1),4-16.Friederici, A. D., Friedrich, M., & Christophe,A. (2007). Brain responses in 4-month-oldinfants are already language-specific. CurrentBiology, 17(14), 1208-1211.134
<strong>Proceedings</strong>, FOETIK <strong>2009</strong>, Dept. of Linguistics, Stockholm UniversityJusczyk, P. W., Cutler, A., & Redanz, N. J.(1993). Infants' preference for the predominantstress patterns of English words. ChildDevelopment, 64(3), 675-687.Kuhl, P. K. (2004). Early language acquisition:Cracking the speech code. ature Reviews:euroscience, 5(11), 831-843.Kuhl, P. K., Williams, K. A., Lacerda, F., Stevens,K. N., & Lindblom, B. (1992). Linguisticexperience alters phonetic perceptionin infants by 6 months of age. Science,255(5044), 606-608.Kushnerenko, E., Ceponiene, R., Balan, P.,Fellman, V., & Näätänen, R. (2002). Maturationof the auditory change detection responsein infants: A longitudinal ERP study.euroReport, 13(15), 1843-1848.Leppänen, P. H. T., Richardson, U., Pihko, E.,Eklund, K., Guttorm, T. K., Aro, M., et al.(2002). Brain responses to changes inspeech sound durations differ between infantswith and without familial risk for dyslexia.Developmental europsychology,22(1), 407-422.Näätänen, R. (2000). Mismatch negativity(MMN): perspectives for application. InternationalJournal of Psychophysiology,37(1), 3-10.Pang, E. W., Edmonds, G. E., Desjardins, R.,Khan, S. C., Trainor, L. J., & Taylor, M. J.(1998). Mismatch negativity to speechstimuli in 8-month-olds and adults. InternationalJournal of Psychophysiology, 29(2),227-236.Polka, L., & Bohn, O.-S. (1996). A crosslanguagecomparison of vowel perception inEnglish-learning and German-learning infants.Journal of the Acoustical Society ofAmerica, 100(1), 577-592.Polka, L., Colantonio, C., & Sundara, M.(2001). A cross-language comparison of /d/-/th/ perception: Evidence for a new developmentalpattern. Journal of the AcousticalSociety of America, 109(5 Pt 1), 2190-2201.Polka, L., & Werker, J. F. (1994). Developmentalchanges in perception of nonnativevowel contrasts. Journal of ExperimentalPsychology: Human Perception and Performance,20(2), 421-435.Rivera-Gaxiola, M. C. A., Silva-Pereya, J., &Kuhl, P. K. (2005). Brain potentials to nativeand non-native speech contrasts in 7-and 11-month-old American infants. DevelopmentalScience, 8(2), 162-172.Tees, R. C., & Werker, J. F. (1984). Perceptualflexibility: Maintenance or recovery of theability to discriminate non-native speechsounds. Canadian Journal of Psychology,38(4), 579-590.Teplan, M. (2002). Fundamentals of EEGmeasurement. Measurement Science Review,2(2), 1-11.Werker, J. F., & Lalonde, C. E. (1988). Crosslanguagespeech perception: Initial capabilitiesand developmental change. DevelopmentalPsychology, 24(5), 672-683.Werker, J. F., & Tees, R. C. (1984). Crosslanguagespeech perception: Evidence forperceptual reorganization during the firstyear of life. Infant Behavior and Development,7, 49-63.Werker, J. F., & Tees, R. C. (1999). Influenceson infant speech processing: Toward a newsynthesis. Annual Review of Psychology, 50,509-535.Werker, J. F., & Tees, R. C. (2002). Crosslanguagespeech perception: Evidence forperceptual reorganization during the firstyear of life. Infant Behavior and Development,25, 121-133.135
<strong>Proceedings</strong>, FONETIK <strong>2009</strong>, Dept. of Linguistics, Stockholm UniversityDevelopment of self-voice recognition in childrenSofia StrömbergssonDepartment of Speech, Music and Hearing, School of Computer Science and Communication, KTH,StockholmAbstractThe ability to recognize the recorded voice asone’s own was explored in two groups of children,one aged 4-5 and the other aged 7-8. Thetask for the children was to identify which oneof four voice samples represented their ownvoice. The results indicate that 4 to 5 year-oldchildren perform as well as 7 to 8 year-oldchildren when identifying their own recordedvoice. Moreover, a time span of 1-2 weeks betweenrecording and identification does not affectthe younger children’s performance, whilethe older children perform significantly worseafter this time span. Implications for the use ofrecordings in speech and language therapy arediscussed.IntroductionTo many people, the recorded voice oftensounds unfamiliar. We are used to hearing ourvoice through air and bone conduction simultaneouslyas we speak, and as the recordedspeech lacks the bone conduction filtering, itsacoustic properties are different from what weare used to (Maurer & Landis, 1990). But eventhough people recognize that the recordedvoice sounds different from the voice as wenormally hear it, people most often still recognizethe recording as their own voice. In a recentstudy on brain hemisphere lateralization ofself-voice recognition in adult subjects (Rosa etal, 2008), a mean accuracy of 95% showed thatadults rarely mistake their own recorded voicefor someone else’s voice.Although there have been a few studies onadult’s perception of their own recorded voice,children’s self-perception of their recordedvoices is relatively unexplored. Some studieshave been made of children’s ability to recognizeother familiar and unfamiliar voices. Forexample, it has been reported that children’sability to recognize previously unfamiliarvoices improves with age, and does not approachadult performance levels until the age of10 (Mann et al, 1979). Studies of children’sability to identify familiar voices have revealedthat children as young as three years old performwell above chance, and that this abilityalso improves with age (Bartholomeus, 1973;Spence et al, 2002). However, the variabilityamong the children is large. These reports suggestthat there is a developmental aspect to theability to recognize or identify recorded voices,and that there might be a difference in howchildren perform on speaker identification taskswhen compared to adults.Shuster (1998) presented a study where childrenand adolescents (age 7-14) with deviantspeech production of /r/ were recorded whenpronouncing words containing /r/. The recordingswere then edited so that the /r/sounded correct. A recording in the listeningscript prepared for a particular child could thusbe either an original recording or a “corrected”recording, spoken either by the child himself/herselfor another speaker. The task for thechildren was to judge both the correctness ofthe /r/ and the identity of the speaker. One ofthe findings in this study was that the childrenhad difficulty identifying the speaker as himself/herselfwhen hearing a “corrected” versionof one of their own recordings. The authorspeculates that the editing process could haveintroduced or removed something, therebymaking the recording less familiar to thespeaker. Another confounding factor could bethe 1-2 week time span between the recordingand the listening task; this could also havemade the task more difficult than if the childrenhad heard the “corrected” version directly afterthe recording. Unfortunately, no studies of howthe time span between recording and listeningmight affect children’s performance on speakeridentification tasks have been found, and anyeffects caused by this factor remain unclear.Of the few studies that have been done toexplore children’s perception of recordedvoices – of their own recorded voice in particular– many were done over twenty years ago.Since then, there has been a considerable increasein the number of recording devices thatcan potentially be present in children’s environments.This strongly motivates renewed anddeeper exploration into children’s selfperceptionof their recorded voice, and possibledevelopmental changes in this perceptual abil-136
<strong>Proceedings</strong>, FONETIK <strong>2009</strong>, Dept. of Linguistics, Stockholm Universityity. If it is found that children indeed recognizetheir recorded voice as their own, this may haveimportant implications for the use of recordingsin speech and language intervention.PurposeThe purpose of this study is to explore children’sability to recognize recordings of theirown voice as their own, and whether this abilityvaries depending on the age of the child and thetime between the recording and the listening.The research questions are:1. Are children with normal hearing ableto recognize their own recorded voiceas their own, and identify it when presentedtogether with 3 other childvoices?2. Will this ability be affected by the timespan between recording and listening?3. Will the performance be affected by theage of the child?as references. None of the reference childrenwere known to the children in the test groups.Recording/Identification procedureA computer program was used to present thewords in the scripts in random order, and foreach word1. Play a reference voice (adult) that readsa target word, while displaying a picturethat illustrates the word.2. Record the subject’s production of thesame word (with the possibility of listeningto the recording and re-recordinguntil both child and experimenter aresatisfied).3. Play the subject’s production and 3 referencechildren’s productions of thesame word, in random order, letting thesubject select one of these as his/herown. (See Figure 1.)It is hypothesized that the older children willperform better than the younger children, andthat both age groups will perform better whenlistening immediately after the recording thanwhen listening 1-2 weeks after the recording.MethodParticipants45 children with Swedish as their mothertongue, and with no known hearing problemsand with no previous history of speech and languageproblems or therapy were invited to participate.The children were divided into two agegroups, with 27 children aged 4-5 years (rangingfrom 4;3 to 5;11, mean age 5;3) in theyounger group and 18 children aged 7-8 years(ranging from 7;3 to 8;9, mean age 8;0) in theolder group. Only children whose parents didnot know of or suspect any hearing or languageproblems in the child were invited. All childrenwere recruited from pre-schools in Stockholm.MaterialA recording script of 24 words was constructed(see Appendix). The words in the script all beganwith /tV/ or /kV/, and all had primary stresson the first syllable.Three 6-year old children (two girls and oneboy, included by the same criteria as the childrenparticipating in the study) were recordedFigure 1: The listening/identification setup.In both test sessions, the children were fittedwith a headset and the experimenter with headphonesto supervise the recordings. The childrenwere instructed to select the character theybelieved represented their own voice by pointingat the screen; the actual selection was managedby the experimenter by mouse clicking.The children were given two introductory trainingitems, to assure understanding of the task.In the first test session, the children performedboth the recording and the voice identificationtask, i.e. step 1-3. For the recordings,all children were instructed to speak with theirnormal voice, and utterances were re-recordeduntil both child and experimenter were satisfied.In the second test session, after a period of1-2 weeks, the children performed only theidentification task, i.e. step 3. Apart from generalencouragement, the experimenter provided137
<strong>Proceedings</strong>, FONETIK <strong>2009</strong>, Dept. of Linguistics, Stockholm Universityno feedback regarding the children’s performanceduring the voice identification task. Allactions – recording, listening and selecting –were logged by the computer program.ResultsTable 1 displays the mean correct own-voiceidentification for all 45 children on both testoccasions. The standard deviation reveals alarge variation within the groups; the performancevaries between 4 and 24 in both the firstand the second test. However, the average resultson both test occasions are well abovechance level. A closer look at the individualresults reveals that two children perform atchance level (or worse), while 12 children(27% of the children) perform with more than90% accuracy.Table 1. Mean correct responses on the first andsecond test, for both age groups (max score/test =24).First test Second testYounger 18.8 (SD: 5.5) 17.9 (SD: 6.2)Older 21.0 (SD: 2.2) 16.6 (SD: 5.5)Mean 19.7 (SD: 4.6) 17.3 (SD: 5.9)No difference was found between the youngerand the older children’s performance on thefirst test (t(37.2) = 1.829, p = 0.076) or on thesecond test (t(43) = 0.716, p = 0.478).For the older children, a significant differencewas found between the children’s performanceon the first test and their performanceon the second test (t(17) = 4.370, p
<strong>Proceedings</strong>, FONETIK <strong>2009</strong>, Dept. of Linguistics, Stockholm Universitywith a few cluster simplification patterns, suchas [tva] for “tavla” (picture). For the third ofthese children (a boy aged 4;4), and for all ofthe other children included in the study, nospeech production deviations was noted orcould be detected in the recordings. This mightsuggest a correlation between deviant speechproduction and difficulties of recognizing therecorded voice as one’s own. However, a contradictoryexample was also found that had tobe excluded from the study. Dentalisation (i.e.systematic substitution of [t], [d] and [n] for /k/,/g/ and /ng/, respectively) was noted for onegirl who could not participate for a second test,and who was therefore excluded from thisstudy. Interestingly, this girl scored 23 of 24 onthe first test. These single cases do certainly notpresent a uniform picture of the relation betweendeviant speech production and the abilityto recognize the recorded voice as one’s own,but rather illustrate the need for further investigationof this relation.The results in this study give support to theuse of recordings in a clinical setting, e.g. whenpromoting awareness in the child of deviationsin his/her speech production. An example of aneffort in this direction is presented in Shuster(1998), where children were presented withoriginal and “corrected” versions of their ownspeech production. The great variation betweenchildren in their ability to recognize their recordedvoice as their own requires further exploration.ConclusionsThe findings in this study indicate that childrenin the ages of 4-5 and 7-8 years can indeed recognizetheir own recorded voice as their own;average performance results are well abovechance. However, there is a large variabilityamong the children, with a few children performingat chance level or worse, and manychildren performing with more than 90% accuracy.No significant difference was found betweenthe younger and the older children’s performance,suggesting that self-voice perceptiondoes not improve between these ages. Furthermore,a time span of 1-2 weeks between recordingand identification seems to make theidentification task more difficult for the olderchildren, whereas the same time span does notaffect the younger children’s results. The findingshere support the use of recordings in clinicalsettings.AcknowledgementsThis work was funded by The Swedish GraduateSchool of Language Technology (GSLT).ReferencesBartholomeus, B. (1973) Voice identificationby nursery school children, Canadian Journalof Psychology/Revue canadienne depsychologie 27, 464-472.Mann, V. A., Diamond, R. and Carey, S. (1979)Development of voice recognition: Parallelswith face recognition, Journal of ExperimentalChild Psychology 27, 153-165.Maurer, D. and Landis, T. (2005) Role of boneconduction in the self-perception of speech,Folia Phoniatrica 42, 226-229.Rosa, C., Lassonde, M., Pinard, C., Keenan, J.P. and Belin, P. (2008) Investigations ofhemispheric specialization of self-voice recognition,Brain and Cognition 68, 204-214.Shuster, L. I. (1998) The perception of correctlyand incorrectly produced /r/, Journalof Speech, Language, and Hearing Research41, 941-950.Spence, M. J., Rollins, P. R. and Jerger, S.(2002) Children’s Recognition of CartoonVoices, Journal of Speech, Language, andHearing Research 45, 214-222.AppendixOrthography Transcription In English1) k /ko/ (the letter k)2) kaka /kka/ cake3) kam /kam/ comb4) karta /ka/ map5) katt /kat/ cat6) kavel /kvl/ rolling pin7) ko /ku/ cow8) kopp /kp/ cup9) korg /korj/ basket10) kula /kla/ marble11) kulle /kl/ hill12) kung /k/ king13) tåg /to/ train14) tak /tk/ roof15) tant /tant/ lady16) tavla /tvla/ picture17) tidning /tin/ newspaper18) tiger /tir/ tiger19) tomte /tmt/ Santa Claus20) topp /tp/ top21) tub /tb/ tube22) tumme /tm/ thumb23) tunga /ta/ tongue24) tupp /tp/ rooster139
<strong>Proceedings</strong>, FONETIK <strong>2009</strong>, Dept. of Linguistics, Stockholm UniversityStudies on using the SynFace talking head for the hearingimpairedSamer Al Moubayed 1 , Jonas Beskow 1 , Ann-Marie Öster 1 , Giampiero Salvi 1 , Björn Granström 1 , Nicvan Son 2 , Ellen Ormel 2 ,Tobias Herzke 31KTH Centre for Speech Technology, Stockholm, Sweden.2 Viataal, Nijmegen, The Netherlands.3 HörTech gGmbH, Germany.sameram@kth.se, {beskow, annemarie, giampi, bjorn}@speech.kth.se, n.vson@viataal.nl, elleno@socsci.ru.nl,t.herzke@hoertech.deAbstractSynFace is a lip-synchronized talking agentwhich is optimized as a visual reading supportfor the hearing impaired. In this paper wepresent the large scale hearing impaired userstudies carried out for three languages in theHearing at Home project. The user tests focuson measuring the gain in Speech ReceptionThreshold in Noise and the effort scaling whenusing SynFace by hearing impaired people,where groups of hearing impaired subjects withdifferent impairment levels from mild to severeand cochlear implants are tested. Preliminaryanalysis of the results does not show significantgain in SRT or in effort scaling. But looking atlarge cross-subject variability in both tests, it isclear that many subjects benefit from SynFaceespecially with speech with stereo babble.IntroductionThere is a growing number of hearing impairedpersons in the society today. In the ongoingEU-project Hearing at Home (HaH)(Beskow et al., 2008), the goal is to develop thenext generation of assistive devices that willallow this group - which predominantly includesthe elderly - equal participation in communicationand empower them to play a fullrole in society. The project focuses on theneeds of hearing impaired persons in home environments.For a hearing impaired person, it is oftennecessary to be able to lip-read as well as hearthe person they are talking with in order tocommunicate successfully. Often, only the audiosignal is available, e.g. during telephoneconversations or certain TV broadcasts. One ofthe goals of the HaH project is to study the useof visual lip-reading support by hard of hearingpeople for home information, home entertainment,automation, and care applications.The SynFace Lip-SynchronizedTalking AgentSynFace (Beskow et al, 2008) is a supportivetechnology for hearing impaired persons,which aims to re-create the visible articulationof a speaker, in the form of an animated talkinghead. SynFace employs a specially developedreal-time phoneme recognition system, basedon a hybrid of recurrent artificial neural networks(ANNs) and Hidden Markov Models(HMMs) that delivers information regardingthe speech articulation to a speech animationmodule that renders the talking face to thecomputer screen using 3D graphics.SynFace previously has been trained on fourlanguages: English, Flemish, German and Swedish.The training used the multilingualSpeechDat corpora. To align the corpora, theHTK (Hidden markov models ToolKit) basedRefRec recogniser (Lindberg et al, 2000) wastrained to derive the phonetic transcription ofthe corpus. Table 1 presents the % correctframe of the recognizers of the four languagesSynFace contains.Table 1. Complexity and % correct frame of the recognizersof different languages in SynFace.Language Connections % correct frameSwedish 541,250 54.2English 184,848 53.0German 541,430 61.0Flemish 186,853 51.0User StudiesThe SynFace has been previously evaluatedby subjects in many ways in Agelfors et al(1998), Agelfors et al (2006) and Siciliano et al(2003). In the present study, a large scale test ofthe use of SynFace as an audio-visual support140
<strong>Proceedings</strong>, FONETIK <strong>2009</strong>, Dept. of Linguistics, Stockholm Universityfor hearing impaired people with different hearingloss levels. The tests investigate how muchsubjects benefit from the use of SynFace interms of speech intelligibility, and how difficultit is for a subject to understand speech with thehelp of SynFace. Following is a detailed descriptionof methods used in these tests.MethodSRT or Speech Reception Threshold is thespeech signal SNR when the listener is able tounderstand 50% of the words in the sentences.In this test, SRT value is measured one timewith a speech signal alone without SynFace,with two types of noise, and another time withthe use of (when looking at) SynFace. If theSRT level has decreased when using SynFace,that means the subject has benefited from theuse of SynFace, since the subject could understand50% of the words with a higher noiselevel than when listening to the audio signalalone.To calculate the SRT level, a recursive proceduredescribed by Hagerman & Kinnefors(1995), is used, where the subject listens tosuccessive sentences of 5 words, and dependingon how many words the subject recognizes correctly,the SNR level of the signal is changed sothe subject can only understand 50% of thewords.The SRT value is estimated for each subjectin five conditions, a first estimation is used astraining, to eliminate any training effect. Thiswas recommended in Hagerman, B., & Kinnefors(1995). Two SRT values are estimated inthe condition of speech signal without SynFace,but with two types of noise, Stationary noise,and Babble noise (containing 6 speakers). Theother two estimations are for the same types ofnoise, but with the use of SynFace, that is whenthe subject is looking at the screen with Syn-Face, and listening in the head-phones to a noisysignal.In the effort scaling test, the easiness of usingSynFace by hearing impaired persons wastargeted.To establish this, the subject has to listen tosentences in the headphones, sometimes whenlooking at SynFace and sometimes withoutlooking at SynFace, and choose a value on apseudo continuous scale, ranging from 1 to 6,telling how difficult it is to listen to the speechsignal transmitted through the head-phones.Small Scale SRT Study on Normal HearingsubjectsA first small scale SRT intelligibility experimentwas performed on normal hearing subjectsranging in age between 26 and 40. Thisexperiment is established in order to confirmthe improvement in speech intelligibility of thecurrent SynFace using the SRT test.The tests were carried out using five normalhearing subjects. The stimuli consisted of twoSRT measurements while each measurementused a list of 10 sentences, and stationary noisewas added to the speech signal. A training sessionwas performed before the real test to controlthe learning effect, and two SRT measurementswere performed after that, one withoutlooking at SynFace and one looking at Syn-Face. Figure 1 shows the SRT levels obtainedin the different conditions, where each line correspondsto a subject.It is clear in the figure that all 5 subjects requiredlower SNR level when using SynFacecompared to the audio-only condition and theSRT for all of them decreased in the audio+SynFacecondition.An ANOVA analysis and successive multiplecomparison analysis confirm that there is asignificant decrease (improvement) of SRT (p
<strong>Proceedings</strong>, FONETIK <strong>2009</strong>, Dept. of Linguistics, Stockholm UniversityTable 2. Description of the hearing impaired testsubjects groupsSwedish German Flemish# Subject 15 15+15 15+15HearingImpairmentModerateMild+ModerateModerate+CochlearImplantsLocation KTH- Hörtech- Viataal-Preliminary AnalysisMean results of the SRT measurement testsare presented in Figure 2. The figure shows thelevel of SRT value for the different hearing impairmentgroups (cochlear implants with a noticeablyhigher level than the other groups), aswell the difference in SRT value with andwithout using SynFace. The mean values do notshow significant decrease or increase in theSRT level when using SynFace than with audio-onlyconditions. Nevertheless, when lookingat the performance of the subjects individually,a high inter-subject variability is clearwhich means that certain subjects have benefitedfrom the use of SynFace. Figure 3 showsthe sorted delta SRT value per subject for theSwedish moderate hearing impaired subject andthe Dutch cochlear implants subjects in speechwith babble noise condition. In addition to thehigh variability among subjects, and the highrange scaling between the groups with differenthearing impairment levels, it is clear that, in thecase of babble noise, most of the Swedish moderatehearing impairments subjects show benefit(negative delta SRT).Regarding the results of the effort scaling,subjects at all locations, do not show significantdifference in scaling value between the conditionof speech with and speech without Syn-Face. But again, the scaling value shows a highinter-subject variability.Another investigation we carried out was tostudy the effect of the SRT measurement listlength on the SRT value. As mentioned before,the SRT measurement used lists of 20 sentences,where every sentence contained 5words, and one training measurement was doneat the beginning to eliminate any training effect.Still, when looking at the average trend ofthe SRT value over time for each sentence, theSRT value was decreasing, this can be explainedas an ongoing training throughout themeasurement for each subject. But when lookingat the individual SRT value per test calculatedafter the 10 th and the 20st sentence foreach measurement, an observation was that forsome of the measurements, the SRT value ofthe same measurement increased at the 20 st sentencecompared to the 10 th sentence. Figure 4presents the difference of SRT value at the 20stsentence and the 10 th sentence for 40 SRT measurementswhich shows that although most ofthe measurements had a decreasing SRT value,some of them had an increasing one. Thismeans that the longer measurement is not alwaysbetter (decreasing the learning effect).We suspect here that this can be a result ofthat the 20 sentences long measurements aretoo long for the hearing impaired subjects, andthat they might be getting tired and loosingconcentration when the measurement is as longas 20 sentences and hence requiring a higherSNR.Synface, Sentence test252015SRTs105Icra without SynfaceIcra with SynfaceBabble without SynfaceBabble with Synface0-5Sweden;KTH, mod HIGemany;HTCH, mildHIGemany;HTCH, modHINetherlands,Viataal, modHINetherlands,Viataal, CIFigure 2. Mean SRT value for each of the subjects groups with and without the use of SynFaceand with two types of noise: stationary and babble.142
<strong>Proceedings</strong>, FONETIK <strong>2009</strong>, Dept. of Linguistics, Stockholm UniversityFigure 3. The delta SRT value (with SynFace-Without SynFace) per subject with babble noise.Left: the Swedish moderate hearing impaired group. Right: the Dutch cochlear implants subjects.Figure 4. The delta SRT at the 20 item in the listand the 10 th for 40 SRT measurements.DiscussionOverall, the preliminary analysis of the resultsof both the SRT test and the effort scalingshowed limited beneficial effects for SynFace.However, the Swedish participants showed anoverall beneficial effect for the use of SynFacein the SRT test when listening to speech withbabble noise.Another possible approach when examiningthe benefit of using SynFace may be looking atindividual results as opposed to group means.The data shows that some people benefit fromthe exposure to SynFace. In the ongoing analysisof the tests, we will try to see if there arecorrelations in the results for different tests persubject, and hence to study if there are certainfeature which characterize subjects who showconsistent benefit from SynFace throughout allthe tests.ConclusionsThe paper reports on the methods used forthe large scale hearing impaired tests with Syn-Face lip-synchronized talking head. Preliminaryanalysis of the results from the user studieswith hearing impaired subjects where performedat three sites. Although SynFaceshowed consistent advantage for the normalhearing subjects, SynFace did not show a consistentadvantage with the hearing impairedsubjects, but there were SynFace benefits forsome of the subjects in all the tests, especiallyfor speech-in-babble-noise condition.AcknowledgementsThis work has been carried out under theHearing at Home (HaH) project. HaH is fundedby the EU (IST-045089). We would like tothank other project members at KTH, Sweden;HörTech, OFFIS, and ProSyst, Germany;VIATAAL, the Netherlands, and TelefonicaI&D, Spain.ReferencesAgelfors, E., Beskow, J., Dahlquist, M.,Granström, B., Lundeberg, M., Spens,K-E., & Öhman, T. (1998). Syntheticfaces as a lipreading support. In <strong>Proceedings</strong>of ICSLP'98.Agelfors, E., Beskow, J., Karlsson, I., Kewley,J., Salvi, G., & Thomas, N. (2006).User Evaluation of the SYNFACETalking Head Telephone. Lecture Notesin Computer Science, 4061, 579-586.Beskow, J., Granström, B., Nordqvist, P.,Al Moubayed, S., Salvi, G., Herzke, T.,& Schulz, A. (2008). Hearing at Home– Communication support in home environmentsfor hearing impaired persons.In <strong>Proceedings</strong> of Interspeech.Brisbane, Australia.Hagerman, B., & Kinnefors, C. (1995). Efficientadaptive methods for measuringspeech reception threshold in quiet andin noise. Scand Audiol, 24, 71-77.Lindberg, B., Johansen, F. T., Warakagoda,N., Lehtinen, G., Kai, Z., Gank, A.,Elenius, K., & Salvi, G. (2000). A noiserobust multilingual reference recogniserbased on SpeechDat(II). In Proc ofICSLP 2000, (pp. 370-373). Beijing.Siciliano, C., Faulkner, A., & Williams, G.(2003). Lipreadability of a synthetictalking face in normal hearing and hearingimpairedlisteners. In AVSP 2003-International Conference on Audio-Visual Speech Processing.143
<strong>Proceedings</strong>, FONETIK <strong>2009</strong>, Dept. of Linguistics, Stockholm UniversityOn extending VTLN to phoneme-specific warping inautomatic speech recognitionDaniel Elenius and Mats BlombergDepartmen of Speech, Music and Hearing, KTH, StockholmAbstractPhoneme- and formant-specific warping hasbeen shown to decrease formant and cepstralmismatch. These findings have not yet been fullyimplemented in speech recognition. This paperdiscusses a few reasons how this can be. A smallexperimental study is also included where phoneme-independentwarping is extended towardsphoneme-specific warping. The results of thisinvestigation did not show a significant decreasein error rate during recognition. This isalso in line with earlier experiments of methodsdiscussed in the paper.IntroductionIn ASR, mismatch between training and testconditions degrades the performance. Thereforemuch effort has been invested into reducing thismismatch using normalization of the inputspeech and adaptation of the acoustic modelstowards the current test condition.Phoneme-specific frequency scaling of aspeech spectrum between speaker groups hasbeen shown to reduce formant- (Fant, 1975) andcepstral- distance (Potamianos and Narayanan,2003). Frequency scaling has also been performedas a part of vocal tract length normalization(VTLN) to reduce spectral mismatchcaused by speakers having different vocal tractlengths (Lee and Rose 1996). However, in contrastto findings above this scaling is normallymade without regard to sound-class. How comethat phoneme-specific frequency scaling inVTLN has not yet been fully implemented inASR (automatic speech recognition) systems?Formant frequency mismatch was reducedby about one-half when formant- andvowel-category- specific warping was appliedcompared to uniform scaling (Fant, 1975). Alsophoneme-specific warping without formant-specificscaling has been beneficial interms of reducing cepstral distance (Potamianosand Narayanan, 2003). In the study it was alsofound that warp factors differed more betweenphonemes for younger children than for olderones. They did not implement automatic selectionof warp factors to be used during recognition.One reason presented was that the gain inpractice could be limited by the need of correctlyestimating a large number of warp factors.Phone clustering was suggested as a method tolimit the number of warping factors needed toestimate.One method used in ASR is VTLN, whichperforms frequency warping during analysis ofan utterance to reduce spectral mismatch causedby speakers having different vocal tract lengths(Lee and Rose, 1996). They steered the degree ofwarping by a time-independent warping-factorwhich optimized the likelihood of the utterancegiven an acoustic model using the maximumlikelihood criterion. The method has also beenfrequently used in recognition experiments bothwith adults and children (Welling, Kanthak andNey, 1999; Narayanan and Potamianos, 2002;Elenius and Blomberg, 2005; Giuliani, Gerosaand Brugnara 2006). A limitation with this approachis that time-invariant warping results inall phonemes as well as non-speech segmentssharing a common warping factor.In recent years increased interest has beendirected towards time-varying VTLN (Miguelet.al., 2005; Maragakis et.al., 2008). The formermethod estimates a frame-specific warpingfactor during a memory-less Viterbi decodingprocess, while the latter method uses a two-passstrategy where warping factors are estimatedbased on an initial grouping of speech frames.The former method focuses on revising the hypothesisof what was said during warp estimationwhile the latter focuses on sharing the samewarp factor within each given group. Phoneme-specificwarping can be implemented tosome degree with either of these methods. Eitherby explicitly forming phoneme-specific groupsor implicitly by estimating frame-specific warpfactors.However, none of the methods above presentsa complete solution for phoneme-specificwarping. One reason is that more then one instantiationof a phoneme can occur far apart intime. This introduces a long distance depend-144
<strong>Proceedings</strong>, FONETIK <strong>2009</strong>, Dept. of Linguistics, Stockholm Universityency due to a shared warping factor. For theframe-based method using a memory-lessViterbi process this is not naturally accountedfor.A second reason is that in an unsupervisedtwo-pass strategy initial mismatch causes recognitionerrors which limit the performance.Ultimately initial errors in assigning frames togroup-identities will bias the final recognitionphase towards the erroneous identities assignedin the first pass.The objective of this paper is to assess theimpact of phoneme-specific warping on anASR-system. First a discussion is held regardingissues with phoneme-specific warping. Then anexperiment is set up to measure the accuracy of asystem performing phoneme-specific VTLN.The results are then presented on a connected-digittask where the recognizer wastrained for adults and evaluated on children’sspeech.Phoneme-specific VTLNThis section describes some of the challenges inphoneme-specific vocal tract length normalization.Selection of frequency warping functionIn (Fant, 1975) a case was made forvowel-category and formant- specific scaling incontrast to uniform scaling. This requires formanttracking and subsequent calculations offormant-specific scaling factors, which is possibleduring manual analysis. Following anidentical approach under unsupervised ASRwould include automatic formant tracking,which is a non-trivial problem without a finalsolution (Vargas at.al, 2008).Lee and Rose (1996) avoided explicitwarping of formants by performing a commonfrequency warping function for all formants.Since the function is equal for all formants, noformant-frequency estimation is needed whenapplying this method. The warping function canbe linear, piece-wise linear or non-linear. Uniformfrequency scaling of the frequency intervalof formants is possible using a linear orpiece-wise linear function. This could also beextended to a rough formant scaling, using anon-linear function, under the simplified assumptionthat the formant regions do not overlap.This paper is focused on uniform scaling ofall formants. For this aim a piece-wise linearwarping function is used, where the amount ofwarping is steered by a warping-factor.Warp factor estimationGiven a specific form of the frequency warpingto be performed, a question still remains of thedegree of warping. In Lee and Rose (1996) thiswas steered by a common warping factor for allsound-classes. The amount of warping was determinedby selecting the warping-factor thatmaximized the likelihood of the warped utterancegiven an acoustic model. In the generalcase this maximization lacks a simple closedform and therefore the search involves an exhaustivesearch on a set of warping factors.An alternative to warp the utterance is toperform a transform of the model parameters ofthe acoustic model towards the utterance.Thereby a warp-specific model is generated. Inthis case, warp factor selection amounts to selectingthe model that best fit data, which is astandard classification problem. So given a setof warp-specific models one can select themodel that results in the maximum likelihood ofthe utterance.Phoneme-specific warp estimationLet us consider extending the method above to aphoneme-specific case. Instead of a scalarwarping factor a vector of warping factors can beestimated with one factor per phoneme. The taskis now to find the parameter vector that maximizesthe likelihood of the utterance given thewarped models. In theory this results in an exhaustivesearch of all combinations of warpingfactors. For 20 phonemes with 10 warp candidates,this amounts to 10 20 likelihood calculations.This is not practically feasible and therebyan approximate method is needed.In (Miguel et.al, 2005) a two-pass strategywas used. During the first pass a preliminarysegmentation is made. This is then held constantduring warp estimation to allow separatewarp-estimates to be made for each phoneme.Both a regular recognition phase as well asK-Means grouping has been used in their region-basedextension to VTLNThe group-based warping method above relieson a two-pass strategy where a preliminaryfixed classification is used during warp factorestimation, which is then applied in a final recognitionphase. Initial recognition errors canultimately cause a warp to be selected thatmaximizes the likelihood of an erroneous identity.Application of this warping factor will then145
<strong>Proceedings</strong>, FONETIK <strong>2009</strong>, Dept. of Linguistics, Stockholm Universitybias the final recognition towards the erroneousidentities. The severity of this hazard depends onthe number of categories used and the kind ofconfusions made.An alternative to a two-pass approach is tosuccessively revise the hypothesis of what hasbeen said as different warping factors areevaluated. Following this line of thought leads toa parallel of warp factor estimation and determinationof what was said. For a speech recognizerusing Viterbi-decoding this can be implementedby adding a warp-dimension to thephoneme-time trellis (Miguel et.al. 2005). Thisleads to a frame-specific warping factor. Unconstrainedthis would lead to a large amount ofcomputations. Therefore a constraint on thetime-derivative of the warp factor was used tolimit the search space.A slowly varying warping factor might notbe realistic even though individual articulatorsmove slowly. One reason is that given multiplesources of sound a switch between them cancause an abrupt change in the warping factor.This switch can for instance be between speakers,to/from non-speech frames, or a change inplace and manner of articulation. The changecould be performed with a small movementwhich causes a substantial change in the air-flowpath. To some extent this could perhaps be takeninto account using parallel warp-candidates inthe beam-search used during recognition.In this paper model-based warping is performed.For each warp setting the likelihood ofthe utterance given the set of warped models iscalculated using the Viterbi algorithm. The warpset is chosen that results in the maximum likelihoodof the utterance given the warped models.In contrast to the frame-based, long distancedependencies are taken into account. This ishandled by warping the phoneme models used torecognize what was said. Thereby each instantiationof the model during recognition is forcedto share the same warping factor. This was notthe case in the frame-based method which used amemory-less Viterbi decoding scheme for warpfactor selection.Separate recognitions for each combinationof warping factors were used to avoid relying onan initial recognition phase, as was done in theregion-based method.To cope with the huge search space two approacheswere taken in the current study namely:reducing the number of individual warp factorsby clustering phonemes together and by supervisedadaptation to a target group.Experimental studyPhoneme-specific warping has been explored interms of WER (word error rate) in an experimentalstudy. This investigation was made on aconnected-digit string task. For this aim a recognitionsystem was trained on adult speakers:This system was then adapted towards childrenby performing VTLT (vocal tract length transformation).A comparison between phoneme-independentand -specific adaptationthrough warping the models of the recognizerwas conducted. Unsupervised warping duringtest was also conducted using two groups ofphonemes with separate warping factors. Thegroups used were formed by separating silence,/t/ and /k/ forming the rest of the phonemes.Speech materialThe corpora used for training and evaluationcontain prompted digit-strings recorded one at atime. Recordings were made using directionalmicrophones close to the mouth. The experimentswere performed for Swedish using twodifferent corpora, namely SpeeCon andPF-STAR for adults and children respectively.PF-STAR consists of children speech inmultiple languages (Batliner et.al. 2005). TheSwedish part consists of 198 children of 4 to 8years repeating oral prompts spoken by an adultspeaker. In this study only connected-digitstrings were used to concentrate on acousticmodeling rather than language models. Eachchild was orally prompted to speak 10three-digit strings amounting to 30 digits perspeaker. Recordings were performed in a separateroom at daycare and after-school centers.During these recordings sound was picked up bya head-set mounted cardioid microphone,Sennheiser ME 104. The signal was digitizedusing 24 bits @ 32 kHz using an externalusb-based A/D converter. In the current studythe recordings were down-sampled to 16 bits @16 kHz to match that used in SpeeCon.SpeeCon consists of both adults and childrendown to 8 years (Großkopf et.al 2002). In thisstudy, only digit-strings recordings were used.The subjects were prompted using text on acomputer screen in an office environment. Recordingswere made using the same kind of microphoneas was used in Pf-Star. An analoghigh-pass filter with a cut-off frequency of 80 Hzwas used, and digital conversion was performed146
<strong>Proceedings</strong>, FONETIK <strong>2009</strong>, Dept. of Linguistics, Stockholm Universityusing 16 bits at 16 kHz. Two sets were formedfor training and evaluation respectively consistingof 60 speakers each to match Pf-Star.Recognition systemThe adaptation scheme was performed using aphone-level HMM-system (Hidden MarkowModel) for connected digit-string recognition.Each string was assumed to be framed by silence(/sil/) and consist of an arbitrary number ofdigit-words. These were modeled as concatenationsof three state three-phone models ended byan optional short-pause model. The short pausemodel consisted of one state, which shared it’spdf (probability density function) with the centrestate of the silence model.The distribution of speech features in eachstate was modeled using GMMs (GaussianMixture Models) with 16 mixtures and diagonalcovariance matrices. The feature vector usedconsisted of 13 * 3 elements. These elementscorrespond to static parameters and their firstand second order time derivatives. The staticcoefficients consisted of the normalized log energyof the signal and MFCCs (Mel FrequencyCepstrum Coefficients). These coefficients wereextracted using a cosine transform of a melscaled filter bank consisting of 38 channels inthe range corresponding to the interval 0 to 7.6kHz.Training and recognition experiments wereconducted using the HTK speech recognitionsoftware package (Young et.al., 2005). Phoneme-specificadaptation of the acoustic modelsand warp factor search was performed by separateprograms. The adaptation part was performedby applying the correspondingpiece-wise linear VTLT in the model space aswas used in the feature space by Pitz and Ney2005.ResultsThe WER (word error rate) of recognition experimentswhere unsupervised adaptation to thetest utterance was performed is shown in Table 1.The baseline experiment using phoneme-independentwarping resulted in a WER(word error rate) of 13.2%. Introducing twogroups ({/sil/, /t/, /k/} and {the rest of the models})with separate warping factors lowered theerror rate to 12.9%. This required that an exhaustivesearch of all combinations of twowarping factors was performed. If an assumptionthat the warping factor could be estimatedseparately, the performance increase was reducedby 0.2% absolute. Further division byforming a 3:rd group with unvoiced fricatives{/s/, /S/, /f/ and /v/} was also attempted, but withno improvement in recognition to that above. Inthis case /v/ in “två” is mainly unvoicedTable 1. Recognition results with modelgroup-specific warping factors. Unsupervised likelihoodmaximization of each test utterance. Thegroup was formed by separating /sil/, /t/ and /k/from the rest of the models.MethodWERVTLN 1-warping factor 13,2Speech 13,42 Groups (separate estimation) 13,12 Groups (joint maximization) 12,9Phoneme-specific adaptation of an adult recognizerto children resulted in warping factorsgiven in Figure 1. The method gave silence awarping factor of 1.0, which is reasonable. Ingeneral voiced-phonemes were more stronglywarped than un-voiced ditto.1,51,451,41,351,31,251,21,151,11,051sil t s v S f k O n a m o: l e i: r uh: y: e: UFigure 1. Phoneme-specific warp adapting adultmodels to children sorted in increasing warp-factor.Further division of the adaptation data into agegroups resulted in the age and phoneme-specificwarping factors shown in Figure 2. In general,the least warping of adult models was needed for8 year old children compared to younger children.1,71,61,51,41,31,21,11sil t v S k s O o: f e l a uh: n r e: y: m i: UFigure 2. Phoneme and age-specific warping factors.Optimized on likelihood of adaptation data. Thephonemes are sorted in increasing warp-factor for 6year old speakers.45678147
<strong>Proceedings</strong>, FONETIK <strong>2009</strong>, Dept. of Linguistics, Stockholm UniversityThe found warping factors for the child and agegroups were then applied on the test-data tomeasure the implication on the WER. The resultof this experiment is given in Table 2. Introducingphoneme-specific warping did not substantiallyreduce the number of errors comparedto a shared warping factor for all phonemes.Table 2. Recognition results with adult modeladapted to children using a fixed warping vector forall utterances with one warp factor per phoneme.Phoneme- dependent and -independentwarping is denoted Pd and Pi respectively.Method WERFix Pi 13,7Fix Pd 13,2Fix Pd per age 13,2DiscussionTime invariant VTLN has in recent years beenextended towards phoneme-specific warping.The increase in recognition accuracy duringexperimental studies has however not yet reflectedthe large reduction in mismatch shownby Fant (1975).One reason for the discrepancy can be thatunconstrained warping of different phonemescan cause unrealistic transformation of thephoneme space. For instance swapping places ofthe low left and upper right regions could beperformed by choosing a high and low warpingfactor respectively.ConclusionIn theory phoneme-specific warping has a largepotential for improving the ASR accuracy. Thispotential has not yet been turned into significantlyincreased accuracy in speech recognitionexperiments. One difficulty to manage is thelarge search space resulting from estimating alarge number of parameters. Further research isstill needed to explore remaining approaches ofincorporating phoneme-dependent warping intoASR.AcknowledgementsThe authors wish to thank the Swedish ResearchCouncil for founding the research presented inthis paper.ReferencesBatliner A, Blomberg M, D’Acry S, Elenius Dand Giuliani D. (2005). The PF_STARChildren’s Speech Corpus. Interspeech2005, 2761 – 2764.Elenius, D., Blomberg, M. (2005) Adaptationand Normalization Experiments in SpeechRecognition for 4 to 8 Year old Children. InProc Interspeech 2005, pp. 2749 - 2752.Fant, G. (1975) Non-uniform vowel normalization.STL-QPSR. Quartely Progress andStatus Report. Departement for Speech Musicand Hearing, Stockholm, Sweden 1975.Giuliani, D., Gerosa, M. and Brugnara, F. (2006)Improved Automatic Speech RecognitionThrough Speaker Normalization. ComputerSpeech & Language, 20 (1), pp. 107-123,Jan. 2006.Großkopf B, Marasek K, v. d. Heuvel, H., DiehlF, and Kiessling A (2002). SpeeCon - speechdata for consumer devices: Database specificationand validation. Second InternationalConference on Language Resources andEvaluation 2002.Lee, L., and Rose, R. (1996) Speaker NormalizationUsing Efficient Frequency WarpingProcedures. In proc. Int. Conf. on Acoustic,Speech and Signal Processing,1996, Vol 1,pp. 353-356.Maragakis, M. G. and Potamianos, A. (2008)Region-Based Vocal Tract Length Normalizationfor ASR. Interspeech 2008. pp.1365 - 1368.Miguel, A., Lleida, E., Rose R. C.,.Buera, L. andortega, A. (2005) Augmented state spaceacoustic decoding for modeling local variabilityin speech. In Proc. Int. Conf. SpokenLanguage Processing. Sep 2005.Narayanan, S., Potamianos, A. (2002) CreatingConversational Interfaces for Children. IEEETransactions on Speech and Audio Processing,Vol. 10, No. 2, February 2002.Pitz, M. and Ney, H. (2005) Vocal Tract NormalizationEquals Linear Transformation inCepstral Space, IEEE Trans. On Speech andAudio Processing, 13(5):930-944, 2005.Potamianos, A. Narayanan, S. (2003) RobustRecognition of Children’s Speech. IEEETransactions on Speech and Audio Processing,Vol 11, No 6, November 2003. pp.603 – 616.Welling, L., Kanthak, S. and Ney, H. (1999)Improved Methods for Vocal Tract Normalization.ICASSP 99, Vol 2, pp. 161-164.148
<strong>Proceedings</strong>, FONETIK <strong>2009</strong>, Dept. of Linguistics, Stockholm UniversityYoung, S., Evermann, G., Gales, M., Hain, T.,Kershaw, D., Moore, G., Odell, J., Ollason,D., Povey, D., Valtchev, V., Woodland, P.(2005) The HTK book. Cambridge UniversityEngineering Department 2005.Vargas, J. and McLaughlin, S. (2008). CascadePrediction Filters With Adaptive Zeros toTrack the Time-Varying Resonances of theVocal Tract. In Transactions on AudioSpeech, and Language Processing. Vol. 16No 1 2008. pp. 1-7.149
<strong>Proceedings</strong>, FONETIK <strong>2009</strong>, Dept. of Linguistics, Stockholm UniversityVisual discrimination between Swedish and Finnishamong L2-learners of SwedishNiklas Öhrström, Frida Bulukin Wilén, Anna Eklöf and Joakim GustafssonDepartment of Linguistics, Stockholm University.AbstractA series of speech reading experiments werecarried out to examine the ability to discriminatebetween Swedish and Finnish among L2learners of Swedish and Spanish as their mothertongue. This group was compared with nativespeakers of Swedish and a group with noknowledge in Swedish or Finnish. The resultsshowed tendencies, that familiarity with Swedishincreased the discrimination ability betweenSwedish and Finnish.IntroductionAudition is the main modality for speech decoding.Nevertheless, visual information aboutthe speech gestures while listening providescomplementary visual cues to speech perception.This use of visual information plays a significantrole, especially during noisy conditions(Sumby and Pollack, 1954; Erber, 1969). However,McGurk and MacDonald (1976) showedthat the visual signal is incorporated in auditoryspeech percept, even at favorable S/N ratios.They used dubbed tapes with a face pronouncingthe syllables [gaga] and [baba]. When listenerssaw the face articulating [gaga], whilethe audio track was changed for [baba], the majorityreported having heard [dada]. LaterTraunmüller and Öhrström (2007) demonstratedthat this phenomenon also holds for vowels,where the auditory percept is influenced bystrong visual cues such as lip rounding. Thesefindings are clear evidence that speech perceptionin face-to-face-communication is a bimodalrather than uni-modal process.In case of no available acoustic speech signal,the listener must fully rely on visual speechcues, i.e. speech reading. Visual informationalone is in most cases not sufficient for speechprocessing, since many speech sounds fall intothe same visually discriminable category. Homorganicspeech sounds are difficult to distinguish,while labial features, such as degree oflip rounding or lip closure are easily distinguishable(Amcoff, 1970). It has been shownthat performance in speech reading variesgreatly across perceivers (Kricos, 1996). Generally,females perform better than males(Johnson et al., 1988).The importance of the visual signal inspeech perception has recently been stressed intwo articles. Soto-Faraco et al. (2007) carriedout a study where subjects were presented silentclips of a bilingual speaker uttering sentencesin either Spanish or Catalan. Followingthe first clip, another one was presented. Thesubjects’ task was to decide whether the languagehad been switched or not from the oneclip to the other. Their subjects were eitherpeople with Spanish or Catalan as their firstlanguage. The other group consisted of peoplefrom Italy and England with no knowledge inSpanish or Catalan. In the first group bilingualsperformed best. However, people with eitherSpanish or Catalan as their mother tongue performedbetter than chance level. The secondgroup did not perform better than chance level,ruling out the possibility that the performanceof the first group was due to paralinguistic orextralinguistic signals. Their performance wasbased on linguistic knowledge in one of thepresented languages. Later, Weikum et al.(2007) carried out a similar study, where thespeaker was switching between English andFrench. In this study, the subjects were 4-, 6-and 8-month-old infants, acquiring English.According to their results, the 4-, and 6-montholdsperformed well, while the 8-month-oldsperformed worse. One interpretation is that the4- and 6-month-olds discriminate on the basisof psycho-optic differences, while the 8-montholdsare about to lose this ability as a result ofacquiring the visually discriminable categoriesof English. These are important findings, sinceit highlights the visual categories as part of thelinguistic competence. The two studies are notfully comparable, since they deal with differentlanguages, which do not necessarily differ inthe same way. It cannot be excluded thatFrench and English are so dissimilar visually,that it might be possible to discriminate betweenthem on the basis of psycho-optic differencesonly. It does however suggest that wemight relearn to discriminate the L1 from anunknown language.150
<strong>Proceedings</strong>, FONETIK <strong>2009</strong>, Dept. of Linguistics, Stockholm UniversityThis study deals with L2 learning. Can welearn an L2 to the extent, that it could be visuallydiscriminable from an unknown language?Can we establish new visual language-specificcategories as adults? To answer these questionsthe visual discriminability between Finnish andSwedish among (i) people with Swedish astheir L1, (ii) people with Swedish as their L2(immigrants from Latin-America) and (iii)people with no knowledge in either Swedish orFinnish (Spanish citizens). The Swedish andFinnish speech sound inventories differ inmany ways: The two languages both use frontand back rounded vowels. Finnish lacks the differencebetween in- and out-rounded vowels(Volotinen, 2008). This feature is easy to perceivevisually, since in-rounding involves hiddenteeth (behind the lips), while out-rounding doesnot. The Finnish vowel system recruits onlythree degrees of openness, while Swedishmakes use of four degrees. The temporal aspectsmay be difficult to perceive visually(Wada et al. 2003). Swedish is often referred toas being a stress timed language (Engstrand,2004): The distances between stressed syllablesare kept more or less constant. In addition,Swedish make use of long and short vowels instressed syllables. The following consonantlength is complementary striving to keepstressed syllables at constant length. Finnish isoften referred as a quantity language and vowelsas well as consonants can be long or shortregardless of stressing. Unlike Swedish, a longvowel can be followed by a long consonant.Swedish is abundant in quite complex consonantclusters. Finnish is more restrained fromthat point of view.MethodSpeech materialThe study is almost a replica of that of Soto-Faraco et al. (2007). One bilingual, Finno-Swedish, male was chosen as speaker. HisSwedish pronunciation was judged to be on L1-level, by the authors. His Finnish pronunciationwas judged (by two finnish students) to be almoston L1-level. The speaker was videotapedwhile pronouncing the four swedish sentences:(i) Fisken är huvudföda <strong>för</strong> trädlevande djur,(ii) Vid denna sorts trottoarer brukar det varapölfritt, (iii) Denna är ej upplåten <strong>för</strong> motorfordonutan är normalt enbart avsedd <strong>för</strong> rullstolar,(iv) En motorväg är en sån väg som bestårav två körbanor med i normalfallet två körfält,and four finnish sentences: (i) Teiden luokitteluperusteetvaihtelevat maittain, (ii) Jänistensukupuolet ovat samannäköisiä, (iii) Yleensätiet ovat myös numeroitu, ja usein tieluokkavoidaan päätellä numerosta, (iv) Kalojen tukiranganhuomattavin osa muodostuu selkärangastaja kallosta.SubjectsThree groups were examined. Group 1 consistedof 22 (12 female and 10 male) L2-speakers of Swedish, aged 23-63 years (Mean=37.5 years). They were all Spanish speakingimmigrants from Latin-America. Group 2 consistedof 12 (6 male and 6 female) L1 speakersof Swedish, aged 18-53 years (Mean=38.8years). Group 3 consisted of 10 (4 female and 6male) L1 speakers of Spanish, aged 24-47 years(Mean=37.7 years). They were all residents ofSan Sebastian (Spain), with Spanish as their L1and no knowledge in Swedish or Finnish.ProcedureEach group was presented 16 sentence pairs inquasi-randomized order. The subjects’ task wasto judge whether or not the following sentencewas in the same language as the first. In group1, information about their education in Swedishwas asked for (i.e. number of semesters at theSchool of SFI, Swedish for immigrants) and theage when arriving in Sweden. In group 1, thesubjects were asked to estimate their use ofSwedish as compared with their use of Spanishon a four-degree-scale.ResultsGroup 1 (L2 speaker of Swedish)Group 1 achieved a result of, on average, 10.59correct answer of 16 possible (sd = 2.17). Aone-sample t-test revealed that their performancewas significantly over chance level(p
<strong>Proceedings</strong>, FONETIK <strong>2009</strong>, Dept. of Linguistics, Stockholm UniversityGroup 2 (L1 speakers of Swedish)Group 2 achieved a result of, on average, 11.25correct answer of 16 possible (sd = 1.35). Aone-sample t-test revealed that their performancewas significantly over chance level(p
<strong>Proceedings</strong>, FONETIK <strong>2009</strong>, Dept. of Linguistics, Stockholm UniversityWada Y. et al. (2003) Audiovisual integrationin temporal perception. international Psychophysiology50, 117-124.Weikum W. et al. (2007) Visual language discriminationin infancy. Science. 316. 1159.McGurk H. MacDonald J. (1976) Hearinglips and seeing voices. Nature 264, 746-748.153
<strong>Proceedings</strong>, FONETIK <strong>2009</strong>, Dept. of Linguistics, Stockholm UniversityEstimating speaker characteristics for speech recognitionMats Blomberg and Daniel EleniusDept. of Speech, Music and Hearing, KTH/CSC, StockholmAbstractA speaker-characteristic-based hierarchic treeof speech recognition models is designed. Theleaves of the tree contain model sets, which arecreated by transforming a conventionallytrained set using leaf-specific speaker profilevectors. The non-leaf models are formed bymerging the models of their child nodes. Duringrecognition, a maximum likelihood criterionis followed to traverse the tree from theroot to a leaf. The computational load for estimatingone- (vocal tract length) and fourdimensionalspeaker profile vectors (vocal tractlength, two spectral slope parameters andmodel variance scaling) is reduced to a fractioncompared to that of an exhaustive searchamong all leaf nodes. Recognition experimentson children’s connected digits using adult modelsexhibit similar recognition performance forthe exhaustive and the one-dimensional treesearch. Further error reduction is achievedwith the four-dimensional tree. The estimatedspeaker properties are analyzed and discussed.IntroductionKnowledge on speech production can play animportant role in speech recognition by imposingconstraints on the structure of trained andadapted models. In contrast, current conventional,purely data-driven, speaker adaptationtechniques put little constraint on the models.This makes them sensitive to recognition errorsand they require a sufficiently high initial accuracyin order to improve the quality of the models.Several speaker characteristic propertieshave been proposed for this type of adaptation.The most commonly used is compensation formismatch in vocal tract length, performed byVocal Tract Length Normalization (VTLN)(Lee and Rose, 1998). Other candidates, lessexplored, are voice source quality, articulationclarity, speech rate, accent, emotion, etc.However, there are at least two problemsconnected to the approach. One is to establishthe quantitative relation between the propertyand its acoustic manifestation. The secondproblem is that the estimation of these featuresquickly becomes computationally heavy, sinceeach candidate value has to be evaluated in acomplete recognition procedure, and the numberof candidates needs to be sufficiently highin order to have the required precision of theestimate. This problem becomes particularlysevere if there is more than one property to bejointly optimized, since the number of evaluationpoints equals the product of the number ofindividual candidates for each property. Twostagetechniques, e.g. (Lee and Rose, 1998) and(Akhil et. al., 2008), reduce the computationalrequirements, unfortunately to the prize oflower recognition performance, especially if theaccuracy of the first recognition stage is low.In this work, we approach the problem ofexcessive computational load by representingthe range of the speaker profile vector as quantizedvalues in a multi-dimensional binary tree.Each node contains an individual value, or aninterval, of the profile vector and a correspondingmodel set. The standard exhaustive searchfor the best model among the leaf nodes cannow be replaced by a traversal of the tree fromthe root to a leaf. This results in a significantreduction of the computational amount.There is an important argument for structuringthe tree based on speaker characteristicproperties rather than on acoustic observations.If we know the acoustic effect of modifying acertain property of this kind, we can predictmodels of speaker profiles outside their rangein the adaptation corpus. This extrapolation isgenerally not possible with the standard acoustic-onlyrepresentation.In this report, we evaluate the predictionperformance by training the models on adultspeech and evaluating the recognition accuracyon children’s speech. The achieved results exhibita substantial reduction in computationalload while maintaining similar performance asan exhaustive grid search technique.In addition to the recognized identity, thespeaker properties are also estimated. As thesecan be represented in acoustic-phonetic terms,they are easier to interpret than the standardmodel parameters used in a recognizer. This154
<strong>Proceedings</strong>, FONETIK <strong>2009</strong>, Dept. of Linguistics, Stockholm Universityprovides a mechanism for feedback fromspeech recognition research to speech productionknowledge.MethodTree generationThe tree is generated using a top-down designin the speaker profile domain, followed by abottom-up merging process in the acousticmodel domain. Initially, the root node is loadedwith the full, sorted, list of values for each dimensionin the speaker profile vector. A numberof child nodes are created, whose lists areachieved by binary splitting each dimension listin the mother node. This tree generation processproceeds until each dimension list has asingle value, which defines a leaf node. In thisnode, the dimension values define a uniquespeaker profile vector. This vector is used topredict a profile-specific model set by controllingthe transformation of a conventionallytrained original model set. When all child nodemodels to a certain mother node are created,they are merged into a model set at their mothernode. The merging procedure is repeated upwardsin the tree, until the root model isreached. Each node in the tree now contains amodel set which is defined by its list of speakerprofile values. All models in the tree have equalstructure and number of parameters.Search procedureDuring recognition of an utterance, the tree isused to select the speaker profile whose modelset maximizes the score of the utterance. Therecognition procedure starts by evaluating thechild nodes of the root. The maximumlikelihoodscoring child node is selected forfurther search. This is repeated until a stop criterionis met, which can be that the leaf level ora specified intermediate level is reached. Anotherselection criterion may be the maximumscoring node along the selected root-to-leafpath (path-max). This would account for thepossibility that the nodes close to the leaves fitpartial properties of a test speaker well but haveto be combined with sibling nodes to give anoverall good match.Model transformationsWe have selected a number of speaker propertiesto evaluate our multi-dimensional estimationapproach. The current set contains a fewbasic properties described below. These aresimilar, although not identical, to our work in(Blomberg and Elenius, 2008). Further developmentof the set will be addressed in futurework.VTLNAn obvious candidate as one element in thespeaker profile vector is Vocal Tract LengthNormalisation (VTLN). In this work, a standardtwo-segment piece-wise linear warping functionprojects the original model spectrum intoits warped spectrum. The procedure can be performedefficiently as a matrix multiplication inthe standard acoustic representation in currentspeech recognition systems, MFCC (Mel FrequencyCepstral Coefficients), as shown by Pitzand Ney (2005).Spectral slopeOur main intention with this feature is to compensatefor differences in the voice sourcespectrum. However, since the operation currentlyis performed on all models, also unvoicedand non-speech models will be affected.The feature will, thus, perform an overall compensationof mismatch in spectral slope,whether caused by voice source or the transmissionchannel.We use a first order low-pass function toapproximate the gross spectral shape of thevoice source function. This corresponds to theeffect of the parameter T a in the LF voicesource model (Fant, Liljencrants and Lin,1985). In order to correctly modify a model inthis feature, it is necessary to remove the characteristicsof the training data and to insertthose of the test speaker. A transformation ofthis feature thus involves two parameters: aninverse filter for the training data and a filterfor the test speaker.This two-stage normalization techniquegives us the theoretically attractive possibilityto use separate transformations for the vocaltract transfer function and the voice sourcespectrum (at least in these parameters). Afterthe inverse filter, there remains (in theory) onlythe vocal tract transfer function. Performingfrequency warping at this position in the chainwill thus not affect the original voice source ofthe model. The new source characteristics areinserted after the warping and are also unaffected.In contrast, conventional VTLN implicitlywarps the voice source spectrum identically155
<strong>Proceedings</strong>, FONETIK <strong>2009</strong>, Dept. of Linguistics, Stockholm Universityto the vocal tract transfer function. Such an assumptionis, to our knowledge, not supportedby speech production theory.Model varianceAn additional source of difference betweenadults’ and children’s speech is the larger intraandinter-speaker variability of the latter category(Potamianos and Narayanan, 2003). Weaccount for this effect by increasing the modelvariances. This feature will also compensate formismatch which can’t be modeled by the otherprofile features. Universal variance scaling isimplemented by multiplying the diagonal covarianceelements of the mixture componentsby a constant factor.ExperimentsOne- and four-dimension speaker profiles wereused for evaluation. The single dimensionspeaker profile was frequency warping(VTLN). The four-dimensional profile consistedof frequency warping, the two voicesource parameters and the variance scaling factor.Speech corporaThe task of connected digits recognition in themismatched case of child test data using adulttraining data was selected. Two corpora, theSwedish PF-Star children’s corpus (PF-Star-Sw) (Batliner et. al., 2005) and TIDIGITS,were used for this purpose. In this report, wepresent the PF-Star results. Results onTIDIGITS will be published in other reports.PF-Star-Sw consists of 198 children agedbetween 4 and 8 years. In the digit subset, eachchild was aurally prompted for ten 3-digitstrings. Recordings were made in a separateroom at day-care and after school centers.Downsampling and re-quantization of theoriginal specification of Pf-Star-Sw was performedto 16 bits / 16 kHz.Since PF-Star-Sw does not contain adultspeakers, the training data was taken from theadult Swedish part of the SPEECON database(Großkopf et al, 2002). In that corpus, eachspeaker uttered one 10 digit-string and four 5digit-strings, using text prompts on a computerscreen. The microphone signal was processedby an 80 Hz high-pass filter and digitized with16-bits / 16 kHz. The same type of head-set microphonewas used for PF-Star-Sw andSPEECON.Training and evaluation sets consist of 60speakers, resulting in a training data size of1800 digits and a children’s test data of 1650digits. The latter size is due to the failure ofsome children to produce all the three-digitstrings.The low age of the children combined withthe fact that the training and testing corpora areseparate makes the recognition task quite difficult.Pre-processing and model configurationA phone model representation of the vocabularyhas been chosen in order to allow phoneme-dependenttransformations. A continuous-distributionHMM system with wordinternal,three-state triphone models is used.The output distribution is modeled by 16 diagonalcovariance mixture components.The cepstrum coefficients are derived froma 38-channel mel filterbank with 0-7600 Hzfrequency range, 10 ms frame rate and 25 msanalysis window. The original models aretrained with 18 MFCCs plus normalized logenergy, and their delta and acceleration features.In the transformed models, reducing thenumber of MFCCs to 12 compensates for cepstralsmoothing and results in a standard 39-element vector.Test conditionsThe frequency warping factor was quantizedinto 16 log-spaced values between 1.0 and 1.7,representing the amount of frequency expansionof the adult model spectra. The two voicesource factors and the variance scaling factor,being judged as less informative, were quantizedinto 8 log-spaced values. The pole cut-offfrequencies were varied between 100 and 4000Hz and the variance scale factor ranged between1.0 and 3.0.The one-dimensional tree consists of 5 levelsand 16 leaf nodes. The four-dimensionaltree has the same number of levels and 8192leaves. The exhaustive grid search was not performedfor four dimensions, due to prohibitivecomputational requirements.The node selection criterion during the treesearch was varied to stop at different levels. Anadditional rule was to select the maximumlikelihoodnode of the traversed path from theroot to a leaf node. These were comparedagainst an exhaustive search among all leafnodes.156
<strong>Proceedings</strong>, FONETIK <strong>2009</strong>, Dept. of Linguistics, Stockholm UniversityTraining and recognition experiments wereconducted using HTK (Young et. al., 2005).Separate software was developed for the transformationand the model tree algorithms.Results and discussionRecognition results for the one- and fourelementspeaker profiles are presented in Table1 for different search criteria together with abaseline result for non-transformed models.The error rate of the one-dimensional treebasedsearch was as low as that of the exhaustivesearch at a fraction (25-50%) of the computationalload. This result is especially positive,considering that the latter search is guaranteedto find the global maximum-likelihoodspeaker vector.Even the profile-independent root node providessubstantial improvement compared to thebaseline result. Since there is no estimationprocedure involved, this saves considerablecomputation.In the four-dimensional speaker profile, thecomputational load is less than 1% of the exhaustivesearch. A minimum error rate isreached at a stop level two and three levels belowthe root. Four features yield consistent improvementsover the single feature, except forthe root criterion. Clearly, vocal tract length isvery important, but spectral slope and variancescaling also have positive contribution.Table 1. Number of recognition iterations and worderror rate for one and four-dimensional speakerprofile.Search No. iterations WER(%)alg.Baseline 1 32.21-D 4-D 1-D 4-DExhaustive16 8192 11.5 -Root 1 1 11.9 13.9Level 1 2 16 12.2 11.1Level 2 4 32 11.5 10.2Level 3 6 48 11.2 10.2Leaf 8 50 11.2 10.4Path-max 9 51 11.9 11.6Histograms of warp factors for individualutterances are presented in Figure 1. The distributionsfor exhaustive and 1-dimensional leafsearch are very similar, which corresponds wellwith their small difference in recognition errorrate. The 4-dimensional leaf search distributiondiffers from these, mainly in the peak region.The cause of its bimodal character calls for furtherinvestigation. A possible explanation maylie in the fact that the reference models aretrained on both male and female speakers. Distinctparts have probably been assigned in thetrained models for these two categories. Thetwo peaks might reflect that some utterancesare adjusted to the female parts of the modelswhile others are adjusted to the male parts. Thismight be better caught by the more detailedfour-dimensional estimation.Nbr utterances1201008060402001 1.2 1.4 1.6 1.8Warp factor1-dim exhaustive1-dim tree4-dim treeFigure 1. Histogram of estimated frequency warpfactors for the three estimation techniques.Figure 2 shows scatter diagrams for averagewarp factor per speaker vs. body height forone- and four-dimensional search. The largestdifference between the plots occurs for theshortest speakers, for which the fourdimensionalsearch shows more realistic values.This indicates that the latter makes more accurateestimates in spite of its larger deviationfrom a Gaussian distribution in Figure 1. Thisis also supported by a stronger correlation betweenwarp factor and height (-0.55 vs. -0.64).Warp factor1.61.51.41.31.21.1180 100 120 140 160Body height1.61.51.41.31.21.1180 100 120 140 160Body heightFigure 2. Scatter diagrams of warp factor vs. bodyheight for one- (left) and four-dimensional (right)search. Each sample point is an average of all utterancesof one speaker.The operation of the spectral shape compensationis presented in Figure 3 as an averagefunction over the speakers and for the twospeakers with the largest positive and negativedeviation from the average. The average functionindicates a slope compensation of the frequencyregion below around 500 Hz. This157
<strong>Proceedings</strong>, FONETIK <strong>2009</strong>, Dept. of Linguistics, Stockholm Universityshape may be explained as children havingsteeper spectral voice source slope than adults,but there may also be influence from differencesin the recording conditions between PF-Star and SPEECON.dB1812600 2000 4000 6000 8000 10000-6-12-18FrequencyMaximumAverageMinimumFigure 3. Transfer function of the voice sourcecompensation filter as an average over all testspeakers and the functions of two extreme speakers.The model variance scaling factor has anaverage value of 1.39 with a standard deviationof 0.11. This should not be interpreted as a ratiobetween the variability among children and thatof adults. This value is rather a measure of theremaining mismatch after compensation of theother features.ConclusionA tree-based search in the speaker profile spaceprovides recognition accuracy similar to an exhaustivesearch at a fraction of the computationalload and makes it practically possible toperform joint estimation in a larger number ofspeaker characteristic dimensions. Using fourdimensions instead of one increased the recognitionaccuracy and improved the property estimation.The distribution of the estimates ofthe individual property features can also provideinsight into the function of the recognitionprocess in speech production terms.STAR Children’s Speech Corpus, Proc. InterSpeech,2761-2764.Blomberg, M., and Elenius, D. (2008) InvestigatingExplicit Model Transformations forSpeaker Normalization. Proc. ISCA ITRWSpeech Analysis and Processing for KnowledgeDiscovery, Aalborg, Denmark,.Fant, G. and Kruckenberg, A. (1996) Voicesource properties of the speech code. TMH-QPSR 37(4), KTH, Stockholm, 45-56.Fant, G., Liljencrants, J. and Lin, Q. (1985) Afour-parameter model of glottal flow. STL-QPSR 4/1985, KTH, Stockholm, 1-13.Großkopf, B., Marasek, K., v. d. Heuvel, H.,Diehl, F., Kiessling, A. (2002) SPEECON -speech data for consumer devices: Databasespecification and validation, Proc. LREC.Lee, L. and Rose, R. C. (1998) A FrequencyWarping Approach to Speaker Normalisation,IEEE Trans. On Speech and AudioProcessing, 6(1): 49-60.Pitz, M. and Ney, H. (2005) Vocal Tract NormalizationEquals Linear Transformation inCepstral Space, IEEE Trans. On Speech andAudio Processing, 13(5):930-944.Potamianos A. and Narayanan S. (2003) RobustRecognition of Children’s Speech, IEEETrans. on Speech and Audio Processing,11(6):603-616.AcknowledgementsThis work was financed by the Swedish ResearchCouncil.ReferencesAkhil, P. T., Rath, S. P., Umesh, S. and Sanand,D. R. (2008) A Computationally EfficientApproach to Warp Factor Estimation inVTLN Using EM Algorithm and SufficientStatistics, Proc. Interspeech.Batliner, A., Blomberg, M., D’Arcy, S.,Elenius, D., Giuliani, D. (2002) The PF-158
<strong>Proceedings</strong>, FONETIK <strong>2009</strong>, Dept. of Linguistics, Stockholm University159
<strong>Proceedings</strong>, FONETIK <strong>2009</strong>, Dept. of Linguistics, Stockholm UniversityAuditory white noise enhances cognitive performanceunder certain conditions: Examples from visuo-spatialworking memory and dichotic listening tasksGöran G. B. W. Söderlund, Ellen Marklund, and Francisco LacerdaDepartment of Linguistics, Stockholm University, StockholmAbstractThis study examines when external auditivenoise can enhance performance in a dichoticlistening and a visuo-spatial working memorytask. Noise is typically conceived of as beingdetrimental for cognitive performance; however,given the mechanism of stochastic resonance(SR), a certain amount of noise can benefitperformance. In particular we predict thatlow performers will be aided by noise whereashigh performers decline in performance duringthe same condition. Data from two experimentswill be presented; participants were students atStockholm University.IntroductionAimThe aim of this study is to further investigatethe effects of auditory white noise on attentionand cognitive performance in a normal population.Earlier research from our laboratory hasfound that noise exposure can, under certainprescribed settings, be beneficial for performancein cognitive tasks, in particular for individualswith attentional problems such as AttentionDeficit/Hyperactivity Disorder (ADHD)(Söderlund et al., 2007). Positive effects ofnoise was also found in a normal population ofschool children among inattentive or lowachieving children (Söderlund & Sikström,2008). The purpose of this study is to includetwo cognitive tasks that has not earlier beenperformed under noise exposure. The first taskis the dichotic listening paradigm that measuresattention and cognitive control. The secondtask is a visuo-spatial working memory test thatmeasures working memory performance.Participants were students at Stockholm University.BackgroundIt has long been known that, under most circumstances,cognitive processing is easily disturbedby environmental noise and non-taskcompatible distractors (Broadbent, 1958). Theeffects hold across a wide variety of tasks, distractorsand participant populations (e.g. Bomanet al., 2005; Hygge et al., 2003). In contrastto the main body of evidence regardingdistractors and noise, there has been a numberof reports of counterintuitive findings. ADHDchildren performed better on arithmetic’s whenexposed to rock music (Abikoff et al., 1996;Gerjets et al., 2002). Children with low socioeconomicstatus and from crowded householdsperformed better on memory test when exposedto road traffic noise (Stansfeld et al., 2005).These studies did not, however, provide satisfactorytheoretical account for the beneficialeffect of noise, only referring to general increaseof arousal and general appeal counteractingboredom.Signaling in the brain is noisy, but thebrain possesses a remarkable ability to distinguishthe information carrying signal from thesurrounding, irrelevant noise. A fundamentalmechanism that contributes to this process isthe phenomenon of stochastic resonance (SR).SR is the counterintuitive phenomenon ofnoise-improved detection of weak signals in thecentral nervous system. SR makes a weak signal,below the hearing threshold, detectablewhen external auditory noise is added (Moss etal., 2004). In humans, SR has also been foundin the sensory modalities of touch (Wells et al.,2005), hearing (Zeng et al., 2000), and vision(Simonotto et al., 1999), all in which moderatenoise has been shown to improve sensory discrimination.However, the effect is not restrictedto sensory processing as SR has alsobeen found in higher functions e.g., auditorynoise improved the speed of arithmetic computationsin a group of school children (Usher &Feingold, 2000). SR is usually quantified byplotting detection of a weak signal, or cognitiveperformance, as a function of noise intensity.This relation exhibits an inverted U-curve,where performance peaks at a moderate noiselevel. That is, moderate noise is beneficial forperformance whereas too much, or too littlenoise, attenuates performance.160
<strong>Proceedings</strong>, FONETIK <strong>2009</strong>, Dept. of Linguistics, Stockholm UniversityAccording to the Moderate Brain Arousal(MBA) model (Sikström & Söderlund, 2007), aneurocomputational model of cognitive performancein ADHD, noise in the environment introducesinternal noise into the neural system tocompensate for reduced neural background activityin ADHD. This reduced neural activity isbelieved to depend on a hypo-functioning dopaminesystem in ADHD (Solanto, 2002). TheMBA model suggests that the amount of noiserequired for optimal cognitive performance ismodulated by dopamine levels and thereforediffers between individuals. Dopaminemodualtes neural responses and function byincreasing the signal-to-noise ratio throughenhanced differentiation between background,efferent firing and afferent stimulation (Cohenet al., 2002). Thus, persons with low levels ofdopamine will perform inferior in tasks thatdeserves a large signal-to-noise ratio. It isproposed that inattentive and/or low performingparticipants will benefit from noise whereasattentive or high performers will not.ExperimentsExperiment 1. Dichotic listeningDichotic literally means listening to two differentverbal signals (typically the syllables ba, da,ga, pa, ta, ka) presented at the same time, onepresented in the left ear and one in the right ear.The common finding is that participants aremore likely to report the syllable presented inthe right ear, a right ear advantage (REA)(Hugdahl & Davidson, 2003). During stimulusdriven bottom-up processing language stimuliare normally (in right-handers) perceived by theleft hemisphere that receive information fromthe contralateral right ear in a dichotic stimuluspresentation situation. If participants are instructedto attend to and report from the stimulipresented to the left ear, forced-left ear condition,this requires top-down processing to shiftattention from right to left ear. Abundant evidencefrom Hugdahl’s research group hasshown that this attentional shift is possible todo for healthy persons but not for clinicalgroups distinguished by attentional problemslike in: schizophrenia, depression, and ADHDwho generally fails to make this shift from rightto left ear (Hugdahl et al., 2003). The forcedleftsituation produces a conflict that requirescognitive control to be resolved.The purpose with present experiment is to findout whether noise exposure will facilitate cognitivecontrol in either forced-left ear, orforced-right ear condition in a group of students.Four noise levels will be used to determinethe most appropriate noise level.Experiment 2. Visuo-spatial memoryThe visuo-spatial working memory (vsWM)test is a sensitive measure of cognitive deficitsin ADHD (Westerberg et al., 2004). This testdetermines working memory capacity withoutbeing affected from previous skills or knowledge.Earlier research has shown that performingvsWM tasks mainly activates the right hemisphere,which indicates that the visou-spatialability is lateralized (Smith & Jonides, 1999).Research from our group has found that whitenoise exposure improve performance vsWM inboth ADHD and control children (Söderlund etal. manuscript). This finding rises the questionwhether lateralized noise (left or right ear) exposureduring vsWM encoding will affect performancedifferently.The purpose of the second experiment is tofind out if effects of noise exposure to the leftear will differ from exposure to the right ear.Control conditions will be noise exposure toboth ears and no noise. The prediction is thatnoise exposure to the left ear will affect performancein either positive or negative directionwhereas exposure to the right ear will be closeto the baseline condition, no noise.MethodsExperiment 1. Dichotic listeningParticipantsThirty-one students from Stockholm University,aged between 18 and 36 years (M=28,6), seventeenwomen and fourteen men. Twenty-ninewhere right-handed and two left-handed.Design and materialThe design was a 2 x 4, where attention (forcedleft vs. forced right ear) and noise level (nonoise, 50, 60, and 72 dB) were independentvariables (within subject manipulations). Dependentvariable was number of correct recalledsyllables. Speech signal was 64 dB. Interstimulusintervals were 4 seconds and 16 syllableswhere presented in each condition. Four161
<strong>Proceedings</strong>, FONETIK <strong>2009</strong>, Dept. of Linguistics, Stockholm Universitycontrol syllables (same in both ears) where presentedin each trial so maximum score was 12syllables. Participants were divided into twogroups after their aggregate performance in themost demanding, forced left ear condition, inthe four noise levels.ProcedureParticipants sat in a silent room in front of acomputer screen and responded by pressing thefirst letter of the perceived syllable on a keyboard.Syllables and noise where presentedthrough earphones. Conditions and syllableswere presented in random order and the experimentwas programmed in E-prime 1.2 (Psychologysoftware). Nine trials of stimuli werepresented; the first time was the non-forcedbaseline condition. The remaining eight trialswhere either forced left ear or forced right earpresented under the four noise conditions. Thetesting session lasted for approximately 20 minutes.Experiment 2. Visuo-Spatial WM taskParticipantsTwenty students at Stockholm University aged18-44 years (M=32,3), 9 men and 11 women. 3where left-handed and 17 right handed.Design and materialThe design was a 4 x 2, where noise (no noise,noise left ear, noise right ear, noise both ears)were the within subject manipulation and performancelevel (high vs. low performers) werethe between group manipulation. The noise levelwas set in accordance with earlier studies to77 dB. The visuo-spatial WM task (Spanboard<strong>2009</strong>) consists of red dots (memory stimuli)that are presented one at a time at a computerscreen in a four by four grid. Inter-stimulus intervalswere 4 seconds, target is shown 2 secand a 2 sec pause before next target turns up.Participants are asked to recall location, and theorder in which the red dots appear. The workingmemory load increases after every secondtrial and the WM capacity is estimated based onthe number of correctly recalled dots. Participantswere divided into two groups after theirperformance in the spanboard task, an aggregatemeasure of their result in all four conditions.The results for high performers wherebetween 197-247 points (n=9) and low performersbetween 109-177 points (n=11).yProcedureParticipants sat in a silent room in front of acomputer screen and responded by using themouse pointer. The noise was presented in headphones. Recall time is not limited and participantsclick on a green arrow when they decideto continue. Every participant performs the testfour times, one time in each noise condition.Order of noise conditions were randomized.ResultsExperiment 1. Dichotic listeningIn the non-forced baseline condition a significantright ear advantage was shown. A maineffect of attention was found in favor for theright ear, more syllables were recalled in theforced right ear condition in comparison withthe forced left ear, (Figure 1). There was nomain effect of noise while noise affected conditionsdifferently. An interaction between attentionand noise was found (F(28,3) = 5.66, p =.004) In the forced left condition noise exposuredid not affect performance at all, the small increasein the lowest noise condition was nonsignificant.A facilitating effect of noise wasfound in the forced right ear condition, themore noise the better performance (F(30,1) =5.63, p = .024).8.07.57.06.56.05.55.04.54.0Recall as a Function of Attention and NoiseNoise, p = .024Left EarRight earN1 N2 N3 N4Noise LevelsNoise x attention, p = .004Figure 1. Number correct recalled syllables as afunction of noise. Noise levels were N1= no noise,N2 = 50 dB, N3 = 60 dB, and N4 = 72 dB.When participants where divided according toperformance in the dichotic listening task, noiseimproved performance for both groups in theforced-right ear condition. A trend was found inns.162
<strong>Proceedings</strong>, FONETIK <strong>2009</strong>, Dept. of Linguistics, Stockholm UniversityNumber correct recalled dotsthe forced-left condition where high performersdeteriorated by noise and there was no changefor low performers (p = .094)Experiment 2. Visuo-spatial WM taskNo effect of noise was present when the entiresample was investigated. However, when participantswere divided into two groups based ontheir test performance a two way ANOVA revealeda trend towards interaction between lateralizednoise and group (F(16,3)=2.95,p=.065). When noise exposure to both ears wasexcluded from the ANOVA it did reach significance(F(17,2)=4.13, p=.024). Further interactionswere found between group and nonoise vs. noise left ear (F(18,1)= 8.76, p=.008)and between left ear and right ear(F(18,1)=4.59, p=.046). No interaction wasfound between group and noise right ear vs.noise both ears (Figure 2).6055504540353025Recall as a Function of Noise and Groupoverall: noise x group p = .065p = .008 p = .046 ns.High PerformersLow PerformersNo noise Noise left Noise right Noise bothFigure 2. Number correct recalled dots as a functionof laterlized noise. (77 dB, left ear, right ear, bothears, or no noise)Noteworthy is that the low performing groupconsisted nine women and two men whereasthe high performing group consisted of twowomen and seven men. However the genderand noise interaction did not reach significancebut indicated a trend (p= .096).Paired samples t-test showed that the noiseincrement in left ear for the low performinggroup was significant (t(10)=2.25, p=.024 onetailed) and the decrement for the high performinggroup in the same condition significant aswell (t(8)=1.98, p=.042 one tailed).ConclusionsThe rationale behind these two studies was toinvestigate effects of noise in two cognitivetasks that put high demands on executive functionsand working memory in a normal population.Results showed that there was an effect ofnoise in both experiments. In the dichotic listeningexperiment there was a main effect ofnoise derived from the forced-right ear condition.In the visuo-spatial working memory taskthere was no main effect of noise. However,when you split the group in two, high and lowperformers, you get significant results in accordancewith predictions.The most intriguing result in the presentstudy is the lateralization effect of noise exposurein the visuo-spatial working memory task.Firstly, we have shown that the noise effect iscross modal, auditory noise exerted an effect ona visual task. Secondly, the pattern of high andlow performers was inverted (in all conditions).The lateralization effect could have two possibleexplanations; the noise exposure to the righthemisphere either interacts with the rightdominantlateralized task specific activation inthe visuo-spatial task, or it activates crucial attentionalnetworks like the right dorsolateralpre-frontal cortex (Corbetta & Shulman, 2002).In the dichotic listening experiment we onlygot effects in the easy, forced-right ear condition,that owes a large signal-to-noise ratio. Themore demanding forced-left ear condition mayget improved by noise exposure when exposedto inattentive, ADHD participants, this will betested in upcoming experiments.To gain such prominent group effects despitethe homogeneity of the group consistingof university students demonstrates a large potentialfor future studies on participants withattentional problems, such as in ADHD.AcknowledgementsData collection was made by students from theDepartment of Linguistics and from students atthe speech therapist program. This research wasfunded by a grant from Swedish ResearchCouncil (VR 421-2007-2479).163
<strong>Proceedings</strong>, FONETIK <strong>2009</strong>, Dept. of Linguistics, Stockholm UniversityReferencesAbikoff, H., Courtney, M. E., Szeibel, P. J., &Koplewicz, H. S. (1996). The effects of auditorystimulation on the arithmetic performanceof children with ADHD and nondisabledchildren. Journal of Learning Disabilities,29(3), 238-246.Boman, E., Enmarker, I., & Hygge, S. (2005).Strength of noise effects on memory as afunction of noise source and age. NoiseHealth, 7(27), 11-26.Broadbent, D. E. (1958). The effects of noiseon behaviour. In. Elmsford, NY, US: PergamonPress, Inc.Cohen, J. D., Braver, T. S., & Brown, J. W.(2002). Computational perspectives on dopaminefunction in prefrontal cortex. CurrentOpinion in Neurobiology, 12(2), 223-229.Corbetta, M., & Shulman, G. L. (2002). Controlof goal-directed and stimulus-driven attentionin the brain. Nature Reviews. Neuroscience,3(3), 201-215.Gerjets, P., Graw, T., Heise, E., Westermann,R., & Rothenberger, A. (2002). Deficits ofaction control and specific goal intentions inhyperkinetic disorder. II: Empirical results/Handlungskontrolldefiziteund störungsspezifischeZielintentionen bei derHyperkinetischen Störung: II: EmpirischeBefunde. Zeitschrift für Klinische Psychologieund Psychotherapie: Forschung undPraxis, 31(2), 99-109.Hugdahl, K., & Davidson, R. J. (2003). Theasymmetrical brain. Cambridge, MA, US:MIT Press, 796.Hugdahl, K., Rund, B. R., Lund, A., Asbjornsen,A., Egeland, J., Landro, N. I., et al.(2003). Attentional and executive dysfunctionsin schizophrenia and depression: evidencefrom dichotic listening performance.Biological Psychiatry, 53(7), 609-616.Hygge, S., Boman, E., & Enmarker, I. (2003).The effects of road traffic noise and meaningfulirrelevant speech on different memorysystems. Scandinavian Journal Psychology,44(1), 13-21.Moss, F., Ward, L. M., & Sannita, W. G.(2004). Stochastic resonance and sensory informationprocessing: a tutorial and reviewof application. Clinical Neurophysiology,115(2), 267-281.Sikström, S., & Söderlund, G. B. W. (2007).Stimulus-dependent dopamine release in attention-deficit/hyperactivitydisorder. PsychologicalReview, 114(4), 1047-1075.Simonotto, E., Spano, F., Riani, M., Ferrari, A.,Levero, F., Pilot, A., et al. (1999). fMRIstudies of visual cortical activity duringnoise stimulation. Neurocomputing: An InternationalJournal. Special double volume:Computational neuroscience: Trends in research1999, 26-27, 511-516.Smith, E. E., & Jonides, J. (1999). Storage andexecutive processes in the frontal lobes.Science, 283(5408), 1657-1661.Solanto, M. V. (2002). Dopamine dysfunctionin AD/HD: integrating clinical and basicneuroscience research. Behavioral BrainResearch, 130(1-2), 65-71.Stansfeld, S. A., Berglund, B., Clark, C., Lopez-Barrio,I., Fischer, P., Ohrstrom, E., etal. (2005). Aircraft and road traffic noiseand children's cognition and health: a crossnationalstudy. Lancet, 365(9475), 1942-1949.Söderlund, G. B. W., & Sikström, S. (2008).Positive effects of noise on cogntive performance:Explaining the Moderate BrainArousal Model. <strong>Proceedings</strong> from ICBEN,International Comission on the BiologicalEffects of Noise.Söderlund, G. B. W., Sikström, S., & Smart, A.(2007). Listen to the noise: Noise is beneficialfor cognitive performance in ADHD.Journal of Child Psychology and Psychiatry,48(8), 840-847.Usher, M., & Feingold, M. (2000). Stochasticresonance in the speed of memory retrieval.Biological Cybernetics, 83(6), L11-16.Wells, C., Ward, L. M., Chua, R., & TimothyInglis, J. (2005). Touch noise increases vibrotactilesensitivity in old and young. PsychologicalScience, 16(4), 313-320.Westerberg, H., Hirvikoski, T., Forssberg, H.,& Klingberg, T. (2004). Visuo-spatial workingmemory span: a sensitive measure ofcognitive deficits in children with ADHD.Child Neuropsychology, 10(3), 155-161.Zeng, F. G., Fu, Q. J., & Morse, R. (2000).Human hearing enhanced by noise. BrainResearch, 869(1-2), 251-255.164
<strong>Proceedings</strong>, FONETIK <strong>2009</strong>, Dept. of Linguistics, Stockholm University165
<strong>Proceedings</strong>, FONETIK <strong>2009</strong>, Dept. of Linguistics, Stockholm UniversityFactors affecting visual influence on heard vowel roundedness:Web experiments with Swedes and TurksHartmut TraunmüllerDepartment of Linguistics, University of StockholmAbstractThe influence of various general and stimulusspecificfactors on the contribution of vision toheard roundedness was investigated by meansof web experiments conducted in Swedish. Theoriginal utterances consisted of the syllables/ɡyːɡ/ and /ɡeːɡ/ of a male and a female speaker.They were synchronized with each other inall combinations, resulting in four stimuli thatwere incongruent in vowel quality, two of themadditionally in speaker sex. One of the experimentswas also conducted in Turkish, using thesame stimuli. The results showed that visiblepresence of lip rounding has a weaker effect onaudition than its absence, except for conditionsthat evoke increased attention, such as when aforeign language is involved. The results suggestthat female listeners are more susceptibleto vision under such conditions. There was nosignificant effect of age and of discomfort feltby being exposed to dubbed speech. A discrepancyin speaker sex did not lead to reducedinfluence of vision. The results also showed thathabituation to dubbed speech has no deterioratingeffect on normal auditory-visual integrationin the case of roundedness.IntroductionIn auditory speech perception, the perceptualweight of the information conveyed by the visibleface of a speaker can be expected to varywith many factors.1) The particular phonetic feature and system2) Language familiarity4) The individual speaker and speech style3) The individual perceiver5) Visibility of the face / audibility of the voice6) The perceiver’s knowledge about the stimuli7) Context8) Cultural factorsMost studies within this field have been concernedwith the perception of place of articulationin consonants, like McGurk and MacDonald(1976). These studies have shown that thepresence/absence of labial closure tends to beperceived by vision. As for vowels, it is knownthat under ideal audibility and visibility conditions,roundedness is largely heard by vision,while heard openness (vowel height) is hardlyat all influenced by vision (Traunmüller &Öhrström, 2007). These observations make itclear that the presence/absence of features tendsto be perceived by vision if their auditory cuesare subtle while their visual cues are prominent.Differences between phonetic systems are alsorelevant. When, e.g. an auditory [ɡ] is presentedin synchrony with a visual [b], this is likely tofuse into a [ɡ͡b] only for perceivers who arecompetent in a language with a [ɡ͡b]. Others aremore likely to perceive a [ɡ] or a consonantcluster. The observed lower visual influence inspeakers of Japanese as compared with English(Sekiyama and Burnham, 2008) represents amore subtle case, whose cause may lie outsidethe phonetic system.The influence of vision is increased whenthe perceived speech sounds foreign (Sekiyamaand Tohkura, 1993; Hayashi and Sekiyama,1998; Chen and Hazan, 2007). This is referredto as the “foreign-language effect”.The influence of vision varies substantiallybetween speakers and speaking styles (Munhallet al., 1996; Traunmüller and Öhrström, 2007).The influence of vision also varies greatlybetween perceivers. There is variation with age.Pre-school children are less sensitive (Sekiyamaand Burnham, 2004) although even prelinguisticchildren show influence of vision(Burnham and Dodd, 2004). There is also asubtle sex difference: Women tend to be moresusceptible to vision (Irwin et al., 2006;Traunmüller and Öhrström, 2007).The influence of vision increases with decreasingaudibility of the voice, e.g. due tonoise, and decreases with decreasing visibilityof the face, but only very litte with increasingdistance up to 10 m (Jordan, 2000).Auditory-visual integration works evenwhen there is a discrepancy in sex between avoice and a synchronized face (Green et al.,1991) and it is also robust with respect to whatthe perceiver is told about the stimuli. A minoreffect on vowel perception has, nevertheless,been observed when subjects were told the sex166
<strong>Proceedings</strong>, FONETIK <strong>2009</strong>, Dept. of Linguistics, Stockholm Universityrepresented by an androgynous voice (Johnson,Strand and d’Imperio, 1991).Auditory-visual integration is robust to semanticfactors (Sams et al, 1998) but it is affectedby context, e.g. the vocalic context ofconsonants (Shigeno, 2002). It can also be affectedby the experimental method (e.g.,blocked vs. random stimulus presentation).It has been suggested that cultural conventions,such as socially prescribed gaze avoidance,may affect the influence of vision (Sekiyamaand Tohkura, 1993; Sekiyama, 1997).Exposure to dubbed films is another culturalfactor that can be suspected to affect the influenceof vision. The dubbing of foreign moviesis a widespread practice that often affects nearlyall speakers of certain languages. Since indubbed speech, the sound is largely incongruentwith the image, habituation requires learning todisrupt the normal process of auditory-visualintegration. Considering also that persons whoare not habituated often complain about discomfortand mental pain when occasionally exposedto dubbed speech, it deserves to be investigatedwhether the practice of dubbing deterioratesauditory-visual integration more permanentlyin the exposed populations.The present series of web experiments hadthe primary aim of investigating (1) the effectsof the perceiver’s knowledge about the stimuliand (2) those of a discrepancy between face andvoice (male/female) on the heard presence orabsence of liprounding in front vowels.Additional factors considered, without beingexperimentally balanced, were (3) sex and(4) age of the perceiver, (5) discomfort feltfrom dubbed speech, (6) noticed/unnoticedphonetic incongruence and (7) listening vialoudspeaker or headphones.The experiments were conducted in Swedish,but one experiment was also conducted inTurkish. The language factor that may discloseitself in this way has to be interpreted with caution,since (8) the “foreign-language effect” remainsconfounded with (9) effects due to thedifference between the phonetic systems.Most Turks are habituated to dubbedspeech, since dubbing foreign movies into Turkishis fairly common. Some are not habituated,since such dubbing is not pervasive. This allowsinvestigating (10) the effect of habituationto dubbed speech. Since dubbing into Swedishis only rarely practiced - with performances intendedfor children - adult Swedes are rarelyhabituated to dubbed speech.MethodSpeakersThe speakers were two native Swedes, a maledoctoral student, 29 years (index ♂ ), and a femalestudent, 21 years (index ♀ ). These weretwo of the four speakers who served for the experimentsreported in Traunmüller andÖhrström (2007). For the present experiment, aselection of audiovisual stimuli from this experimentwas reused.Speech materialThe original utterances consisted of the Swedishnonsense syllables /ɡyːɡ/ and /ɡeːɡ/. Eachauditory /ɡyːɡ/ was synchronized with eachvisual /ɡeːɡ/ and vice-versa. This resulted in 2times 4 stimuli that were incongruent in vowelquality, half of them being, in addition, incongruentin speaker (male vs. female).ExperimentsFour experiments were conducted with instructionsin Swedish. The last one of these was alsotranslated and conducted in Turkish, using thesame stimuli. The number of stimuli was limitedto 5 or 6 in order to facilitate the recruitmentof subjects.Experiment 1Sequence of stimuli (in each case first vowel byvoice, second vowel by face):e ♂ e ♂ , e ♀ y ♂ x, y ♂ e ♀ x, e ♂ y ♂ n, y ♀ e ♀ nFor each of the five stimuli, the subjects wereasked for the vowel quality they heard.“x” indicates that the subjects were also askedfor the sex of the speaker.“n” indicates that the subjects were also askedwhether the stimulus was natural or dubbed.Experiment 2In this experiment, there were two congruentstimuli in the beginning. After these, the subjectswere informed that they would next be exposedto two stimuli obtained by cross-dubbingthese. The incongruent stimuli and their orderof presentation were the same as in Exp. 1. Sequenceof stimuli:e ♀ e ♀ , y ♂ y ♂ , e ♀ y ♂ , y ♂ e ♀ , e ♂ y ♂ n, y ♀ e ♀ n167
<strong>Proceedings</strong>, FONETIK <strong>2009</strong>, Dept. of Linguistics, Stockholm UniversityExperiment 3This experiment differed from Exp. 1 in an invertedchoice of speakers. Sequence of stimuli:e ♀ e ♀ , e ♂ y ♀ x, y ♀ e ♂ x, e ♀ y ♀ n, y ♂ e ♂ nExperiment 4This experiment differed from Exp. 1 only inthe order of stimulus presentation. It was conductednot only in Swedish but also in Turkish.Sequence of stimuli:e ♂ e ♂ , y ♂ e ♀ x, e ♀ y ♂ x, y ♀ e ♀ n, e ♂ y ♂ nSubjectsFor the experiments with instructions in Swedish,most subjects were recruited via web fora:Forumet.nu > Allmänt forum,Flashback Forum > Kultur > Språk,Forum <strong>för</strong> vetenskap och folkbildning,KP-webben > Allmänt prat (Exp. 1).Since young adult males dominate on these fora,except the last one, where girls aged 10-14years dominate, some additional adult femalesubjects were recruited by distribution of slipsin cafeterias at the university and in a concerthall. Most of the subjects of Exp. 2 were recruitedby invitation via e-mail. This was alsothe only method used for the experiment withinstructions in Turkish. This method resulted ina more balanced representation of the sexes, ascan be seen in Figure 1.ProcedureThe instructions and the stimuli were presentedin a window 730 x 730 px in size if notchanged by the subject. There were eight ornine displays of this kind, each with a heading‘Do you also hear with your eyes?’. The wholesession could be run through in less than 3 minutesif there were no cases of hesitation.The questions asked concerned the following:First general question, multiple response:• Swedish (Turkish) first language• Swedish (Turkish) best known language• Swedish (Turkish) most heard languageFurther general questions, alternative response:• Video ok | not so in the beginning | not ok• Listening by headphones | by loudspeaker• Heard well | not so | undecided.• Used to dubbed speech | not so | undecided.• Discomfort (obehag, rahatsızlık) fromdubbed speech | not so | undecided.• Male | Female• Age in years .... .• Answers trustable | not so.If one of the negations shown here in italics waschosen, the results were not evaluated. Excludedwere also cases in which more than onevowel failed to be responded to.The faces were shown on a small videoscreen, width 320 px, height 285 px. The heightof the faces on screen was roughly 55 mm (♂)and 50 mm (♀).The subjects were asked to lookat the speaker and to tell what they ‘heard’ ‘inthe middle (of the syllable)’. Each stimulus waspresented twice, but repetition was possible.Stimulus-specific questions:Vowel quality (Swedes):• i | e | y | ö | undecided (natural stimuli)• y | i | yi | undecided (aud. [y], vis. [e])• e | ö | eö | undecided (aud. [e], vis. [y])Swedish non-IPA letter: ö [ø].Vowel quality (Turks):• i | e | ü | ö | undecided (natural stimuli)• ü | üy | i | ı | undecided (aud. [y], vis. [e])• e | eö | ö | undecided (aud. [e], vis. [y])Turkish non-IPA: ü [y], ö [ø], ı [ɯ] and y [j].Fig. 1. Population pyramids for (from left to right) Exp. 1, 2, 3, 4 (Swedish version) and 4 (Turkish version).Evaluated subjects only. Males left, females right.168
<strong>Proceedings</strong>, FONETIK <strong>2009</strong>, Dept. of Linguistics, Stockholm University• Female sounding male | male looking female| undecided (when voice♂ & face♀)• Male sounding female | female lookingmale | undecided (when voice♀ & face♂)• Natural | dubbed | undecided (when speakercongruent, vowel incongruent)Upon completing the responses, these weretransmitted by e-mail to the experimenter, togetherwith possible comments by the subject,who was invited to an explanatory demonstration(http://legolas.ling.su.se/staff/hartmut/webexperiment/xmpl.se.htm, ...tk.htm).Subjects participating via Swedish web forawere informed within 15 minutes or so abouthow many times they had heard by eye.ResultsThe most essential stimulus specific results aresummarized in Table 1 for Exp. 1, 2 and 4 andin Table 2 for Exp. 3. Subjects who had not indicatedthe relevant language as their first ortheir best known language have been excluded.It can be seen in Table 1 and 2 that for eachauditory-visual stimulus combination, therewere only minor differences in the results betweenExp. 1, 2, and the Swedish version ofExp. 4. For combinations of auditory [e] andvisual [y], the influence of vision was, however,clearly smaller than that observed within theframe of the previous experiment (Traunmüllerand Öhrström, 2007), while it was clearlygreater in the Turkish version of Exp. 4. Absenceof lip rounding in the visible face hadgenerally a stronger effect than visible presenceof lip rounding, in particular among Swedes. Inthe Turkish version, there was a greater influenceof vision also for the combination of auditory[y] and visual [e], which was predominantlyperceived as an [i] and only seldom as [yj]among both Turks and Swedes. The response[ɯ] (Turkish only) was also rare. The proportionof visually influenced responses substantiallyexceeded the proportion of stimuli perceivedas undubbed, especially so amongTurks.The results from Exp. 3, in which thespeakers had been switched (Table 2), showedthe same trend that can be seen in Exp. 1, althoughvisible presence of roundedness had aprominent effect with the female speaker withinthe frame of the previous experiment.A subject-specific measure of the overall influenceof vision was obtained by counting theresponses in which there was any influence ofvision and dividing by four (the number of incongruentstimuli presented).A preliminary analysis of the results fromExp. 1 to 3 did not reveal any substantial effectsof habituation to dubbing, discomfort fromdubbing, sex or age.Table 2.Summary of stimulus specific results forExp. 3 arranged as in Table 1.StimulusVoice & FacePrev.exp.n=42,20 ♂, 22 ♀ OExp 3n=4741 ♂, 6 ♀Naty ♂ & e ♂ 79 4 81 66e ♀ & y ♀ 86 3 34 11y ♀ & e ♂ - 2 85e ♂ & y ♀ - 1 28Table 1. Summary of stimulus specific results from Exp. 1, 2, and 4: Percentage of cases showing influenceof vision on heard roundedness in syllable nucleus (monophthong or diphthong). No influence assumedwhen response was ‘undecided’. O: Order of presentation. Nat: Percentage of stimuli perceived as natural(undubbed) shown for stimuli without incongruence in sex. Corresponding results from previous experiment(Traunmüller and Öhrström, 2007) shown in leftmost column of figures.StimulusVoice & FacePrev.exp.n=42,20 ♂,22 ♀ OExp. 1n=185122 ♂,63 ♀ Nat OExp. 2Informedn=99,57 ♂,42 ♀ Nat OExp. 4Swedsn=84,73 ♂,11 ♀ NatExp. 4Turks,n=71,30 ♂,41 ♀ Naty ♀ & e ♀ 83 4 82 72 4 81 66 3 81 61 99 64e ♂ & y ♂ 50 3 26 15 3 25 11 4 23 9 79 23y ♂ & e ♀ - 2 80 2 65 1 75 94e ♀ & y ♂ - 1 41 1 42 2 52 83169
<strong>Proceedings</strong>, FONETIK <strong>2009</strong>, Dept. of Linguistics, Stockholm UniversityFor Exp. 4, the result of Chi-square tests of theeffects of subject-specific variables on the influenceof vision are listed in Table 3.Table 3. Effects of general variables (use of headphones,habituated to dubbing, discomfort fromdubbing, sex and age) on ”influence of vision”.n Swedes n TurksPhone use 25 of 83 0.02 12 of 68 0.11Habituated 7 of 81 0.7 53 of 68 0.054Discomfort 50 of 76 0.4 33 of 63 0.93Female 11 of 84 0.9 39 of 69 0.045Age 84 0.24 69Use of headphones had the effect of reducingthe influence of vision among both Swedes(significantly) and Turks (not significantly).Habituation to dubbed speech had no noticeableeffect among the few Swedes (7 of 81,9% habituated), but it increased(!) the influenceof vision to an almost significant extent amongTurks (53 of 68, 78% habituated).Discomfort felt from dubbed speech had nosignificant effect on the influence of vision.Such discomfort was reported by 66% of theSwedes and also by 52% of the Turks.Among Turks, females were significantlymore susceptible to vision than males, whilethere was no noticeable sex difference amongSwedes.DiscussionThe present series of web experiments disclosedan asymmetry in the influence of visionon the auditory perception of roundedness: Absenceof lip rounding in the visible face had astronger effect on audition than visible presenceof lip rounding. This is probably due to the factthat lip rounding (protrusion) is equally absentthroughout the whole visible stimulus whenthere is no rounded vowel. When there is arounded vowel, there is a dynamic roundinggesture, which is most clearly present only inthe middle of the stimulus. Allowing for someasynchrony, such a visible gesture is also compatiblewith the presence of a diphthong such as[eø], which was the most common responsegiven by Turks to auditory [e] dubbed on visual[y]. The reason for the absence of this asymmetryin the previous experiment (Traunmüllerand Öhrström, 2007). can be seen in the higherdemand of visual attention. In this previous experiment,the subjects had to identify randomizedstimuli, some of which were presentedonly visually. This is likely to have increasedthe influence of visual presence of roundedness.The present experiments had the aim of investigatingthe effects of1) a male/female face/voice incongruence,2) the perceiver’s knowledge about the stimuli,3) sex of perceiver,4) age of the perceiver,5) discomfort from dubbed speech,6) noticed/unnoticed incongruence,7) listening via loudspeaker or headphones,8) language and foreignness,9) habituation to dubbed speech.1) The observation that a drastic incongruencebetween face and voice did not cause asignificant reduction of the influence of visionagrees with previous findings (Green et al.,1991). It confirms that auditory-visual integrationoccurs after extraction of the linguisticallyinformative quality in each modality, i.e. afterdemodulation of voice and face (Traunmüllerand Öhrström, 2007b).2) Since the verbal information about thedubbing of the stimuli was given in cases inwhich the stimuli were anyway likely to be perceivedas dubbed, the negative results obtainedhere are still compatible with the presence of asmall effect of cognitive factors on perception,such as observed by Johnson et al. (1999).3) The results obtained with Turks confirmthat women are more susceptible to visual information.However, the results also suggestthat this difference is likely to show itself onlywhen there is an increased demand of attention.This was the case in the experiments byTraunmüller and Öhrström (2007) and it is alsothe case when listening to a foreign language,an unfamiliar dialect or a foreigner’s speech,which holds for the Turkish version of Exp. 4.The present results do not suggest that a sexdifference will emerge equally clearly whenTurks listen to Turkish samples of speech.4) The absence of a consistent age effectwithin the range of 10-65 years agrees withprevious investigations.5) The absence of an effect of discomfortfrom dubbed speech on influence of vision suggeststhat the experience of discomfort arises asan after-effect of speech perception.6) Among subjects who indicated a stimulusas dubbed, the influence of vision was reduced.This was expected, but it is in contrastwith the fact that there was no significant reductionwhen there was an obvious discrepancyin sex. It appears that only the discrepancy in170
<strong>Proceedings</strong>, FONETIK <strong>2009</strong>, Dept. of Linguistics, Stockholm Universitythe linguistically informative quality is relevant Green K. P., Kuhl P. K., Meltzoff A. N., andhere, and that an additional discrepancy betweenvoice and face can even make it more formatin across talkers, gender, and sensoryStevens E. B. (1991) Integrating speech in-difficult to notice the relevant discrepancy. This modality: Female faces and male voices inappears to have happened with the auditory e ♀ the McGurk effect. Perception and Psychophys50, 524–536.dubbed on the visual y ♂ (see Table 1).7) The difference between subjects listeningvia headphones and those listening via foreign language effect in the McGurk ef-Hayashi T., and Sekiyama K. (1998) Native-loudspeaker is easily understood: The audibility fect: a test with Chinese and Japanese.of the voice is likely to be increased when using AVSP’98, Terrigal, Australia.headphones, mainly because of a better signalto-noiseratio.Irwin, J. R., Whalen, D. H., and Fowler, C. A.http://www.isca-speech.org/archive/avsp98/8) The greater influence of vision among (2006) A sex difference in visual influenceTurks as compared with Swedes most likely on heard speech. Perception and Psychophysics,68, 582–592.reflects a “foreign language effect” (Hayashiand Sekiyama, 1998; Chen and Hazan, 2007). Johnson K., Strand A.E., and D’Imperio, M.To Turkish listeners, syllables such as /ɡyːɡ/ (1999) Auditory-visual integration of talkerand /ɡiːɡ/ sound as foreign since long vowels gender in vowel perception. Journal of Phonetics27, 359–384.occur only in open syllables and a final /ɡ/never in Turkish. Minor differences in vowel Jordan, T.R. (2000) Effects of distance on visualand audiovisual speech recognition. Lan-quality are also involved. A greater influence ofvision might perhaps also result from a higher guage and Speech 43, 107–124.functional load of the roundedness distinction, McGurk H., and MacDonald J. (1976) Hearingbut this load is not likely to be higher in Turkishthan in Swedish.748.lips and seeing voices. Nature 264, 746–9) The results show that habituation to Munhall, K.G., Gribble, P., Sacco, L., Ward, M.dubbed speech has no deteriorating effect on (1996) Temporal constraints on the McGurknormal auditory-visual integration in the case of effect. Perception and Psychophysics 58,roundedness. The counter-intuitive result showingTurkish habituated subjects to be influenced Sams, M., Manninen, P., Surakka, V., Helin, P.351–362.more often by vision remains to be explained. It and Kättö, R. (1998) McGurk effect in inshould be taken with caution since only 15 of Finnish syllables, isolated words, and wordsthe 68 Turkish subjects were not habituated to in sentences: Effects of word meaning anddubbing.sentence context. Speech Communication26, 75–87.AcknowledgementsShigeno, S. (2002) Influence of vowel contexton the audio-visual perception of voicedI am grateful to Mehmet Aktürk (Centre for Researchon Bilingualism at Stockholm Universi-Research 42, 155–167.stop consonants. Japanese Psychologicalty) for the translation and the recruitment of Sekiyama K., Tohkura Y. (1993) Inter-languageTurkish subjects. His service was financed differences in the influence of visual cues inwithin the frame of the EU-project CONTACT speech perception. Journal of Phonetics 21,(NEST, proj. 50101).427–444.Sekiyama, K., and Burnham, D. (2004) IssuesReferencesin the development of auditory-visualspeech perception: adults, infants, andBurnham, D., and Dodd, B. (2004) Auditoryvisualspeech integration by prelinguistic in-children, In INTERSPEECH-2004, 1137–1140.fants: Perception of an emergent consonantTraunmüller H., and Öhrström, N. (2007) Audiovisualperception of openness and lipin the McGurk effect. Developmental Psychobiology45, 204–220.rounding in front vowels. Journal of Phonetics35, 244–258.Chen, Y., and Hazan, V. (2007) Language effectson the degree of visual influence inTraunmüller H., and Öhrström, N. (2007b) Theaudiovisual speech perception. Proc. of the16 th auditory and the visual percept evoked byInternational Congress of Phoneticthe same audiovisual stimuli. In AVSP-Sciences, 2177–2180.2007, paper L4-1.171
<strong>Proceedings</strong>, FONETIK <strong>2009</strong>, Dept. of Linguistics, Stockholm UniversityBreathiness differences in male and female speech. IsH1-H2 an appropriate measure?Adrian P. SimpsonInstitute of German Linguistics, University of Jena, Jena, GermanyAbstractA wellestablished difference between male andfemale voices, at least in an AngloSaxon context,is the greater degree of breathy voice usedby women. The acoustic measure that has mostcommonly been used to validate this differenceare the relative strengths of the first and secondharmonics, H1H2. This paper suggests thatsexspecific differences in harmonic spacingcombined with the high likelihood of nasalitybeing present in the vocalic portions make theuse of H1H2 an unreliable measure in establishingsexspecific differences in breathiness.IntroductionOne aspect of male and female speech that hasattracted a good deal of interest are differencesin voice quality, in particular, breathy voice.Sex-specific differences in breathy voice havebeen examined from different perspectives. Hentonand Bladon (1985) examine behavioural differences,whereas in the model proposed byTitze (1989), differences in vocal fold dimensionspredict a constant dc flow during femalevoicing. In an attempt to improve the quality offemale speech synthesis, Klatt and Klatt (1990)use a variety of methods to analyse the amountof aspiration noise in the male and femalesource.A variety of methods have been proposed tomeasure breathiness:● Relative lowering of fundamental frequency(Pandit, 1957).● Presence of noise in the upper spectrum(Pandit, 1957; Ladefoged and AntoñanzasBarroso, 1985; Klatt and Klatt,1990).● Presence of tracheal poles/zeroes (Klattand Klatt, 1990).● Relationship between the strength of thefirst harmonic H1 and amplitude of thefirst formant A1 (Fischer-Jørgensen,1967; Ladefoged, 1983).● Relationship between the strength of thefirst and second harmonic, H1-H2 (Fischer-Jørgensen,1967; Henton andBladon, 1985; Huffman, 1987; Ladefogedand Antoñanzas Barroso, 1985;Klatt and Klatt, 1990).It is the last of these measures that has mostcommonly been applied to measuring sex-specificvoice quality differences.In this paper I set out to show that relatingthe strength of the first harmonic to other spectralmeasures as a way of comparing breathinessbetween male and female speakers is unreliable.The line of argumentation is as follows. The frequencyof the first nasal formant (F N1 ) can be estimatedto in the region of 200–350 Hz for bothmale and female speakers (Stevens et al., 1985;Maeda, 1993). At a typical male fundamentalfrequency of 120 Hz this will be expressed in anenhancement of the second and third harmonics.By contrast, at a typical female fundamental frequencyof over 200 Hz it may well be the firstharmonic that is more affected by F N1 . Comparisonof H1 and H2 as a measure of breathinesshas to be carried out on opener vowel qualitiesin order to minimise the effect of the first oralresonance, F1. Lowering of the soft palate isknown to increase with the degree of vowelopenness. Although the ratio of the opening intothe oral cavity and that into the nasal port is crucialfor the perception of nasality (Laver, 1980),acoustic correlates of nasality are present whenthe velopharyngeal port is open. It cannot be excluded,then, that any attempt to compare themale and female correlates of breathiness interms of the first harmonic might be confoundedby the sexspecific effects of F N1 on the first twoharmonics, in particular a relative strengtheningof the first female and the second male harmonic.Establishing that female voices are breathierthan male voices using the relative intensities ofthe first two harmonics might then be a selffulfillingprophecy.DataThe data used in this study are drawn from twosources. The first data set was collected as partof a study comparing nasometry and spectrographyin a clinical setting (Benkenstein, 2007).Seven male and fifteen female speakers wererecorded producing word lists, short texts andthe map task using the Kay Elemetrics Nasome-172
<strong>Proceedings</strong>, FONETIK <strong>2009</strong>, Dept. of Linguistics, Stockholm Universityter 6200. This method uses two microphonesseparated by an attenuating plate (20 dB separation)that capture the acoustic output of the noseand the mouth. A nasalance measure is calculatedfrom the relative intensity of the two signalsfollowing bandpass filtering of both at ca. 500Hz. The present study is interested only in asmall selection of repeated disyllabic oral andnasal words from this corpus so only the combinedand unfiltered oral and nasal signals willbe used. The second data set used is the publiclyavailable Kiel Corpus of Read Speech (IPDS,1994), which contains data from 50 Germanspeakers (25 female and 25 male) reading collectionsof sentences and short texts. Spectralanalysis of consonant-vowel-consonant sequencesanalogous to those from the first datasetwas carried out to ensure that the signals fromthe first dataset had not been adversely affectedby the relatively complex recording setup involvedwith the nasometer together with the subsequentaddition of the oral and nasal signals.Sex-specific harmonic expressionof nasalityThe rest of this paper will concern itself withdemonstrating sex-specific differences in theharmonic expression of nasality. In particular, Iwill show how F N1 is responsible for a greaterenhancement of the second male and the first(i.e. fundamental) female harmonic. Further, Iwill show that F N1 is expressed in precisely thosecontexts where one would want to measure H1-H2. In order to show how systematic the patternsacross different speakers are, individualDFT spectra from the same eight (four male,four female) speakers will be used. It is importantto emphasise that there is nothing specialabout this subset of speakers – any of the 22speakers could have been used to illustrate thesame patterns.We begin with spectral differences foundwithin nasals, i.e. uncontroversial cases of nasality.Figure 1 contains female and male spectrataken at the centre of the alveolar nasal in theword mahne (“warn”). From the strength of thelower harmonics, F N1 for both the male and femalespeakers is around 200–300 Hz, which iscommensurate with sweep-tone measurementsof nasals taken from Båvegård et al. (1993).Spectrally, this is expressed as a strengtheningprimarily of the first female and the second maleharmonic.It is reasonable to assume that the velum willbe lowered throughout the production of theFigure 1: DFT spectra calculated at midpointof [n] in mahne for four female (top) and fourmale speakers.word mahne. Figure 2 shows spectra taken fromthe same word tokens as shown in Figure 1, thistime calculated at the midpoint of the long openvowel in the first syllable. While there is a gooddeal of interindividual variation in the positionand amplitude of F1 and F2, due to qualitativedifferences as well as to the amount of vowelnasalisation present, there is clear spectral evidenceof F N1 , again to be found in the increasedintensity of the second male and the first female173
<strong>Proceedings</strong>, FONETIK <strong>2009</strong>, Dept. of Linguistics, Stockholm Universityharmonic.Figure 2: DFT spectra calculated at midpointof the open vowel in the first syllable ofmahne (same speakers).Neither nasals nor vocalic portions in a phonologicallynasal environment would be chosen assuitable contexts for measuring H1-H2. However,they do give us a clear indication of the spectralcorrelates of both vocalic and consonantalnasality, and in particular we were able to establishsystematic sex-specific harmonic differences.Figure 3: DFT spectra calculated at midpointof the open vowel in the first syllable of Pate(same speakers).Let us now turn to the type of context where onewould want to measure H1H2. The first syllableof the word Pate (“godfather”) contains a vowelin a phonologically oral context with an openquality which maximises F1 and hence minimisesits influence on the lower harmonics. Figure 3shows DFT spectra calculated at the midpoint ofthe long open vowel in tokens of the word Pate(“godfather”) for the same set of speakers. Incontrast to the categorically identical tokens in174
<strong>Proceedings</strong>, FONETIK <strong>2009</strong>, Dept. of Linguistics, Stockholm Universitythe nasalised environment in Figure 2, it issomewhat easier to estimate F1 and F2. However,the most striking similarity with the spectrain Figure 2 is evidence of a resonance in the region200–300 Hz, suggesting that here too,nasality is present, and as before is marked primarilyby a strengthened female fundamentaland a prominent second male harmonic.DiscussionIncreased spectral tilt is a reliable acoustic indicationof breathy voice. However, as I have attemptedto show in this paper, using the strengthof the first harmonic, without taking into considerationthe possibility that nasality may also beacoustically present, makes it an inappropriatepoint of reference when studying sexspecificdifferences. Indeed, data such as those shown inFigure 3 could have been used to show that inGerman, too, female speakers are more breathythan males. The female spectral tilt measured usingH1H2 is significantly steeper than that ofthe males.So, what of other studies? It is hard to makedirect claims about other studies in which individualspectra are not available. However, it isperhaps significant that Klatt and Klatt (1990)first added 10 dB to each H1 value before calculatingthe difference to H2, ensuring that theH1H2 difference is almost always positive(Klatt and Klatt, 1990: 829; see also e.g. Trittinand de Santos y Lleó, 1995 for Spanish). Themale average calculated at the midpoint of thevowels in reiterant [ʔɑ] and [hɑ] syllables is6.2 dB. This is not only significantly less thanthe female average of 11.9 dB, but also indicatesthat the male H2 in the original spectra is consistentlystronger, once the 10 dB are subtractedagain.I have not set out to show in this paper thatfemale speakers are less breathy than malespeakers. I am also not claiming that H1H2 isan unreliable measure of intraindividual differencesin breathiness, as it has been used in a linguisticcontext (Bickley, 1982). However, itseems that the method has been transferred fromthe study of intraindividual voice quality differencesto an interindividual context without consideringthe implications of other acoustic factorsthat confound its validity.ReferencesBenkenstein R. (2007) Vergleich objektiverVerfahren zur Untersuchung der Nasalität imDeutschen. Peter Lang, Frankfurt.Båvegård M., Fant G., Gauffin J. and LiljencrantsJ. (1993) Vocal tract sweeptone dataand model simulations of vowels, lateralsand nasals. STLQPSR 34, 43– 76.FischerJørgensen E. (1967) Phonetic analysis ofbreathy (murmured) vowels in Gujarati. IndianLinguistics, 71–139.Henton C. G. and Bladon R. A. W. (1985)Breathiness in normal female speech: Inefficiencyversus desirability. Language andCommunication 5, 221–227.Huffman M. K. (1987) Measures of phonationtype in Hmong. J. Acoust. Soc. Amer. 81,495–504.IPDS (1994) The Kiel Corpus of Read Speech.Vol. 1, CDROM#1. Institut für Phonetikund digitale Sprachverarbeitung, Kiel.Klatt D. H. and Klatt L. C. (1990) Analysis, synthesis,and perception of voice quality variationsamong female and male talkers. J.Acoust. Soc. Amer. 87, 820–857.Ladefoged P. (1983) The linguistic use of differentphonation types. In: Bless D. and Abbs J.(eds) Vocal Fold Physiology: ContemporaryResearch and Clinical Issues, 351–360. SanDiego: College Hill.Ladefoged P. and Antoñanzas Barroso N. (1985)Computer measures of breathy phonation.Working Papers in Phonetics, UCLA 61, 79–86.Laver J. (1980) The phonetic description ofvoice quality. Cambridge: Cambridge UniversityPress.Maeda S. (1993) Acoustics of vowel nasalizationand articulatory shifts in French nasalizedvowels. In: Huffman M. K. and KrakowR. A. (eds) Nasals, nasalization, and thevelum, 147–167. San Diego: AcademicPress.Pandit P. B. (1957) Nasalization, aspiration andmurmur in Gujarati. Indian Linguistics 17,165–172.Stevens K. N., Fant G. and Hawkins S. (1987)Some acoustical and perceptual correlates ofnasal vowels. In Channon R. and Shockey L.(eds) In Honor of Ilse Lehiste: Ilse LehistePüdendusteos, 241–254. Dordrecht: Foris.Titze I. R. (1989) Physiologic and acoustic differencesbetween male and female voices. J.Acoust. Soc. Amer. 85, 1699–1707.Trittin P. J. and de Santos y Lleó A. (1995)Voice quality analysis of male and femaleSpanish speakers. Speech Communication16, 359–368.175
<strong>Proceedings</strong>, FONETIK <strong>2009</strong>, Dept. of Linguistics, Stockholm UniversityEmotions in speech: an interactional framework forclinical applicationsAni Toivanen 1 & Juhani Toivanen 21 University of Oulu2 MediaTeam, University of Oulu & Academy of FinlandAbstractThe expression of emotion in human communicativeinteraction has been studied extensivelyin different theoretical paradigms (linguistics,phonetics, psychology). However, thereappears to be a lack of research focusing onemotion expression from a genuinely interactionalperspective, especially as far as the clinicalapplications of the research are concerned.In this paper, an interactional, clinicallyoriented framework for an analysis of emotionin speech is presented.IntroductionHuman social communication rests to a greatextent on non-verbal signals, including the(non-lexical) expression of emotion throughspeech. Emotions play a significant role in socialinteraction, both displaying and regulatingpatterns of behavior and maintaining the homeostaticbalance in the organism. In everydaycommunication, certain emotional states, forexample, boredom and nervousness, are probablyexpressed mainly non-verbally since socioculturalconventions demand that patently negativeemotions be concealed (a face-saving strategyin conversation).Today, the significance of emotions is largelyacknowledged across scientific disciplines,and “Descartes’ error” (i.e. the view that emotionsare “intruders in the bastion of reason”) isbeing corrected. The importance of emotions/affectis nowadays understood better, alsofrom the viewpoint of rational decision-making(Damasio, 1994).Basically, emotion in speech can be brokendown to specific vocal cues. These cues can beinvestigated at the signal level and at the symboliclevel. Such perceptual features ofspeech/voice vs. emotion/affect as “tense”,“lax”, “metallic” and “soft”, etc. can be tracedback to a number of continuously variableacoustic/prosodic features of the speech signal(Laver, 1994). These features are f0-related, intensity-related,temporal and spectral featuresof the signal, including, for example, average f0range, average RMS intensity, averagespeech/articulation rate and the proportion ofspectral energy below 1,000 Hz. At the symboliclevel, the distribution of tone types and focusstructure in different syntactic patterns can conveyemotional content.The vocal parameters of emotion may bepartially language-independent at the signallevel. For example, according to the “universalfrequency code” (Ohala, 1983), high pitch universallydepicts supplication, uncertainty anddefenseless, while low pitch generally conveysdominance, power and confidence. Similarly,high pitch is common when the speaker is fearful,such an emotion being typical of a “defenseless”state.An implicit distinction is sometimes madebetween an emotion/affect and an attitude (orstance in modern terminology) as it is assumedthat the expression of attitude is controlled bythe cognitive system that underpins fluentspeech in a normal communicative situation,while true emotional states are not necessarilysubject to such constraints (the speech effects inreal emotional situations may be biomechanicallydetermined by reactions not fully controlledby the cognitive system). It is, then,possible that attitude and emotion are expressedin speech through at least partly different prosodiccues (which is the taking-off point for thesymbolic/signal dichotomy outlined above).However, this question is not a straightforwardone as the theoretical difference between emotionand attitude has not been fully established.Emotions in speechBy now, a voluminous literature exists on theemotion/prosody interface, and it can be saidthat the acoustic/prosodic parameters of emotionalexpression in speech/voice are understoodrather thoroughly (Scherer, 2003). Thegeneral view is that pitch (fundamental frequency,f0) is perhaps the most important parameterof the vocal expression of emotion(both productively and perceptually); energy(intensity), duration and speaking rate are theother relevant parameters.176
<strong>Proceedings</strong>, FONETIK <strong>2009</strong>, Dept. of Linguistics, Stockholm UniversitySomewhat surprisingly, although the emotion/vocalcue interface in speech has been investigatedextensively, there is no widely accepteddefinition or taxonomy of emotion. Apparently,there is no standard psychologicaltheory of emotion that could decide the issueonce and for all: the number of basic (and secondary)emotions is still a moot point. Nevertheless,certain emotions are often considered torepresent “basic emotions”: at least fear, anger,happiness, sadness, surprise and disgust areamong the basic emotions (Cornelius, 1996).Research on the vocal expression of emotionhas been largely based on scripted noninteractionalmaterial; a typical scenario involvesa group of actors simulating emotionswhile reading out an emotionally neutral sentenceor text. There are now also databases containingnatural emotional speech, but these corpora(necessarily) tend to containblended/uncertain and mixed emotions ratherthan “pure” basic emotions (see Scherer, 2003,for a review).Emotions in speech: clinical investigationsThe vocal cues of affect have been investigatedalso in clinical settings, i.e. with a view tocharting the acoustic/prosodic features of certainemotional states (or states of emotionaldisorders or mental disorders). For example, itis generally assumed that clinical depressionmanifests itself in speech in a way which issimilar to sadness (a general, “non-morbid”emotional state). Thus, a decreased average f0,a decreased f0 minimum, and a flattened f0range are common, along with decreased intensityand a lower rate of articulation (Scherer,2000). Voiced high frequency spectral energygenerally decreases. Intonationally, sadness/depressionmay typically be associatedwith downward directed f0 contours.Psychiatric interest in prosody has recentlyshed light on the interrelationship betweenschizophrenia and (deficient or aberrant) prosody.Several investigators have argued that schizophrenicsrecognize emotion in speech considerablyworse than members of the normalpopulation. Productively, the situation appearsquite similar, i.e. schizophrenics cannot conveyaffect through vocal cues as consistently andeffectively as normal subjects (Murphy & Cutting,1990). In the investigation by Murphy &Cutting (1990), a group of schizophrenics wereto express basic emotions (neutral, angry, surprise,sad) while reading out a number of sentences.The raters (normal subjects) had significantdifficulty recognizing the simulated emotions(as opposed to portrayals of the sameemotions by a group representing the normalpopulation).In general, it has been found out that speechand communication problems typically precedethe onset of psychosis; dysarthria and dysprosodyappear to be common. Affective flatteningis indeed a diagnostic component of psychosis(along with, for example, grossly disorganizedspeech), and anomalous prosody (e.g. a lack ofany observable speech melody) may thus be anessential part of the dysprosody evident in psychosis(Golfarb & Bekker, <strong>2009</strong>). Moreover,schizophrenics’ speech seems to contain morepauses and hesitation features than normalspeech (Covington et al., 2005). Interestingly,although depressed persons’ speech also typicallycontains a decreased amount of speech perthe speech situation, the distribution of pausesappears to be different from schizophrenicspeech: schizophrenics typically pause in“wrong” (syntactically/semantically) unmotivatedplaces, while the pausing is more logicaland grammatical in depressed speech. Schizophrenicspeech thus seems to reflect the erraticsemantic structure of what is said (Clemmer,1980).It would be fascinating to think that certainprosodic features (or their absence) could be ofhelp for the general practitioner when diagnosingmental disorders. Needless to say, such featurescould never be the only diagnostic toolbut, in the best scenario, they would providesome assistive means for distinguishing betweensome alternative diagnostic possibilities.Emotions in speech: an interactionalclinical approachIn the following sections we outline a preliminaryapproach to investigating emotionalspeech and interaction within a clinical context.What follows is, at this stage, a proposal ratherthan a definitive research agenda.Prosodic analysis: 4-Tone EVoOur first proposal concerns the prosodic annotationprocedure for a speech material producedin a (clinical) setting inducing emotionally ladenspeech. As is well known, ToBI labeling(Beckman & Ayers, 1993) is commonly used inthe prosodic transcription of (British and Amer-177
<strong>Proceedings</strong>, FONETIK <strong>2009</strong>, Dept. of Linguistics, Stockholm Universityican) English (and the system is used increasinglyfor the prosodic annotation of other languages,too), and good inter-transcriber consistencycan be achieved as long as the voice qualityanalyzed represents normal (modal) phonation.Certain speech situations, however, seemto consistently produce voice qualities differentfrom modal phonation, and the prosodic analysisof such speech data with traditional ToBIlabeling may be problematic. Typical examplesare breathy, creaky and harsh voice qualities.Pitch analysis algorithms, which are used toproduce a record of the fundamental frequency(f0) contour of the utterance to aid the ToBIlabeling, yield a messy or lacking f0 track onnon-modal voice segments. Non-modal voicequalities may represent habitual speaking stylesor idiosyncrasies of speakers but they are oftenprosodic characteristics of emotional discourse(sadness, anger, etc.). It is likely, for example,that the speech of a depressed subject is to asignificant extent characterized by low f0 targetsand creak. Therefore, some special (possiblyemotion-specific) speech genres (observedand recorded in clinical settings) might be problematicfor traditional ToBI labeling.A potential modified system would be “4-Tone EVo” – a ToBI-based framework for transcribingthe prosody of modal/non-modal voicein (emotional) English. As in the original ToBIsystem, intonation is transcribed as a sequenceof pitch accents and boundary pitch movements(phrase accents and boundary tones). The originalToBI break index tier (with four strengthsof boundaries) is also used. The fundamentaldifference between 4-Tone EVo and the originalToBI is that four main tones (H, L, h, l) areused instead of two (H, L). In 4-Tone EVo, Hand L are high and low tones, respectively, asare “h” and “l”, but “h” is a high tone with nonmodalphonation and “l” a low tone with nonmodalphonation. Basically, “h” is H without aclear pitch representation in the record of f0contour, and “l” is a similar variant of L.Preliminary tests for (emotional) Englishprosodic annotation have been made using themodel, and the results seem promising (Toivanen,2006). To assess the usefulness of 4-ToneEVo, informal interviews with British exchangestudents (speakers of southern British English)were used (with permission obtained from thesubjects). The speakers described, among otherthings, their reactions to certain personal dilemmas(the emotional overtone was, predictably,rather low-keyed).The discussions were recorded in a soundtreatedroom; the speakers’ speech data wasrecorded directly to hard disk (44.1 kHz, 16 bit)using a high-quality microphone. The interactionwas visually recorded with a high-qualitydigital video recorder directly facing the speaker.The speech data consisted of 574 orthographicwords (82 utterances) produced bythree female students (20-27 years old). FiveFinnish students of linguistics/phonetics listenedto the tapes and watched the video data;the subjects transcribed the data prosodicallyusing 4-Tone EVo. The transcribers had beengiven a full training course in 4-Tone EVo stylelabeling. Each subject transcribed the materialindependently of one another.As in the evaluation studies of the originalToBI, a pairwise analysis was used to evaluatethe consistency of the transcribers: the label ofeach transcriber was compared against the labelsof every other transcriber for the particularaspect of the utterance. The 574 words weretranscribed by the five subjects; thus a total of5740 (574x10 pairs of transcribers) transcriberpair-wordswere produced. The following consistencyrates were obtained: presence of pitchaccent (73 %), choice of pitch accent (69 %),presence of phrase accent (82 %), presence ofboundary tone (89 %), choice of phrase accent(78 %), choice of boundary tone (85 %), choiceof break index (68 %).The level of consistency achieved for 4-Tone EVo transcription was somewhat lowerthan that reported for the original ToBI system.However, the differences in the agreement levelsseem quite insignificant bearing in mindthat 4-Tone EVo uses four tones instead of two!Gaze direction analysisOur second proposal concerns the multimodalityof a (clinical) situation, e.g. a patient interview,in which (emotional) speech is produced.It seems necessary to record the interactive situationas fully as possible, also visually. In aclinical situation, where the subject’s overallbehavior is being (at least indirectly) assessed,it is essential that other modalities than speechbe analyzed and annotated. Thus, as far as emotionexpression and emotion evaluation in interactionare concerned, the coding of the visuallyobservable behavior of the subject should be astandard procedure. We suggest that, after recordingthe discourse event with a video recorder,the gaze of the subject is annotated asfollows. The gaze of the subject (patient) may178
<strong>Proceedings</strong>, FONETIK <strong>2009</strong>, Dept. of Linguistics, Stockholm Universitybe directed towards the interlocutor (+directedgaze) or shifted away from the interlocutor (-directed gaze). The position of the subject relativeto the interlocutor (interviewer, clinician)may be neutral (0-proxemics), closer to the interlocutor(+proxemics) or withdrawn from theinterlocutor (-proxemics). Preliminary studiesindicate that the inter-transcriber consistencyeven for the visual annotation is promising(Toivanen, 2006).Post-analysis: meta-interviewOur third proposal concerns the interactionalityand negotiability of a (clinical) situation yieldingemotional speech. We suggest that, at somepoint, the subject is given an opportunity toevaluate and assess his/her emotional (speech)behavior. Therefore, we suggest that the interviewer(the clinician) will watch the video recordingtogether with the subject (the patient)and discuss the events of the situation. The aimof the post-interview is to study whether thesubject can accept and/or confirm the evaluationsmade by the clinician. An essential questionwould seem to be: are certain (assumed)manifestations of emotion/affect “genuine”emotional effects caused by the underlyingmental state (mental disorder) of the subject, orare they effects of the interactional (clinical)situation reflecting the moment-by-moment developingcommunicative/attitudinal stances betweenthe speakers? That is, to what extent isthe speech situation, rather than the underlyingmental state or mood of the subject, responsiblefor the emotional features observable in the situation?We believe that this kind of postinterviewwould enrich the clinical evaluationof the subject’s behavior. Especially after atreatment, it would be useful to chart the subject’sreactions to his/her recorded behavior inan interview situation: does he/she recognizecertain elements of his/her behavior being dueto his/her pre-treatment mental state/disorder?ConclusionThe outlined approach to a clinical evaluationof an emotional speech situation reflects theSystemic Approach: emotions, along with otheraspects of human behavior, serve to achieveintended behavioral and interactional goals inco-operation with the environment. Thus, emotionsare always reactions also to the behavioralacts unfolding in the moment-by-moment faceto-faceinteraction (in real time). In addition,emotions often reflect the underlying long-termaffective state of the speaker (possibly includingmental disorders in some subjects). Ananalysis of emotions in a speech situation musttake these aspects into account, and a speechanalyst doing research on clinical speech materialshould see and hear beyond “prosodemes”and given emotional labels when looking intothe data.ReferencesBeckman M.E. and Ayers G.M. (1993) Guidelinesfor ToBI Labeling. Linguistics Department,Ohio State University.Clemmer E.J. (1980) Psycholinguistic aspectsof pauses and temporal patterns in schizophrenicspeech. Journal of PsycholinguisticResearch 9, 161-185.Cornelius R.R. (1996) The science of emotion.Research and tradition in the psychology ofemotion. New Jersey: Prentice-Hall.Covington M, He C., Brown C., Naci L.,McClain J., Fjorbak B., Semple J. andBrown J. (2005) Schizophrenia and thestructure of language: the linguist’s view.Schizophrenia Research 77, 85-98.Damasio A. (1994) Descartes’ error. NewYork: Grosset/Putnam.Golfarb R. and Bekker N. (<strong>2009</strong>) Noun-verbambiguity in chronic undifferentiated schizophrenia.Journal of Communication Disorders42, 74-88.Laver J. (1994) Principles of phonetics. Cambridge:Cambridge University Press.Murphy D. and Cutting J. (1990) Prosodiccomprehension and expression in schizophrenia.Journal of Neurology, Neurosurgeryand Psychiatry 53, 727-730.Ohala J. (1983) Cross-language use of pitch: anethological view. Phonetica 40, 1-18.Scherer K.R. (2000) Vocal communication ofemotion. In Lewis M. and Haviland-Jones J.(eds.) Handbook of Emotions, 220-235.New York: The Guilford Press.Scherer K.R. (2003) Vocal communication ofemotion: a review of research paradigms.Speech Communication 40, 227-256.Toivanen J. (2006) Evaluation study of “4-ToneEVo”: a multimodal transcription model foremotion in voice in spoken English. In ToivanenJ. and Henrichsen P. (eds.) CurrentTrends in Research on Spoken Language inthe Nordic Countries, 139-140. Oulu University& CMOL, Copenhagen BusinessSchool: Oulu University Press.179
<strong>Proceedings</strong>, FONETIK <strong>2009</strong>, Dept. of Linguistics, Stockholm UniversityEarwitnesses: The effect of voice differences in identificationaccuracy and the realism in confidence judgmentsElisabeth Zetterholm 1 , Farhan Sarwar 2 and Carl Martin Allwood 31 Centre for Languages and Literature, Lund University2 Department of Psychology, Lund University3 Department of Psychology, University of GothenburgAbstractIndividual characteristic features in voice andspeech are important in earwitness identification.A target-absent lineup with six foils wasused to analyze the influence of voice andspeech features on recognition. The participants’response for two voice foils were particularlysuccessful in the sense that they weremost often rejected. These voice foils werecharacterized by the features’ articulation rateand pitch in relation to the target voice. For thesame two foils the participants as a collectivealso showed marked underconfidence and especiallygood ability to separate correct andincorrect identifications by means of their confidencejudgments for their answers to the identificationquestion. For the other four foils theparticipants showed very poor ability to separatecorrect from incorrect identification answersby means of their confidence judgments.IntroductionThis study focuses on the effect of some voiceand speech features on the accuracy and the realismof confidence in earwitnesses’ identifications.More specifically, the study analyzes theinfluence of characteristic features in thespeech and voices of the target speaker and thefoils in a target-absent lineup on identificationresponses and the realism in the confidence thatthe participants feel for these responses. Thistheme has obvious relevance for forensic contexts.Previous research with voice parades hasoften consisted of speech samples from laboratoryspeech, which is not spontaneous (Cook &Wilding, 1997; Nolan, 2003). In spontaneousspeech in interaction with others, the assumptionis that the speakers might use anotherspeaking style compared with laboratoryspeech. In forensic research spontaneousspeech is of more interest since that is a morerealistic situation.Sex, age and dialect seem to be strong anddominant features in earwitness identification(Clopper et al, 2004; Eriksson et al., 2008; Lasset al., 1976; Walden et al., 1978). In these studies,there is nothing about how the witness’confidence and its’ realism is influenced bythese features.The study presented in this paper focuses onthe influence of differences and similarities invoice and speech between a target voice and sixfoils in a lineup. A week passed between theoriginal presentation of the target speaker (atfor example the crime event) and the lineup,which means that there is also a memory effectfor the listeners participating in the lineup.Spontaneous speech is used in all recordingsand only male native Swedish speakers.Confidence and realism in confidenceIn this study, a participant’s confidence in hisor her response to a specific voice in a voiceparade with respect to if the voice belongs tothe target or not, relates to whether this responseis correct or not. Confidence judgmentsare said to be realistic when they match the correctness(accuracy) of the identification responses.Various aspects of realism can bemeasured (Yates, 1994). For example, the over-/underconfidence measure indicates whetherthe participant’s (or group’s) level of confidencematches the level of the accuracy of theresponses made. It is more concretely computedas: Over-/underconfidence = (The meanconfidence) minus (The mean accuracy).Another aspect of the realism is measuredby the slope measure. This measure concerns aparticipant’s (or group’s) ability, by means ofone’s confidence judgments, to, as clearly aspossible, separate correct from incorrect judgments.This measure is computed as: Slope =(The mean confidence for correct judgments)minus (The mean confidence for incorrectjudgments). The relation between a participant’slevel of confidence for a voice with a180
<strong>Proceedings</strong>, FONETIK <strong>2009</strong>, Dept. of Linguistics, Stockholm Universityspecific characteristic compared with the participant’sconfidence for the other voices in thelineup might indicate how important that characteristicis for the participant’s judgment. In aforensic context the level of realism indicateshow useful a participant’s confidence judgmentsare in relation to targets’ and foils’voices with specific features.MethodParticipants100 participants took part in the experiment.The mean age was 27 years. There were 42males and 58 females. 15 participants had anothermother tongue than Swedish, but they allspeak and understand Swedish. Four of themarrived in Sweden as teenagers or later. Fiveparticipants reported minor impaired hearingand four participants reported minor speechimpediment, one of them stuttering.MaterialsThe dialogue of two male speakers was recorded.They played the role of two burglarsplanning to break into a house. This recordingwas about 2 minutes long and was used as thefamiliarization passage, that is, as the originalexperienced event later witnessed about. Thespeakers were 27 and 22 year old respectivelywhen recorded and both speak with a Scaniandialect. The 22 years old speaker is the targetand he speaks most of the time in the presentedpassage.The lineup in this study used recordings ofsix male speakers. It was spontaneous speechrecorded as a dialogue with another malespeaker. This male speaker was the same in allrecordings and that was an advantage since hewas able to direct the conversation. They alltalked about the same topic, and they all hadsome kind of relation to it since it was an ordinarysituation. As a starting point, to get differentpoints of view on the subject talked aboutand as a basis for their discussion, they all readan article from a newspaper. It had nothing todo with forensics. The recordings used in thelineups were each about 25 sec long and only apart of the original recordings, that is, the maleconversation partner is not audible in the lineups.All the six male speakers have a Scaniandialect with a characteristic uvular /r/ and aslightly diphthongization. They were chosenfor this study because (as described in more detailbelow) they share, or do not share, differentfeatures with the target speaker. It is featuressuch as pitch, articulation rate, speaking styleand overall tempo and voice quality.The target speaker has a mean F0 (meanfundamental frequency) of 107 Hz, see Table 1.The speech tempo is high overall and he has analmost forced speaking style with a lot of hesitationsounds and repetition of syllables whenhe is excited in the familiarization passage. Theacoustic analysis confirms a high articulationrate.Foil 1 and 2 are quite close in their speechand voices in the auditory analysis. Both speakwith a slightly creaky voice quality, althoughfoil 2 has a higher mean F0. Their articulationrate is quite high and close to the targetspeaker. Foil 3 and 6 speak with a slowerspeech tempo and a low and a high pitch respectivelyis audible. In the acoustic analysis itis also obvious that both foil 3 and 6 have anarticulation rate which is lower than the targetspeaker. Foil 4 is the speaker who is closest tothe target speaker concerning pitch and speakingstyle. He speaks with a forced, almost stutteringvoice when he is keen to explain something.His articulation rate is high and he alsouses a lot of hesitation sounds and filled pauses.Foil 5 has quite a high articulation rate, in similarityto the target speaker, but he has a higherpitch and his dialect is not as close to the targetspeaker as the other foils.All the speakers, including the targetspeaker, are almost the same age, see Table 1.The results of the acoustic measurements ofmean fundamental frequency (F0) and std.dev.are also shown in the table. The perceptualauditory impression concerning the pitch isconfirmed in the acoustic analysis.Table 1. Age, F0 mean and standard deviations(SDs) for the target speaker and the six foilsAge F0, mean SDs.target 22 107 Hz 16 Hzfoil 1 23 101 Hz 26 Hzfoil 2 21 124 Hz 28 Hzfoil 3 23 88 Hz 15 Hzfoil 4 23 109 Hz 19 Hzfoil 5 23 126 Hz 21 Hzfoil 6 25 121 Hz 17 HzProcedureThe experimental sessions took place in classesat the University of Lund and in classes with181
<strong>Proceedings</strong>, FONETIK <strong>2009</strong>, Dept. of Linguistics, Stockholm Universityfinal year students at a high school in a smalltown in Northern Scania. The experiment conductorvisited the classes twice. The first time,the participants listened to the 2 minute dialogue(the original event). The only instructionthey got was that they had to listen to the dialogue.Nothing was said about that they shouldfocus on the voices or the linguistic content.The second time, one week later, they listenedto the six male voices (the foils), in randomizedorder for each listener group. Each voice wasplayed twice. The target voice was absent in thetest. The participants were told it was six malevoices in the lineup. This was also obviouswhen looking at the answer sheets. There weresix different listener groups for the 100 participantspresented in this paper. The number ofparticipants in each group differed betweenseven and 27 people.For each voice, the participants had to makea decision if the voice was the same as the onewho talked mostly in the dialogue last week.There were two choices on the answer sheet foreach voice; ‘I do recognize the voice’ or ‘I donot recognize the voice’. They were not told ifthe target voice was absent or not, nor werethey initially told if a voice would be playedmore than once. There was no training session.The participants were told that they could listento each voice twice before answering, but notrecommended to do that.Directly after their judgment of whether aspecific voice was the target or not, the participantsalso had to estimate the confidence intheir answer. The confidence judgment wasmade on scale ranging from 0% (explained as”absolutely sure this voice sample is not thetarget”) via 50% (“guessing”) to 100% (”absolutelysure this voice sample is the target”).Results and DiscussionSince this is an ongoing project the results presentedhere are only results from the first 100participants. We expect 300 participants at theend of this study.Figure 1 shows the number of the ‘I do recognizethe voice’ answers, or ‘yes’ answers.Since the voice lineups were target-absent lineups,a “yes” answer equals an incorrect answer,that is, an incorrect identification.When looking at the answers focusing onthe presentation order, which, as noted above,was randomized for each group, it is obviousthat there is a tendency not to choose the firstvoice. There were no training sessions and thatmight have had an influence. Each voice wasplayed twice, which means that the participantshad a reasonable amount of time to listen to it.The voices they heard in the middle of the testas well as the last played voice were chosenmost often.Only 10 participants had no ‘yes’ answersat all, which is 10% of all listeners, that is,these participants had all answers correct. Theresult for confidence for these 10 participantsshowed that their average confidence level was76 %, which can be compared with the averageconfidence level for the remaining 90 participants,69 %. No listener had more than 4 ‘yes’answers, which means that no one answered‘yes’ all over without exception.Number50454035302520151050Voices in presentation ordervoice 1 voice 2 voice 3 voice 4 voice 5 voice 6Figure 1. Numbers of ‘yes’ answers (e.g., errors)focusing on the presentation order.In Figure 2 the results are shown focusingon each foil 1-6. Most of the participants selectedfoil 4 as the target speaker. The same resultsare shown in Table 2. Foil 4 is closest tothe target speaker and they share more than onefeature in voice and speech. The speaking stylewith the forced, almost stuttering voice andhesitation sounds is obvious and might remindthe listeners of the target speaker when planningthe burglary. Foil 3 and 6 were chosenleast often, and these foils are different fromthe target speaker both concerning pitch, articulationrate and overall speaking style. It is notsurprising that there were almost no differencein results between foil 1 and 2. These malespeakers have very similar voices and speech.They are also quite close to the target speakerin the auditory analysis (i.e. according to anexpert holistic judgment). Foil 5 received many‘yes’ answers as well. He reminds of the targetspeaker concerning articulation rate, but not asobviously as foil 4. He also has a higher pitchand a slightly different dialect compared to thetarget speaker.182
<strong>Proceedings</strong>, FONETIK <strong>2009</strong>, Dept. of Linguistics, Stockholm UniversityThe results indicate that the participantswere confused about foil 4 and this is an expectedresult. The confusion might be explainedboth in the auditory and the acousticanalyses. The overall speaking style, the articulationrate as well as the pitch, of the targetspeaker and foil 4 are striking.The results show that the mean accuracy ofall the foils was 66.17 with a standard deviation(SD) of 47.35. The results for each of the foilsare shown in Table 2. These results were analyzedwith a one-way ANOVA and the outcomeshows that the difference in how often thesix foils were (correctly) rejected was significant,F (5, 594) = 12.69, p < .000. Further posthoc Tukey test revealedNumber6050403020100Foils 1 - 6foil 1 foil 2 foil 3 foil 4 foil 5 foil 6Figure 2. Numbers of ‘yes’ answers (e.g., errors)focusing on the foils 1-6.that participant rejected the foil 3 (M=85) andfoil 6 (M=87), significantly more often as comparedwith the other foils.We next look at the results for the confidencejudgments and their realism. When analyzingthe confidence values we first reversedthe confidence scale for all participants whogave a “no” answer to the identification question.This means that a participant who answered“no” to the identification question andthen gave “0 %” (“absolutely sure that thisvoice sample is not the target”) received a100% score in confidence when the scale wasreversed. Similarly, a participant who gave 10as a confidence value received 90 and a participantwho gave 70 received a confidence valueof 30 after the transformation, etc. 50 in confidenceremained 50 after the transformation. Inthis way the meaning of the confidence ratingscould be interpreted in the same way for allparticipants, irrespective of their answers to theidentification question.The mean confidence for all the foils was69.93 (SD = 25.00). Table 2 shows that therewas no great difference in the level of the confidencejudgments for the given identificationanswers for the respective foils. A one-wayANOVA showed no significant difference betweenthe foils with respect to their confidence(F = .313).Turning next to the over/underconfidencemeasure (O/U-confidence), the average O/Uconfidencecomputed over all the foils was 3.77(SD = 52.62), that is, a modest level of overconfidence.Table 2 shows the means and SDsfor O/U-confidence for each foil. It can benoted that the participants showed quite goodrealism with respect to their level ofover/underconfidence for item 5 and an especiallyhigh level of overconfidence for item 4.Moreover, the participants’ showed underconfidencefor items 3 and 6, that is, the sameitems showing the highest level of correctness.A one-way ANOVA showed that there wasa significant difference between the foils withrespect to the participants’ O/U-confidence, F(5, 394) = 9.47, p < .000. Further post hocTukey tests revealed that the confidence of theparticipants who rejected foil 3 and foil 6showed significantly lower over-/underconfidence as compared to the confidenceof participants for foil 1, foil 2 and foil 4.Table 2. Means (SDs) for accuracy (correctness),confidence, over-/underconfidence andslope for the six foilsFoil 1 Foil 2 Foil 3 Foil 4 Foil 5 Foil 6Accuracy57.00(49.76)57.00(49.76)85.00(35.89)48.00(50.21)63.00(48.52)87.00(33.79)Confidence69.90(22.18)70.00(24.82)70.20(28.92)70.40(21.36)67.49(23.81)71.70(28.85)Over- 12.9% 13.0% -14.8% 22.4% 4.4% -15.3%/underconfSlope -5.07 -2.04 18.27 0.43 1.88 12.57Table 2 also shows the means for the slopemeasure (ability to separate correct from incorrectanswers to the identification question bymeans of the confidence judgments) for the 6foils. The overall slope for all data was 2.21.That is, the participants on average showed avery poor ability to separate correct from incorrectanswers by means of their confidence judgments.However, it is of great interest to notethat the only items for which the participantsshowed a clear ability to separate correct fromincorrect answers was for the two foils (3 and183
<strong>Proceedings</strong>, FONETIK <strong>2009</strong>, Dept. of Linguistics, Stockholm University6) for which they showed the highest level ofcorrect answers to the identification question.Summary and conclusionsIn this study the original event consisted of adialogue between two persons and, similarly,the recordings for the foils were a dialogue.This is an important feature of this study andsomething that contributes to increasing theecological validity in this research area sinceprevious research often has used monologuereadings of text both as the original events andas the recognition stimuli. To what extent thisfeature of the study influenced the results is notclear since we did not have a comparison conditionin this context.Characteristic voice features had an impactupon the listeners in this study. The results, sofar, are expected since the participants seem tobe confused and thought that the voice of foil 4was the target speaker, compared with the otherfoils in the lineup. Foil 4 was the most alikeconcerning pitch and speaking style. It mightbe that the speaking style and the forced voicewas a kind of hang-up for the listeners. Eventhough all male speakers had almost the samedialect and the same age as the target speaker,there were obvious differences in their voicesand speech behavior. The listeners were nottold what to focus on when listening the firsttime. As noted above, we don’t know if the useof a dialogue with a forensic content had an effectupon the result. The recordings in thelineup were completely different in their content.In brief, the results in this study suggest thatprominent characteristic features in voice andspeech are important in an earwitness identificationsituation. In a forensic situation it wouldbe important to be aware of characteristic featuresin the voice and speech.Turning next to the realism in the participants’confidence judgments it is of interestthat the participants in this study over all, incontrast to some other studies on earwitnesses(e.g., Olsson et al, 1998), showed only a modestlevel of overconfidence. However, a recentreview of this area shows that the level of realismfound depends on the specific measureused and various specific features of the voicesinvolved. For example, more familiar voicesare associated with better realism in the confidencejudgments (Yarmey, 2007). Had a differentmixture of voices been used in the presentstudy, the general level of realism in the O/Uconfidencemeasure might have been different.We next discuss the variation between thefoils with respect to their level of overconfidence.It can be discerned from Table 2 that thelevel of overconfidence follows the respectivefoil’s level of accuracy. When the level of identificationaccuracy is high, the level of O/Uconfidenceis lower, or even turns into underconfidence.Thus, a contributing reason to thevariation in overconfidence between the foils(in addition to the similarity of the foils’ voicesto that of the target), may be that the participantsexpected to be able to identify a foil asthe target and when they could not do so thisresulted in less confidence in their answer. Anotherspeculation is that the participants’ generalconfidence level may have been the mostimportant factor. In practice, if these speculationsare correct it is possible that the differentspeech features of the foils’ voices did not contributevery much to the participants’ level ofconfidence or degree of overconfidence. Insteadthe participants’ confidence may be regulatedby other factors as speculated above.The results for the slope measure showedthat the participants evidenced some ability toseparate correct from incorrect answers bymeans of their confidence judgments for thetwo foils 3 and 6, that is, the foils for which theparticipants showed the highest level of accuracyin their identifications. These two foilswere also the foils that may be argued to beperceptually (i.e., “experientially”) most separatefrom the target voice. For the other fourfoils the participants did not evidence any abilityat all to separate correct from incorrect identificationanswers by means of their confidencejudgments.Finally, given that they hold in future research,the results showed that earwitnesses’confidence judgments do not appear to be avery reliable cue as to the correctness of thetheir identifications, at least not in the situationinvestigated in this study, namely the context oftarget-absent lineups when the target voice occurin dialogues both in the original event andin the foils’ voice sample. The results showedthat although the average level of overconfidencewas fairly modest when computed overall foils, the level of over-underconfidence varieda lot between the different foils. Still itshould be noted that for those two foils wherethe participants had the best accuracy level theyalso tended to give higher confidence judg-184
<strong>Proceedings</strong>, FONETIK <strong>2009</strong>, Dept. of Linguistics, Stockholm Universityments for correct answers as compared withincorrect answers. However, more research isobviously needed to confirm the reported results.AcknowledgementsThis work was supported by a grant from Crafoordskastiftelsen, Lund.ReferencesClopper C.G. and Pisoni D.B. (2004) Effects oftalker variability on perceptual learning ofdialects. Language and Speech, 47 (3), 207-239.Cook S. and Wilding J. (1997) Earwitness testimony:Never mind the variety, hear thelength. Applied Cognitive Psychology, 11,95-111.Eriksson J.E., Schaeffler F., Sjöström M., SullivanK.P.H. and Zetterholm E. (submitted2008) On the perceptual dominance of dialect.Perception & Psychophysics.Lass N.J., Hughes K.R., Bowyer M.D., WatersL.T. and Bourne V.T. (1976) Speaker sexidentification from voice, whispered, andfiltered isolated vowels. Journal of theAcoustical Society of America, 59 (3), 675-678.Nolan F. (2003) A recent voice parade. ForensicLinguistics, 10, 277-291.Olsson N., Juslin P., & Winman A. (1998) Realismof confidence in earwitness versuseyewitness identification. Journal of ExperimentalPsychology: Applied, 4, 101–118.Walden B.E., Montgomery A.A., Gibeily G.J.,Prosek R.A. and Schwartz D.M. (1978)Correlates of psychological dimensions intalker similarity. Journal of Speech andhearing Research, 21, 265-275.Yarmey A.D. (2007) The psychology ofspeaker identification and earwitness memory.In R.C. Lindsay, D.F. Ross, J. DonRead & M.P. Toglia (Eds.), Handbook ofeyewitness psychology, Volume 2, Memoryfor people (pp. 101-136). Mahwah, N.J.:Lawrence Erlbaum Associates.Yates J.F. (1994) Subjective probability accuracyanalysis. In G. Wright & P. Ayton(Eds.), Subjective probability (pp. 381-410).New York: John Wiley & Sons.185
<strong>Proceedings</strong>, FONETIK <strong>2009</strong>, Dept. of Linguistics, Stockholm UniversityPerception of voice similarity and the results of avoice line-upJonas LindhDepartment of Philosophy, Linguistics and Theory of Science, University of Gothenburg, SwedenAbstractThe perception of voice similarity is not thesame as picking a speaker in a line-up. Thisstudy investigates the similarities and differencesbetween a perception experiment wherepeople judged voice similarity and the resultsfrom voice line-up experiment. Results give usan idea about what listeners do when they tryto identify a voice and what parameters play animportant role. The results show that there aresimilarities between the voice similarity judgmentsand the line-up results.They differ, however,in several respects when we look atspeaking parameters. This finding has implicationsfor how to consider the similarities betweenfoils and suspects when setting up a lineupas well as how we perceive voice similaritiesin general.IntroductionAural/acoustic methods in forensic speakercomparison cases are common. It is possible todivide speaker comparison into 2 differentbranches depending on the listener. The 1 st isthe expert witness’ aural examination of speechsamples. In this case the expert tries to quantifyand assess the similarities/dissimilarities betweenspeakers based on linguistic, phonologicaland phonetic features and finally evaluatethe distinctiveness of those features (French &Harrison, 2007). The 2 nd branch is the speakercomparison made by naive listeners, for examplevictims of a crime where they heard avoice/speaker, but could not see the perpetrator.In both cases, some kind of voice quality wouldbe used as a parameter. However, it is not thoroughlyinvestigated if this parameter can beseparated from so called articulation or speakingparameters such as articulation rate (AR) orpausing, which are parameters that have shownto be useful parameters when comparing speakers(Künzel, 1997). To be able to study thiscloser a web based perception experiment wasset up where listeners were asked to judgevoice similarity in a pairwise comparison test.The speech was played backwards to removespeaking characteristics and force listeners toconcentrate on voice quality similarity. Thespeech material used in the present study wasoriginally produced for an ear witness studywhere 7 speaker line-ups were used to testvoice recognition reliability in ear witnesses.The speakers in that study were male andmatched for general speaker characteristics likesex, age and dialect. The results from the earwitness study and the judgments of voice similaritywere then compared. It was found, forexample, that the occurrence of false acceptances(FA) was not randomly distributed butsystematically biased towards certain speakers.Such results raise obvious questions like: Whywere these particular speakers chosen? Aretheir speaker characteristics particularly similarto those of the intended target? Would an auralvoice comparison test single out the samespeakers? The results give implications on theexistence of speech characteristics still presentin backward speech. It can also be shown thatspeakers that are judged as wolves (term fromspeaker verification, where a voice is rathersimilar to many models) can be picked moreeasily in a line-up if they also possess speechcharacteristics that are similar to the target.MethodTo be able to collect sufficiently large amountsof data, two different web tests were designed.One of the web based forms was only releasedto people that could insure a controlled environmentin which the test was to take place.Such a controlled environment could for examplebe a student lab or equivalent. A secondform was created and published to as manypeople as possible throughout the web, a socalleduncontrolled test group. The two groups'results were treated separately and later correlatedto see whether the data turned out to besimilar enough for the results to be pooled.The ear witness studyTo gain a better understanding of earwitnessperformance a study was designed in whichchildren aged 7-8 and 11-12 and adults servedas informants. A total of 240 participants were186
<strong>Proceedings</strong>, FONETIK <strong>2009</strong>, Dept. of Linguistics, Stockholm Universityequally distributed between the three agegroups and exposed to an unfamiliar voice.Each participant was asked to come along withan experimenter to a clothes shop where theystopped outside a fitting cubicle. Behind thecurtain they could here an unfamiliar voiceplanning of a crime (PoC). The recording theyheard was played with a pair of high qualityloudspeakers and was approximately 45 secondslong. After two weeks, the witnesses wereasked to identify the target-voice in a line-up (7voices). Half of the witnesses were exposed toa target-present line-up (TP), and the other halfto a target-absent line-up (TA). The line-up wasalso played to the witness on loudspeakers froma computer and the voices presented on a powerpoint slide. First an excerpt from a recording ofa city walk of a bout 25 seconds was played.After that a shorter part of the excerpt of about12-15 seconds was used. First they had to saywhether they thought the voice was present inthe line-up, and if so, they pointed the voiceout. Secondly they were asked about their confidenceand what they remembered from whatthe voice in the cubicle had said. This was doneto see whether it was possible to predict identificationaccuracy by analyzing memory forcontent (Öhman, Eriksson & Granhag, <strong>2009</strong>).To be able to quantify speaking parameters,pausing and articulation rate was measured. Articulationrate is here defined as produced syllablesexcluded pausing. Pauses are defined asclearly measurable silences longer than 150 ms.The test materialThe recordings consisted of spontaneousspeech elicited by asking the speakers to describea walk through the centre of Gothenburg,based on a series of photos presented to them.The 9 (7 plus 1 in TA + target) speakers wereall selected as a very homogeneous group, withthe same dialectal background (Gothenburgarea) and age group (between 28–35). Thespeakers were selected from a larger set of 24speakers on the basis of a speaker similarityperception test using two groups of undergraduatestudents as subjects. The subjects hadto make similarity judgments in a pairwisecomparison test where the first item was alwaysthe target speaker intended for the line-up test.Subjects were also asked to estimate the age ofthe speakers. The recordings used for thesetests were 16 kHz /16 bit wave files.The web based listening testsThe listening tests had to be made interactiveand with the results for the geographically dispersedlisteners gathered in an automatic manner.Google docs provide a form to create webbased question sheets collecting answers in aspreadsheet as you submit them and that wasthe form of data collection we chose to use forthe perception part of the study. However, ifone cannot provide a controlled environment,the results cannot be trusted completely. As ananswer to this problem two equal web basedlistening tests were created, one intended for aguaranteed controlled environment and oneopenly published test, here referred to as uncontrolled.The two test groups are here treatedseparately and correlated before being mergedin a final analysis.In the perception test for the present study,9 voices were presented pair-wise on a webpage and listeners were asked to judge the similarityon a scale from 1 to 5, where 1 was saidto represent “Extremely similar or same” and 5“Not very similar”. Since we wanted to minimizethe influence of any particular language orspeaking style, the speech samples were playedbackwards. The listeners were also asked tosubmit information about their age, first languageand dialectal background (if Swedishwas their first language). There was also aspace where they could leave comments afterthe completion of test and some participantsused this opportunity. The speech samples usedin the perception test were the first half of the25 second samples used in the earwitness lineups,except for the pairs where both sampleswere from the same speaker. In these cases theother item was the second half of the 25 secondsamples. Each test consisted of 45 comparisonsand took approximately 25 minutes to complete.32 (7 male, 25 female) listeners performedthe controlled listening test and 20 (6male, 14 female) the uncontrolled test.Results and DiscussionThe results will be presented separately in thefirst 2 paragraphs and then the comparison isdone with a short discussion in the last section.The overall results of the ear w itnessstudyThe original purpose of the study was to compareperformance between the age groups. Here187
<strong>Proceedings</strong>, FONETIK <strong>2009</strong>, Dept. of Linguistics, Stockholm UniversityFalse Acceptances / Foil in Target Absent (TA) and TargetPresent (TP)Nr302520151050JL MM TN KG CF JÅ MS JL MM TN KG CF JÅTA TA TA TA TA TA TA TP TP TP TP TP TPFigurant7-8 y11-12 yAdultsAllFigure 1. False acceptances for each figurant speaker in the 3 age groups and the sum (all) for bothtarget absent (TA) and target present (TP).we are only interested in the general tendenciesof the false acceptances (the picking of thewrong voice) and the true, i.e. correct identifications.In Figure 1 we present the false acceptancesgiven by the different age groups and alltogether.In Figure 1 it is very clear that false acceptanceis biased toward certain speakers such asspeaker CF followed by MM and JL. It is noticeablethat correct acceptances in TP was 27and that can explain the decrease in FA for MMand JL, however, the degree of FA for speakerCF is even higher in TP (28).N/second76543210Articulation RateCF JÅ JL KG MS MM NS TN PoCSpeakerFigure 2. Articulation rate (produced syllables persecond) for the speakers in the line-up.In Figure 2 we can see that the target (PoC)was produced with a fast articulation rate. Severalspeakers follow with rather average valuesaround 5 syllables per second. The speakerwith the highest AR compared to PoC is CF. InFigure 3 we take a closer look at pausing.ARPauses tend to increase in duration with higharticulation rate (Goldman-Eisler, 1961).N/min (%)454035302520151050Pausing for Line-up SpeakersCF JÅ JL KG MS MM NS TN PoCSpeakersPausdur/minPaus_N/minPaus_%Figure 3. Pausing (pause duration per minute, numberof pauses per minute and percentage pause fromtotal utterance duration) for the speakers in the lineup.The pausing measurement shows a bias towardsspeaker CF, which might explain some of thefalse acceptances.The perception test resultsBoth listening tests separately (controlled anduncontrolled) show significant inter-rateragreement (Cronbach’s alpha = 0.98 for thecontrolled and 0.959 for the uncontrolled test).When both datasets are pooled the inter-rateragreement remains at the same high level (alpha= 0.975) indicating that listeners in bothsubgroups have judged the voices the sameway. This justifies using the pooled data from188
<strong>Proceedings</strong>, FONETIK <strong>2009</strong>, Dept. of Linguistics, Stockholm Universityboth groups (52 subjects altogether) for the furtheranalysis of the perception test results.Mean similarity4,543,532,521,510,50Mean Voice Similarity Judgement Speakers vs. PoCJÅ JL KG MM MS PoC NS TN CFSpeakerFigure 4. Mean voice similarity judgment by listenerscomparing each speaker against target PoC. Thecloser to 1 the more similar voice according to judgments.The voice similarity judgments indicate thesame as the line-up regarding speaker CF, whois judged to be closest to the target followed byJL and MM. It is also noticeable that thosespeakers are among the speakers who get thehighest mean overall similarity judgmentscompared to all the other speakers.Table 1. The table shows speaker ranks based onmean similarity judgment for both listener groupspooled.Speaker JÅ JL KG MM MS PoC NS TN CFJÅ 1 4 5 3 6 8 9 7 2JL 3 1 8 5 7 4 2 9 6KG 5 9 1 2 3 7 8 6 4MM 4 5 2 1 3 8 9 7 6MS 7 8 6 5 2 9 3 1 4PoC 5 3 6 4 9 1 7 8 2NS 6 2 8 5 3 7 1 9 4TN 6 9 5 4 1 7 8 2 3CF 2 9 6 7 3 5 8 4 1Mean 4.3 5.6 5.2 4.0 4.1 6.2 6.1 5.9 3.6rankStd dev 2.0 3.2 2.4 1.8 2.6 2.5 3.2 2.9 1.7The mean rank in table 1 indicates how thespeaker is ranked compared to the other voicesin similarity judgment.PoCthat CF is generally judged as most similar tothe target speaker (even more than the actualtarget in the TP line-up). We have also foundthat the result can partly be explained by thesimilarity in speaking tempo parameters. However,since the result is also confirmed in theperception experiment it must mean either thatthe tempo parameters are still obvious in backwardspeech or that there is something else thatmake listeners choose certain speakers. Perhapsthe indication that speakers are generally highranked, or wolves (term from speaker verification,see Melin, 2006), in combination withsimilar aspects of tempo make judgments biased.More research to isolate voice quality isneeded to answer these questions in more detail.AcknowledgementsMany thanks to the participants in the listeningtest. My deepest gratitude to the AllEars projectLisa Öhman and Anders Eriksson for providingme with data from the line-up experiments beforethey have been published.ReferencesFrench, P., and Harrison, P. (2007) PositionStatement concerning use of impressionisticlikelihood terms in forensic speaker comparisoncases, with a foreword by PeterFrench & Philip Harrison. InternationalJournal of Speech Language and the Law.[Online] 14:1.Künzel, H. (1997) Some general phonetic andforensic aspects of speaking tempo. ForensicLinguistics 4, 48–83.Goldman-Eisler, F. (1961) The significance ofchanges in the rate of articulation. Lang.and Speech 4, 171-174.Öhman, L., Eriksson, A. and Granhag, P-A.(<strong>2009</strong>) Unpublished Abstract. Earwitnessidentification accuracy in children vs.adults.Comparison of results and discussionThe purpose of the study was to compare thegeneral results from the line-up study and theresults of the perception experiment presentedhere. A comparison between the results show189
<strong>Proceedings</strong>, FONETIK <strong>2009</strong>, Dept. of Linguistics, Stockholm UniversityProject presentation: Spontal – multimodal database ofspontaneous speech in dialogJonas Beskow, Jens Edlund, Kjell Elenius, Kahl Hellmer, David House & Sofia StrömbergssonKTH Speech Music & Hearing, Stockholm, SwedenAbstractWe describe the ongoing Swedish speech databaseproject Spontal: Multimodal database ofspontaneous speech in dialog (VR 2006-7482).The project takes as its point of departure thefact that both vocal signals and gesture involvingthe face and body are important in everyday,face-to-face communicative interaction,and that there is a great need for data withwhich we more precisely measure these.IntroductionSpontal: Multimodal database of spontaneousspeech in dialog is an ongoing Swedish speechdatabase project which began in 2007 and willbe concluded in 2010. It is funded by the SwedishResearch Council, KFI - Grant for largedatabases (VR 2006-7482). The project takes asits point of departure the fact that both vocalsignals and gesture involving the face and bodyare key components in everyday face-to-faceinteraction – arguably the context in whichspeech was borne – and focuses in particular onspontaneous conversation.Although we have a growing understandingof the vocal and visual aspects of conversation,we are lacking in data with which we can makemore precise measurements. There is currentlyvery little data with which we can measure withprecision multimodal aspects such as the timingrelationships between vocal signals and facialand body gestures, but also acoustic propertiesthat are specific to conversation, as opposed toread speech or monologue, such as the acousticsinvolved in floor negotiation, feedback andgrounding, and resolution of misunderstandings.The goal of the Spontal project is to addressthis situation through the creation of a Swedishmultimodal spontaneous speech database richenough to capture important variations amongspeakers and speaking styles to meet the demandsof current research of conversationalspeech.Scope60 hours of dialog consisting of 120 half-hoursessions will be recorded in the project. Eachsession consists of three consecutive 10 minuteblocks. The subjects are all native speakers ofSwedish and balanced (1) for gender, (2) as towhether the interlocutors are of opposing genderand (3) as to whether they know each otheror not. This balance will result in 15 dialogs ofeach configuration: 15x2x2x2 for a total of 120dialogs. Currently (April, <strong>2009</strong>), about 33% ofthe database has been recorded. The remainderis scheduled for recording during 2010. All subjectspermit, in writing (1) that the recordingsare used for scientific analysis, (2) that the analysesare published in scientific writings and (3)that the recordings can be replayed in front ofaudiences at scientific conferences and suchlike.In the base configuration, the recordings arecomprised of high-quality audio and highdefinitionvideo, with about 5% of the recordingsalso making use of a motion capture systemusing infra-red cameras and reflectivemarkers for recording facial gestures in 3D. Inaddition, the motion capture system is used onvirtually all recordings to capture body andhead gestures, although resources to treat andannotate this data have yet to be allocated.Instruction and scenariosSubjects are told that they are allowed to talkabout absolutely anything they want at anypoint in the session, including meta-commentson the recording environment and suchlike,with the intention to relieve subjects from feelingforced to behave in any particular manner.The recordings are formally divided intothree 10 minute blocks, although the conversationis allowed to continue seamlessly over theblocks, with the exception that subjects are informed,briefly, about the time after each 10minute block. After 20 minutes, they are alsoasked to open a wooden box which has beenplaced on the floor beneath them prior to therecording. The box contains objects whoseidentity or function is not immediately obvious.The subjects may then hold, examine and190
<strong>Proceedings</strong>, FONETIK <strong>2009</strong>, Dept. of Linguistics, Stockholm UniversityFigure 1. Setup of the recording equipment used to create the Spontal database.discuss the objects taken from the box, but theymay also chose to continue whatever discussionthey were engaged in or talk about somethingentirely different.Technical specificationsThe audio is recorded on four channels using amatched pair of Bruel & Kjaer 4003 omnidirectionalmicrophones for high audio quality,and two Beyerdynamic Opus 54 cardioid headsetmicrophones to enable subject separation fortranscription and dialog analysis. The two omni-directionalBruel & Kjaer microphones areplaced approximately 1 meter from each subject.Two JVC HD Everio GZ-HD7 high definitionvideo cameras are placed to obtain a goodview of each subject from a height that is approximatelythe same as the heads of both ofthe participating subjects. They are placedabout 1.5 meters behind the subjects to minimizeinterference. The cameras record in mpeg-2encoded full HD with the resolution1920x1080i and a bitrate of 26.6 Mbps. To ensureaudio, video and motion-capture synchronizationduring post processing, a record playeris included in the setup. The turntable is placedbetween the subjects and a bit to the side, in fullview of the motion capture cameras. The markerthat is placed near the edge on the platter rotateswith a constant speed (33 rpm) andenables high-accuracy synchronization of theframe rate in post processing. The recordingsetup is illustrated in Figure 1.Figure 2 shows a frame from each of thetwo video cameras aligned next to each other,so that the two dialog partners are both visible.The opposing video camera can be seen in thecentre of the image, and a number of tripodsholding the motion capture cameras are visible.The synchronization turn-table is visible in theleft part of the left pane and the right part of theright pane. The table between the subjects iscovered in textiles, a necessary precaution asthe motion capture system is sensitive to reflectingsurfaces. For the same reason, subjectsare asked to remove any jewelry, and other shinyobjects are masked with masking tape.Figure 3 shows a single frame from the videorecording and the corresponding motioncapturedata from a Spontal dialog. As in Figure2, we see the reflective markers for the motion-capturesystem on the hands, arms, shoulders,trunk and head of the subject. Figure 4 is a3D data plot of the motion capture data fromthe same frame, with connecting lines betweenthe markers on the subject’s body.191
<strong>Proceedings</strong>, FONETIK <strong>2009</strong>, Dept. of Linguistics, Stockholm UniversityFigure 2. Example showing one frame from the two video cameras taken from the Spontal database.AnnotationThe Spontal database is currently being transcribedorthographically. Basic gesture and dialog-levelannotation will also be added (e.g.turn-taking and feedback). Additionally, automaticannotation and validation methods arebeing developed and tested within the project.The transcription activities are being performedin parallel with the recording phase of theproject with special annotation tools written forthe project facilitating this process.Specifically, the project aims at annotationthat is both efficient, coherent, and to the largestextent possible objective. To achieve this,automatic methods are used wherever possible.The orthographic transcription, for example,follows a strict method: (1) automaticspeech/non-speech segmentation, (2) orthographictranscription of resulting speech segments,(3) validation by a second transcriber,(4) automatic phone segmentation based on theorthographic transcriptions. Pronunciation variabilityis not annotated by the transcribers, butis left for the automatic segmentation stage (4),which uses a pronunciation lexicon capturingmost standard variations.Figure 3. A single frame from one of the videocameras.Figure 4. 3D representation of the motion capturedata corresponding to the video frame shown inFigure 3.Concluding remarksA number of important contemporary trends inspeech research raise demands for large speechcorpora. A shining example is the study ofeveryday spoken language in dialog which hasmany characteristics that differ from writtenlanguage or scripted speech. Detailed analysisof spontaneous speech can also be fruitful forphonetic studies of prosody as well as reducedand hypoarticulated speech. The Spontal databasewill make it possible to test hypotheses onthe visual and verbal features employed incommunicative behavior covering a variety offunctions. To increase our understanding of traditionalprosodic functions such as prominencelending and grouping and phrasing, the databasewill enable researchers to study visual andacoustic interaction over several subjects anddialog partners. Moreover, dialog functionssuch as the signaling of turn-taking, feedback,attitudes and emotion can be studied from amultimodal, dialog perspective.In addition to basic research, one importantapplication area of the database is to gain192
<strong>Proceedings</strong>, FONETIK <strong>2009</strong>, Dept. of Linguistics, Stockholm Universityknowledge to use in creating an animated talkingagent (talking head) capable of displayingrealistic communicative behavior with the longtermaim of using such an agent in conversationalspoken language systems.The project is planned to extend through2010 at which time the recordings and basicorthographic transcription will be completed,after which the database will be made freelyavailable for research purposes.AcknowledgementsThe work presented here is funded by the SwedishResearch Council, KFI - Grant for largedatabases (VR 2006-7482). It is performed atKTH Speech Music and Hearing (TMH) andthe Centre for Speech Technology (CTT) withinthe School of Computer Science and Communication.193
<strong>Proceedings</strong>, FONETIK <strong>2009</strong>, Dept. of Linguistics, Stockholm UniversityA first step towards a text-independent speaker verificationPraat plug-in using Mistral/Alize toolsJonas LindhDepartment of Philosophy, Linguistics and Theory of Science, University of GothenburgAbstractText-independent speaker verification can be auseful tool as a substitute for passwords or increasedsecurity check. The tool can also beused in forensic phonetic casework. A text-independentspeaker verification Praat plug-inwas created using tools from the open sourceMistral/Alize toolkit. A gate keeper setup wascreated for 13 department employees and testedfor verification. 2 different universal backgroundmodels where trained and the same settested and evaluated. The results show promisingresults and give implications for the usefulnessof such a tool in research on voice quality.IntroductionAutomatic methods are increasingly being usedin forensic phonetic casework, but most oftenin combination with aural/acoustic methods. Itis therefore important to get a better understandingof how the two systems compare. Forseveral studies on voice quality judgement, butalso as a tool for visualisation and demonstration,a text-independent speaker comparisonwas implemented as a plugin to the phoneticanalysis program Praat (Boersma & Weenink,<strong>2009</strong>). The purpose of this study was to makean as easy to use implementation as possible sothat people with phonetic knowledge could usethe system to demonstrate the technique or performresearch. A state-of-art technique, the socalled GMM-UBM (Reynolds, 2000), was appliedwith tools from the open source toolkitMistral (former Alize) (Bonastre et al., 2005;2008). This paper describes the surface of theimplementation and the tools used without anydeeper analysis to get an overview. A small testwas then made on high quality recordings tosee what difference the possession of trainingdata for the universal background model makes.The results show that for demonstration purposesa very simple world model including thespeakers you have trained as targets is sufficient.However, for research purposes a largerworld model should be trained to be able toshow more correct scores.Mistral (Alize), an open source toolkitfor building a text-independent speakercomparison systemThe NIST speaker recognition evaluation campaignstarted already 1996 with the purpose ofdriving the technology of text-independentspeaker recognition forward as well as test theperformance of the state-of-the-art approachand to discover the most promising algorithmsand new technological advances (fromhttp://www.nist.gov/speech/tests/sre/ Jan 12,<strong>2009</strong>). The aim is to have an evaluation at leastevery second year and some tools are providedto facilitate the presentation of the results andhandling the data (Martin and Przybocki,1999). A few labs have been evaluating theirdevelopments since the very start with increasingperformances over the years. These labsgenerally have always performed best in theevaluation. However, an evaluation is a rathertedious task for a single lab and the question ofsome kind of coordination came up. This coordinationcould be just to share information,system scores or other to be able to improve theresults. On the other hand, the more naturalchoice to be able to share and interpret results isopen source. On the basis of this Mistral andmore specifically the ALIZE SpkDet packageswere developed and released as open sourcesoftware under a so-called LGPL licence(Bonastre et al., 2005; 2008).MethodA standard setup was made for placing datawithin the plugin. On the top of the tree structureseveral scripts controlling executable binaries,configuration files, data etc. were createdwith basic button interfaces that show up in agiven Praat configuration. The scripts weremade according to the different necessary stepsthat have to be covered to create a test environment.194
<strong>Proceedings</strong>, FONETIK <strong>2009</strong>, Dept. of Linguistics, Stockholm UniversitySteps for a fully functional text-independentsystem in PraatFirst of all some kind of parameterization has tobe made of the recordings at hand. In this firstimplementation SPro (Guillaume, 2004) waschosen for parameter extraction as there was alreadysupport for this implemented in the Mistralprograms. There are 2 ways to extract parameters,either you choose a folder with audiofiles (preferably wave format, however otherformats are supported) or you record a sound inPraat directly. If the recording is supposed to bea user of the system (or a target) a scroll listwith a first option “New User” can be chosen.This function will control the sampling frequencyand resample if sample frequency isother than 16 kHz (currently default), perform aframe selection by excluding silent frameslonger than 100 ms before 19 MFCCs are extractedand stored in parameter file. The parametersare then automatically energy normalizedbefore storage. The name of the user is thenalso stored in a list of users for the system. Ifyou want to add more users you go through thesame procedure again. When you are done youcan choose the next option in the scroll listcalled “Train Users”. This procedure will controlthe list of users and then normalize andtrain the users using a background model(UBM) trained using Maximum LikelihoodCriterion. The individual models are trained tomaximise the a posteriori probability that theclaimed identity is the true identity given thedata (MAP training). This procedure requiresthat you already have a trained UBM. However,if you do not, you can choose the function“Train World” which will take your list of users(if you have not added others to be included inthe world model solely) and train one with thedefault of 512 Gaussian mixture models(GMM). The last option on the scroll list is instead“Recognise User” which will test the recordingagainst all the models trained by thesystem. A list of raw (not normalised) log likelihoodratio scores gives you feedback on howwell the recording fitted any of the models. In acommercial or fully-fledged verification systemyou would also have to test and decide onthreshold, as that is not the main purpose herewe are only going to speculate on possible useof threshold for this demo system.Preliminary UBM performance testTo get first impression how well the implementationworked a small pilot study was madeusing 2 different world models. For this purpose13 colleagues (4 female and 9 males) atthe department of linguistics were recorded usinga headset microphone. To enroll them asusers they had to read a short passage from awell known text (a comic about a boy endingup with his head in the mud). The recordingsfrom the reading task were between 25-30seconds. 3 of the speakers were later recordedto test the system using the same kind of headset.1 male and 1 female speaker was then alsorecorded to be used as impostors. For the testutterances the subjects were told to produce anutterance close to “Hej, jag heter X, jag skullevilja komma in, ett två tre fyra fem.” (“Hi, I amX, I would like to enter, one two three fourfive.”). The tests were run twice. In the first testonly the enrolled speakers were used as UBM.In the second the UBM was trained on excerptsfrom interviews with 109 young male speakersfrom the Swedia dialect database (Eriksson,2004). The enrolled speakers were not includedin the second world model.Results and discussionAt the enrollment of speakers some mistakes inthe original scripts were discovered such ashow to handle clipping in recordings as well asfeedback to the user while training models. Thescripts were updated to take care of that and afterwardsenrollment was done without problems.In the first test only the intended targetspeakers were used to train a UBM before theywere enrolled.LLR0,60,40,20-0,2-0,4-0,6-0,8-1LLR Score Test 1 Speaker RAM M M F F M F M M M M F MRA JA PN JV KC AE EB JL TL JaL SS UV HVRA_t RA_t RA_t RA_t RA_t RA_t RA_t RA_t RA_t RA_t RA_t RA_t RA_tTest SpeakerFigure 1. Result for test 1 speaker RA against allenrolled models. Row 1 shows male (M) or female(F) model, row 2 model name and row 3 the testspeaker.In Figure 1 we can observe that the speaker iscorrectly accepted with the only positive LLR(0.44). The closest following is then the modelof speaker JA (-0.08).195
<strong>Proceedings</strong>, FONETIK <strong>2009</strong>, Dept. of Linguistics, Stockholm UniversityLLR Score Test 1 Speaker JALLR Score Test 1 Imposter Speaker HE0,40,40,20,2LLR0-0,2-0,4M M M M M M F F M M F F MJA TL AE JL PN RA JV EB HV JaL KC UV SSLLR0-0,2-0,4F F F M M F M M M M M M MEB KC UV PN HV JV JA JL JaL RA SS TL AE-0,6JA_t JA_t JA_t JA_t JA_t JA_t JA_t JA_t JA_t JA_t JA_t JA_t JA_t-0,6HEimHEimHEimHEimHEimHEimHEimHEimHEimHEimHEimHEimHEim-0,8-0,8-1-1Test SpeakerTest SpeakerFigure 2. Result for test 1 speaker JA against all enrolledmodels.In the 2 nd test there is a lower acceptance score(0.25) for the correct model. However, the closestmodel (TL) also has a positive LLR (0.13).LLR0,20-0,2-0,4-0,6LLR Score Test 1 Speaker HVM M M M M F M F M M F F MHV AE SS PN JaL UV RA KC JA JL JV EB TLHV_t HV_t HV_t HV_t HV_t HV_t HV_t HV_t HV_t HV_t HV_t HV_t HV_tFigure 5. Result for test 1 female imposter speakerHE against all enrolled models.The female imposter was more successful intest 1. She gained 2 positive LLRs for 2 modelsof enrolled speakers.In test 2 the world model was exchangedand models retrained. This world model wastrained on excerpts of spontaneous speech from109 young male speakers recorded with a similarquality as the enrolled speakers.LLR Score Test 2 Speaker RA-0,8-1Test SpeakerFigure 3. Result for test 1 speaker HV against allenrolled models.In the 3 rd test the correct model is highestranked again, however, the LLR (0.009) is low.LLR0,40,30,20,10-0,1-0,2-0,3-0,4-0,5-0,6M F M M F M M M F M M F MRA KC JA PN JV SS JaL JL EB TL HV UV AERA_t RA_t RA_t RA_t RA_t RA_t RA_t RA_t RA_t RA_t RA_t RA_t RA_tTest SpeakerLLR0-0,1-0,2-0,3-0,4-0,5-0,6-0,7-0,8LLR Score Test 1 Imposter Speaker MHM F M M M F M F F M M M MAE EB PN HV RA UV JA KC JV JaL JL TL SSMhimMhimMhimMhimMhimMhimMhimMhimMhimMhimMhimMhimMhimTest SpeakerFigure 6. Result for test 2 speaker RA against allenrolled models.The increase in data for world model traininghas had no significant effect in this case.0,60,40,2LLR Score Test 2 Speaker JAFigure 4. Result for test 1 imposter speaker MHagainst all enrolled models.The 1 st imposter speaker has no positive valuesand the system seems to successfully keep thedoor closed.LLR0-0,2-0,4-0,6M M M M M F F M M M M F FJA TL JL PN RA JV KC JaL AE SS HV UV EBJA_t JA_t JA_t JA_t JA_t JA_t JA_t JA_t JA_t JA_t JA_t JA_t JA_tTest SpeakerFigure 7. Result for test 2 speaker JA against all enrolledmodels.196
<strong>Proceedings</strong>, FONETIK <strong>2009</strong>, Dept. of Linguistics, Stockholm UniversityFor the test of speaker JA the new world modelimproved the test result significantly. The correctmodel now gets a very high score (0.53)and even though the second best has a positiveLLR (0.03) it is very low.LLRFigure 8. Result for test 2 speaker HV against allenrolled models.Also for this test the new world model improvesthe correct LLR and creates a larger distanceto the other models.LLRFigure 9. Result for test 2 impostor speaker MHagainst all enrolled models.In the male impostor test for test 2 we obtaineda rather peculiar result where the male impostorgets a positive LLR for a female target model.The lack of female training data in the worldmodel is most probably the explanation for that.LLR0,20,10-0,1-0,2-0,3-0,4-0,50,10-0,1-0,2-0,4-0,5-0,6LLR Score Test 2 Speaker HVLLR Score Test 2 Imposter Speaker MHF F M M M M M F F M M M MEB KC PN RA AE JA HV JV UV JL JaL SS TL-0,3 MhimMhimMhimMhimMhimMhimMhimMhimMhimMhimMhimMhimMhim0,80,70,60,50,40,30,20,10-0,1M M F M F F M M F M M M MHV AE UV SS KC EB RA JaL JV JL PN JA TLHV_t HV_t HV_t HV_t HV_t HV_t HV_t HV_t HV_t HV_t HV_t HV_t HV_tTest SpeakerTest SpeakerLLR Score Test 2 Imposter Speaker HEM M F M M F M M F F M M MAE HV UV TL PN EB JaL JA JV KC RA JL SSHEimHEimHEimHEimHEimHEimHEimHEimHEimHEimHEimHEimHEimTest SpeakerFigure 10. Result for test 2 female impostor speakerHE against all enrolled models.When it comes to the female impostor the resultit becomes even clearer that female trainingdata is missing in the world model. All scoresexcept 1 are positive and some of the scoresvery high.ConclusionsThis first step included a successful implementationof open source tools, building a testframework and scripting procedures for text-independentspeaker comparison. A small pilotstudy on performance of high quality recordingswere made. We can conclude that it is notsufficient to train a UBM using only malespeakers if you want the system to be able tohandle any incoming voice. However, fordemonstration purposes and comparison betweensmall amounts of data it is sufficient touse the technique.ReferencesBoersma, Paul & Weenink, David (<strong>2009</strong>).Praat: doing phonetics by computer (Version5.1.04) [Computer program]. RetrievedApril 4, <strong>2009</strong>, from http://www.praat.org/Bonastre, J-F, Wils, F. & Meigner, S. (2005)ALIZE, a free toolkit for speaker recognition,in <strong>Proceedings</strong> of ICASSP, 2005, pp.737–740.Bonastre, J-F, Scheffer, N., Matrouf, C., Fredouille,A., Larcher, A., Preti, A.,Pouchoulin, G., Evans, B., Fauve, B. & Mason,J.S. (2008) ALIZE/SpkDet: a state-ofthe-artopen source software for speaker recognition.In Odyssey 2008 - The Speakerand Language Recognition Workshop,2008.Eriksson, A. (2004) SweDia 2000: A Swedishdialect database. In Babylonian ConfusionResolved. Proc. Nordic Symposium on theComparison of Spoken Languages, ed. by P.J. Henrichsen, Copenhagen Working Papersin LSP 1 – 2004, 33–48Guillaume, G. (2004) SPro: speech signal processingtoolkit, Software available at http://gforge.inria.fr/projects/spro .Martin, A. F. and Przybocki, M. A. (1999) TheNIST 1999 Speaker Recognition Evaluation-AnOverview. Digital Signal Processing10: 1–18.Reynolds, D. A., Quatieri, T. F., Dunn, R. B.,(2000) Speaker Verification Using AdaptedGaussian Mixture Models, Digital SignalProcessing, 2000.197
<strong>Proceedings</strong>, FONETIK <strong>2009</strong>, Dept. of Linguistics, Stockholm UniversityModified re-synthesis of initial voiceless plosives byconcatenation of speech from different speakersSofia StrömbergssonDepartment of Speech, Music and Hearing, School of Computer Science and Communication, KTH,StockholmAbstractThis paper describes a method of resynthesisingutterance-initial voiceless plosives,given an original utterance by onespeaker and a speech database of utterances bymany other speakers. The system removes aninitial voiceless plosive from an utterance andreplaces it with another voiceless plosive selectedfrom the speech database. (For example,if the original utterance was /tat/, the resynthesisedutterance could be /k+at/.) In themethod described, techniques used in generalconcatenative speech synthesis were applied inorder to find those segments in the speech databasethat would yield the smoothest concatenationwith the original segment. Results froma small listening test reveal that the concatenatedsamples are most often correctly identified,but that there is room for improvement onnaturalness. Some routes to improvement aresuggested.IntroductionIn normal as well as deviant phonological developmentin children, there is a close interactionbetween perception and production ofspeech. In order to change a deviant (non-adult)way of pronouncing a sound/syllable/word, thechild must realise that his/her current productionis somehow insufficient (Hewlett, 1992).There is evidence of a correlation between theamount of attention a child (or infant) pays tohis/her own speech production, and the phoneticcomplexity in his/her speech production(Locke & Pearson, 1992). As expressed bythese authors (p. 120): “the hearing of one’sown articulations clearly is important to theformation of a phonetic guidance system”.Children with phonological disorders producesystematically deviant speech, due to animmature or deviant cognitive organisation ofspeech sounds. Examples of such systematicdeviations might be stopping of fricatives, consonantcluster reductions and assimilations.Some of these children might well perceivephonological distinctions that they themselvesdo not produce, while others have problemsboth in perceiving and producing a phonologicaldistinction.Based on the above, it seems reasonable toassume that enhanced feedback of one’s ownspeech might be particularly valuable to a childwith phonological difficulties, in increasinghis/her awareness of his/her own speech production.Hearing a re-synthesised (“corrected”)version of his/her own deviant speech productionmight be a valuable assistance to the childto gain this awareness. In an effort in this direction,Shuster (1998) manipulated (“corrected”)children’s deviant productions of /r/, and thenlet the subjects judge the correctness andspeaker identity of speech samples played tothem (which could be either original/incorrector edited/corrected speech, spoken by themselvesor another speaker). The results fromthis study showed that the children had mostdifficulties judging their own incorrect utterancesaccurately, but also that they had difficultiesrecognizing the speaker as themselves intheir own “corrected” utterances. These resultsshow that exercises of this type might lead toimportant insights to the nature of the phonologicaldifficulties these children have, as wellas providing implications for clinical intervention.Applications of modified re-synthesisApart from the above mentioned study byShuster (1998), where the author used linearpredictive parameter modification/synthesis toedit (or “correct”) deviant productions of /r/, amore common application for modified resynthesisis to create stimuli for perceptual experiments.For example, specific speech soundsin a syllable have been transformed into intermediateand ambiguous forms between twoprototypical phonemes (Protopapas, 1998).These stimuli have then been used in experimentsof categorical perception. Others havemodulated the phonemic nature of specificsegments, while preserving the global intonation,syllabic rhythm and broad phonotactics ofnatural utterances, in order to study what198
<strong>Proceedings</strong>, FONETIK <strong>2009</strong>, Dept. of Linguistics, Stockholm Universityacoustic cues (e.g. phonotactics, syllabicrhythm) are most salient in identifying languages(Ramus & Mehler, 1999). In these typesof applications, however, stimuli have been createdonce and there has been no need for realtimeprocessing.The computer-assisted language learningsystem VILLE (Wik, 2004) includes an exercisethat involves modified re-synthesis. Here,the segments in the speech produced by theuser are manipulated in terms of duration, i.e.stretched or shortened, immediately after recording.At the surface, this application sharesseveral traits with the application suggested inthis paper. However, more extensive manipulationis required to turn one phoneme into another,which is the goal for the system describedhere.PurposeThe purpose of this study was to find out if it isat all possible to remove the initial voicelessplosive from a recorded syllable, and replace itwith an “artificial” segment so that it soundsnatural. The “artificial” segment is artificial inthe sense that it was never produced by thespeaker, but constructed or retrieved fromsomewhere else. As voiceless plosives generatedby formant synthesizers are known to lackin naturalness (Carlson & Granström, 2005),retrieving the target segment from a speech databasewas considered a better option.MethodMaterialThe Swedish version of the Speecon corpus(Iskra et al, 2002) was used as a speech database,from which target phonemes were selected.This corpus contains data from 550adult speakers of both genders and of variousages. The speech in this corpus was simultaneouslyrecorded at 16 kHz/16 bit sampling frequencyby four different microphones, in differentenvironments. For this study, only therecordings made by a close headset microphone(Sennheiser ME104) were used. No restrictionswere placed on gender, age or recording environment.From this data, only utterances startingwith an initial voiceless plosive (/p/, /t/ or/k/) and a vowel were selected. This resulted ina speech database consisting of 12 857 utterances(see Table 1 for details). Henceforth, thisspeech database will be referred to as “the targetcorpus”.For the remainder part of the re-synthesis, asmall corpus of 12 utterances spoken by a femalespeaker was recorded with a Sennheiserm@b 40 microphone at 16 kHz/16 bit samplingfrequency. The recordings were made in a relativelyquiet office environment. Three utterances(/tat/, /kak/ and /pap/) were recorded fourtimes each. This corpus will be referred to as“the remainder corpus”.Table 1. Number of utterances in the target corpus.Nbr of utterancesUtterance-initial /pV/ 2 680Utterance-initial /tV/ 4 562Utterance-initial /kV/ 5 614Total 12 857Re-synthesisEach step in the re-synthesis process is describedin the following paragraphs.AlignmentFor aligning the corpora (the target corpus andthe remainder corpus), the NALIGN aligner(Sjölander, 2003) was used.Feature extractionFor the segments in the target corpus, featureswere extracted at the last frame before the middleof the vowel following the initial plosive.For the segments in the remainder corpus, featureswere extracted at the first frame after themiddle of the vowel following the initial plosive.The extracted features were the same asdescribed by Hunt & Black (1996), i.e.MFCCs, log power and F0. The Snack toolSPEATURES (Sjölander, <strong>2009</strong>) was used toextract 13 MFCCs. F0 and log power were extractedusing the Snack tools PITCH andPOWER, respectively.Calculation of join costJoin costs between all possible speech segmentcombinations (i.e. all combinations of a targetsegment from the target corpus and a remaindersegment from the remainder corpus) were calculatedas the sum of1. the Euclidean distance (Taylor, 2008) in F02. the Euclidean distance in log power199
<strong>Proceedings</strong>, FONETIK <strong>2009</strong>, Dept. of Linguistics, Stockholm University3. the Mahalanobis distance (Taylor, 2008)for the MFCCsF0 distance was weighted by 0.5. A penalty of10 was given to those segments from the targetcorpus where the vowel following the initialplosive was not /a/, i.e. a different vowel thanthe one in the remainder corpus. The F0weighting factor and the vowel-penalty valuewere arrived at after iterative tuning. The distanceswere calculated using a combination ofPerl and Microsoft Excel.ConcatenationFor each possible segment combination((/p|t|k/) + (/ap|at|ak/), i.e. 9 possible combinationsin total), the join costs were ranked. Thefive combinations with the lowest costs withineach of these nine categories were then concatenatedusing the Snack tool CONCAT. Concatenationpoints were located to zero-crossingswithin a range of 15 samples after the middle ofthe vowel following the initial plosive. (And ifno zero-crossing was found within that range,the concatenation point was set to the middle ofthe vowel.)Evaluation7 adult subjects were recruited to perform a listeningtest. All subjects were native Swedes,with no known hearing problems and naïve inthe sense that they had not been involved in anywork related to speech synthesis development.A listening test was constructed in Tcl/Tk topresent the 45 stimuli (i.e. the five concatenationswith the lowest costs for each of the ninedifferent syllables) and 9 original recordings ofthe different syllables. The 54 stimuli were allrepeated twice (resulting in a total of 108items) and presented in random order. The taskfor the subjects was to decide what syllablethey heard (by selecting one of the nine possiblesyllables) and judge the naturalness of theutterance on a scale from 0 to 100. The subjectshad the possibility to play the stimuli as manytimes as they wanted. Before starting the actualtest, 6 training items were presented, afterwhich the subjects had the possibility of askingquestions regarding the test procedure.Statistical analysisInter-rater agreement was assessed via the intraclasscorrelation (ICC) coefficient (2, 7) forsyllable identification accuracy and naturalnessrating separately.Pearson correlations were used to assess intra-rateragreement for each listener separately.ResultsThe results of the evaluation are presented inTable 1.Table 1. Evaluation results for the concatenatedand original speech samples. The first column displaysthe percentage of correctly identified syllables,and the second column displays the averagenaturalness judgments (max = 100).% correct syll NaturalnessConcatenated 94% 49 (SD: 20)Original 100% 89 (SD: 10)The listeners demonstrated high inter-rateragreement on naturalness rating (ICC = 0.93),but lower agreement on syllable identificationaccuracy (ICC = 0.79).Average intra-rater agreement for all listenerswas 0.71 on naturalness rating, and 0.72 onsyllable identification accuracy.DiscussionConsidering that the purpose of this study wasto study the possibilities of generating understandableand close to natural sounding concatenationsof segments from different speakers,the results are actually quite promising.The listeners’ syllable identification accuracyof 94% indicates that comprehensibility is not abig problem. Although the total naturalnessjudgement average of 49 (of 100) is not at allimpressive, an inspection of the individualsamples reveals that there are actually someconcatenated samples that receive higher naturalnessratings than original samples. Thus, theresults confirm that it is indeed possible to generateclose to natural sounding samples by concatenatingspeech from different speakers.However, when considering that the long-termgoal is a working system that can be implementedand used to assist phonological therapywith children, the system is far from complete.As of now, the amount of manual interventionrequired to run the re-synthesis process islarge. Different tools were used to completedifferent steps (various Snack tools, MicrosoftExcel), and Perl scripts were used as interfacesbetween these steps. Thus, there is still a longway to real-time processing. Moreover, it isstill limited to voiceless plosives in sentenceinitialpositions, and ideally, the system should200
<strong>Proceedings</strong>, FONETIK <strong>2009</strong>, Dept. of Linguistics, Stockholm Universitybe more general. However, considering thatchildren usually master speech sounds in wordinitialand word-final positions later than inword-medial positions (Linell & Jennische,1980), this limitation should not be disqualifyingon its own.The speech data in this work came fromadult speakers. New challenges can be expectedwhen faced with children’s voices, e.g. increasedvariability in the speech database(Gerosa et al, 2007). Moreover, variability inthe speech of the intended user - the child in thetherapy room - can also be expected. (Not tomention the variability from child to child inmotivation and ability and will to comply withthe therapist’s intervention plans.)The evaluation showed that there is muchroom for improving naturalness, and fortunately,some improvement strategies can besuggested. First, more manipulations withweighting factors might be a way to assure thatthe combinations that are ranked the highest arealso the ones that sound the best. As of now,this is not always the case. During the course ofthis investigation, attempts were made at increasingthe size of the target corpus, by includingword-initial voiceless plosives within utterancesas well. However, these efforts did notimprove the quality of the output concatenatedspeech samples. The current system does notinvolve any spectral smoothing; this might be away to polish the concatenation joints to improvenaturalness.Looking beyond the context of modified resynthesisto assist therapy with children withphonological impairments, the finding that it isindeed possible to generate natural soundingconcatenations of segments from differentspeakers might be valuable in concatenativesynthesis development in general. This mightbe useful in the context of extending a speechdatabase if the original speaker is no longeravailable, e.g. with new phonemes. However, itseems reasonable to assume that the method isonly applicable to voiceless segments.AcknowledgementsThis work was funded by The Swedish GraduateSchool of Language Technology (GSLT).ReferencesCarlson, R. & Granström, B. (2005) Datadrivenmultimodal synthesis. Speech Communication47, 182-193.Gerosa, M., Gioliani, D. & Brugnara, F. (2007)Acoustic variability and automatic recognitionof children’s speech. Speech Communication49, 847-835.Hewlett, N. (1992) Processes of developmentand production. In Grunwell, P. (ed.) DevelopmentalSpeech Disorders, 15-38. London:Whurr.Hunt, A. and Black, A. (1996) Unit selection ina concatenative speech synthesis system usinga large speech database. <strong>Proceedings</strong> ofICASSP 96 (Atlanta, Georgia), 373-376.Iskra, D., Grosskopf, B., Marasek, K., Van DenHeuvel, H., Diehl, F., and Kiessling, A.(2002) Speecon - speech databases for consumerdevices: Database specification andvalidation.Linell, P. & Jennische, M. (1980) Barns uttalsutveckling,Stockholm: Liber.Locke, J.L. & Pearson, D.M. (1992) VocalLearning and the Emergence of PhonologicalCapacity. A Neurobiological Approach.In C.A. Ferguson, L. Menn & C. Stoel-Gammon (Eds.), Phonological Development.Models, research, implications.,York: York Press.Protopapas, A. (1998) Modified LPC resynthesisfor controlling speech stimulus discriminability.136th Annual Meeting of theAcoustical Society of America, Norfolk,VA, October 13-16.Ramus, F. & Mehler, J. (1999) Language identificationwith suprasegmental cues: A studybased on speech resynthesis, Journal of theAcoustical Society of America 105, 512-521.Shuster, L. I. (1998) The perception of correctlyand incorrectly produced /r/. Journalof Speech, Language and Hearing Research41, 941-950.Sjölander, K. The Snack sound toolkit, Departmentof Speech, Music and Hearing,KTH, Stockholm, Sweden. Online:http://www.speech.kth.se/snack/, 1997-2004, accessed on April 12, <strong>2009</strong>.Sjölander, K. (2003) An HMM-based systemfor automatic segmentation and alignmentof speech. <strong>Proceedings</strong> of <strong>Fonetik</strong> 2003(Umeå University, Sweden), PHONUM 9,93-96.Taylor, P. (2008) Text-to-Speech Synthesis,Cambridge University Press.Wik, P. (2004) Designing a virtual languagetutor. <strong>Proceedings</strong> of <strong>Fonetik</strong> 2004 (StockholmUniversity, Sweden), 136-139.201
<strong>Proceedings</strong>, FOETIK <strong>2009</strong>, Dept. of Linguistics, Stockholm UniversityCross - modal Clustering in the Acoustic - ArticulatorySpaceG. Ananthakrishnan and Daniel M. eibergCentre for Speech Technology, CSC, KTH, Stockholmagopal@kth.se, neiberg@speech.kth.seAbstractThis paper explores cross-modal clustering inthe acoustic-articulatory space. A method toimprove clustering using information frommore than one modality is presented. Formantsand the Electromagnetic Articulography measurementsare used to study corresponding clustersformed in the two modalities. A measurefor estimating the uncertainty in correspondencesbetween one cluster in the acousticspace and several clusters in the articulatoryspace is suggested.IntroductionTrying to estimate the articulatory measurementsfrom acoustic data has been of specialinterest for long time and is known as acousticto-articulatoryinversion. Though this mappingbetween the two modalities expected to be aone-to-one mapping, early research presentedsome interesting evidence showing nonuniqueness,in this mapping. Bite-block experimentshave shown that speakers are capableof producing sounds perceptually close to theintended sounds even though the jaw is fixed inan unnatural position (Gay et al., 1981). Mermelstein(1967) and Schroeder (1967) haveshown, through analytical articulatory models,that the inversion is unique to a class of areafunctions rather than a unique configuration ofthe vocal tract.With the advent of measuring techniqueslike Electromagnetic Articulography (EMA)and X-Ray Microbeam, it was possible to collectsimultaneous measurements of acousticsand articulation during continuous speech. Severalattempts have been made by researchers toperform acoustic-to-articulatory inversion byapplying machine learning techniques to theacoustic-articulatory data (Yehia et al., 1998and Kjellström and Engwall, <strong>2009</strong>). The statisticalmethods applied to the problem of mappingbrought a new dimension to the concept ofnon-uniqueness in the mapping. In the deterministiccase, one can say that if the same acousticparameters are produced by more than one articulatoryconfiguration, then the particularmapping is considered to be non-unique. It isalmost impossible to show this using real recordeddata, unless more than one articulatoryconfiguration produces exactly the same acousticparameters. However, not finding such instancesdoes not imply that non-uniquenessdoes not exist.Qin and Carreira-Perpinán (2007) proposedthat the mapping is non-unique if, for a particularacoustic cluster, the corresponding articulatorymapping may be found in more than onecluster. Evidence of non-uniqueness in certainacoustic clusters for phonemes like /ɹ/, /l/ and/w/ was presented. The study by Qin quantizedthe acoustic space using the perceptual Itakuradistance on LPC features. The articulatoryspace was clustered using a nonparametricGaussian density kernel with a fixed variance.The problem with such a definition of nonuniquenessis that one does not know what isthe optimal method and level of quantizationfor clustering the acoustic and articulatoryspaces.A later study by Neiberg et. al. (2008) arguedthat the different articulatory clustersshould not only map onto a single acoustic clusterbut should also map onto acoustic distributionswith the same parameters, for it to becalled non-unique. Using an approach based onfinding the Bhattacharya distance between thedistributions of the inverse mapping, they foundthat phonemes like /p/, /t/, /k/, /s/ and /z/ arehighly non-unique.In this study, we wish to observe how clustersin the acoustic space map onto the articulatoryspace. For every cluster in the acousticspace, we intend to find the uncertainty in findinga corresponding articulatory cluster. It mustbe noted that this uncertainty is not necessarilythe non-uniqueness in the acoustic-toarticulatorymapping. However, finding this uncertaintywould give an intuitive understanding202
<strong>Proceedings</strong>, FOETIK <strong>2009</strong>, Dept. of Linguistics, Stockholm Universityabout the difficulties in the mapping for differentphonemes.Clustering the acoustic and articulatoryspaces separately, as was done in previous studiesby Qin and Carreira-Perpinán (2007) as wellas Neiberg et al. (2008), leads to hard boundariesin the clusters. The cluster labels for theinstances near these boundaries may estimatedincorrectly, which may cause an over estimationof the uncertainty. This situation is explainedby Fig. 1 using synthetic data where wecan see both the distributions of the syntheticdata as well as the Maximum A-posterioriProbability (MAP) Estimates for the clusters.We can see that, because of the incorrect clustering,it seems as if data belonging to one clusterin mode A belongs to more than one clusterin mode B.In order to mitigate this problem, we havesuggested a method of cross-modal clusteringwhere both the available modalities are madeuse of by allowing soft boundaries for the clustersin each modality. Cross-modal clusteringhas been dealt with in detail under several contextsof combining multi-modal data. Coen(2005) proposed a self supervised methodwhere he used acoustic and visual features tolearn perceptual structures based on temporalcorrelations between the two modalities. Heused the concept of slices, which are topologicalmanifolds encoding dynamic states. Similarly,Belolli et al.(2007) proposed a clusteringalgorithm using Support Vector Machines(SVMs) for clustering inter-related text datasets.The method proposed in this paper does notmake use of correlations, but mainly uses coclusteringproperties between the two modalitiesin order to perform the cross-modal clustering.Thus, even non-linear dependencies (uncorrelated)may also be modeled using thissimple method.TheoryWe assume that the data is a Gaussian MixtureModel (GMM). The acoustic space Y = {y 1 ,y 2 …y } with ‘’ data points is modelled using‘I’ Gaussians, {λ 1 , λ 2 ,…λ I } and the articulatoryspace X = {x 1 , x 2 …x } is modelled using ‘K’Gaussians, {γ 1 ,γ 2 ,….γ K }. ‘I’ and ‘K’ areobtained by minimizing the BayesianInformation Criterion (BIC). If we know whicharticulatory Gaussian a particular data pointbelongs to, say, γ k The correct acousticGaussian ‘λ n ’ for the the ‘n th ’ data point havingacoustic features ‘y n ’ and articulatory features‘x n ’ is given by the maximum cross-modal a-posteriori probabilityλ = arg max P( λ | x , y , γ )n i n n k1≤i ≤I= arg max p( xn, yn| λi , γ k )*P( λi | γ k )*P( γ k )1≤i≤I(1)The knowledge about the articulatory clustercan then be used to improve the estimate of theFigure 1. The figures above show a synthesizedexample of data in two modalities. The figuresbelow show how MAP hard clustering may bringabout an effect of uncertainty in the correspondencebetween clusters in the two modalities.correct acoustic cluster and vice versa as shownbelowγ = arg max p( x , y | λ , γ )*P( γ | λ )*P( λ )n n n i k k i i1≤k ≤K(2)Where P(λ|γ) is the cross-modal prior and thep(x,y|λ,γ) is the joint cross-modal distribution.If the first estimates of the correct clusters areMAP, then the estimates of the correct clustersof the speech segments are improvedFigure 2. The figures shows an improved86420286420246 4 2 0 2 4 6 8864202Mode AMode A46 4 2 0 2 4 6 8Mode A46 4 2 0 2 4 6 824 2 0 2 4 6 8 10 12performance and soft boundaries for the syntheticdata using cross-modal clustring, here the effect ofuncertainty in correspondences is less.121086420121024 2 0 2 4 6 8 10 1286420121086420Mode BMode BMode B24 2 0 2 4 6 8 10 12203
<strong>Proceedings</strong>, FOETIK <strong>2009</strong>, Dept. of Linguistics, Stockholm University
<strong>Proceedings</strong>, FOETIK <strong>2009</strong>, Dept. of Linguistics, Stockholm Universitymeasure of the uncertainty in prediction, andthus forms an intuitive measure for ourpurpose. It is always between 0 and 1 and socomparisons between different cross-modalclusterings is easy. 1 indicates very highuncertainty while 0 indicates one-to-onemapping between corresponding clusters in thetwo modalities.Experiments and ResultsThe MOCHA-TIMIT database (Wrench, 2001)was used to perform the experiments. The dataconsists of simultaneous measurements ofacoustic and articulatory data for a femalespeaker. The articulatory data consisted of 14channels, which included the X and Y-axispositions of EMA coils on 7 articulators, theLower Jaw (LJ), Upper Lip (UL), Lower Lip(LL), Tongue Tip (TT), Tongue Body (TB),Tongue Dorsum (TD) and Velum (V). Onlyvowels were considered for this study and theacoustic space was represented by the first 5formants, obtained from 25 ms acousticwindows shifted by 10 ms. The articulatorydata was low-pass fitered and down-sampled inorder to correspond with acoustic data rate. Theuncertainty (U) in clustering was estimatedusing Equation 3 for the British vowels, namely/ʊ, æ, e, ɒ, ɑ:, u:, ɜ:ʳ, ɔ:, ʌ, ɩ:, ə, ɘ/. Thearticulatory data was first clustered for all thearticulatory channels and then was clusteredindividually for each of the 7 articulators.Fig. 3 shows the clusters in both theacoustic and articulatory space for the vowel/e/. We can see that data points correspondingto one cluster in the acoustic space (F1-F2formant space) correspond to more than onecluster in the articulatory space. The ellipses,which correspond to initial clusters are replacedby different clustering labels estimated by theMCMAP algorithm. So though the acousticfeatures had more than one cluster in the firstestimate, after cross-modal clustering, all theinstances are assigned to a single cluster.Fig. 4 shows the correspondences betweenacoustic clusters and the LJ for the vowel /ə/.We can see that the uncertainty is less for someof the clusters, while it is higher for someothers. Fig. 5 shows the comparative measuresof overall the uncertainty (over all thearticulators), of the articulatory clusterscorresponding to each one of the acousticclusters for the different vowels tested. Fig 6.shows the correspondence uncertainty ofindividual articulators.UncertaintyFigure 5. The figure shows the overalluncertainty (for the whole articulatoryconfiguration) for the British vowels.Uncertainty0.90.80.70.60.50.40.30.20.106543210Overall Uncertainty for the Vowelsʊ æ e ɒ ɑ: u: ɜ:ʳ ɔ: ʌ ɩ: ə ɘVow elsUncertainty for Individual Articulatorsʊ æ e ɒ ɑ: u: ɜ:ʳ ɔ: ʌ ɩ: ə ɘFigure 6. The figure shows the uncertainty forindividual articulators for the British vowels.DiscussionFrom Fig. 5 it is clear that the shorter vowelsseem to have more uncertainty than longervowels which is intuitive. The higher uncertaintyis seen for the short vowels /e/ and /ə/,while there is almost no uncertainty for the longvowels /ɑ:/ and /ɩ:/. The overall uncertainty forthe entire configuration is usually around thelowest uncertainty for a single articulator. Thisis intuitive, and shows that even though certainarticulator correspondences are uncertain, thecorrespondences are more certain for the overallconfiguration. When the uncertainty for individualarticulators is observed, then it is apparentthat the velum has a high uncertainty ofmore than 0.6 for all the vowels. This is due tothe fact that nasalization is not observable inthe formants very easily. So even though differentclusters are formed in the articulatory space,they are seen in the same cluster in the acousticspace. The uncertainty is much less in the lowerlip correspondence for the long vowels /ɑ:/, /u:/and /ɜ:ʳ/ while it is high for /ʊ/ and /e/. The TDshows lower uncertainty for the back vowels/u:/ and /ɔ:/. The uncertainty for TD is higherVTDTBTTLLULLJ205
<strong>Proceedings</strong>, FOETIK <strong>2009</strong>, Dept. of Linguistics, Stockholm Universityfor the front vowels like /e/ and /ɘ/. Theuncertainty for the tongue tip is lower for thevowels like /ʊ/ and /ɑ:/ while it is higher for/ɜ:ʳ/ and /ʌ/. These results are intuitive, andshow that it is easier to find correspondencesbetween acoustic and articulatory clusters forsome vowels, while it is more difficult for others.Conclusion and Future WorkThe algorithm proposed, helps in improving theclustering ability using information from multiplemodalities. A measure for finding out uncertaintyin correspondences between acousticand articulatory clusters has been suggested andempirical results on certain British vowels havebeen presented. The results presented are intuitiveand show difficulties in making predictionsabout the articulation from acoustics for certainsounds. It follows that certain changes in thearticulatory configurations cause variation inthe formants, while certain articulatory changesdo not change the formants.It is apparent that the empirical results presenteddepend on the type of clustering and initializationof the algorithm. This must be explored.Future work must also be done on extendingthis paradigm to include other classesof phonemes as well as different languages andsubjects. It would be interesting to see if theseempirical results can be generalized or are specialto certain subjects and languages and accents.Kjellström, H. and Engwall, O. (<strong>2009</strong>) Audiovisual-to-articulatoryinversion. SpeechCommunication 51(3), 195-209.Mermelstein, P., (1967) Determination of theVocal-Tract Shape from Measured FormantFrequencies, J. Acoust. Soc. Am. 41, 1283-1294.Neiberg, D., Ananthakrishnan, G. and Engwall,O. (2008) The Acoustic to ArticulationMapping: Non-linear or Non-unique? <strong>Proceedings</strong>of Interspeech, 1485-1488.Qin, C. and Carreira-Perpinán, M. Á. (2007) AnEmperical Investigation of the Nonuniquenessin the Acoustic-to-Articulatory Mapping.<strong>Proceedings</strong> of Interspeech, 74–77.Schroeder, M. R. (1967) Determination of thegeometry of the human vocal tract by acousticmeasurements. J. Acoust. Soc. Am41(2), 1002–1010.Wrench, A. (1999) The MOCHA-TIMIT articulatorydatabase. Queen Margaret UniversityCollege, Tech. Rep, 1999. Online:http://www.cstr.ed.ac.uk/research/projects/artic/mocha.html.Yehia, H., Rubin, P. and Vatikiotis-Bateson.(1998) Quantitative association of vocaltractand facial behavior. Speech Communication26(1-2), 23-43.AcknowledgementsThis work is supported by the SwedishResearch Council project 80449001, Computer-Animated Language Teachers.ReferencesBolelli L., Ertekin S., Zhou D. and Giles C. L.(2007) K-SVMeans: A Hybrid ClusteringAlgorithm for Multi-Type Interrelated Datasets.International Conference on Web Intelligence,198–204.Coen M. H. (2005) Cross-Modal Clustering.<strong>Proceedings</strong> of the Twentieth National Conferenceon Artificial Intelligence, 932-937.Gay, T., Lindblom B. and Lubker, J. (1981)Production of bite-block vowels: acousticequivalence by selective compensation. J.Acoust. Soc. Am. 69, 802-810, 1981.206
<strong>Proceedings</strong>, FONETIK <strong>2009</strong>, Dept. of Linguistics, Stockholm University207
<strong>Proceedings</strong>, FONETIK <strong>2009</strong>, Dept. of Linguistics, Stockholm UniversitySwedish phonetics 1939-1969Paul TouatiFrench Studies, Centre for Languages and Literature, Lund UniversityAbstractThe aim of the current project (“Swedish Phonetics’39-‘69”) is to provide an account of thehistorical, social, discursive, and rhetoric conditionsthat determined the emergence of phoneticscience in Sweden between 1939 and1969. The inquiry is based on a investigation infour areas: how empirical phonetic data wereanalysed in the period, how the disciplinegained new knowledge about phonetic factsthrough improvements in experimental settings,how technological equipment specially adaptedto phonetic research was developed, and howdiverging phonetic explanations became competingparadigms. Understanding of the developmentof phonetic knowledge may be synthesisedin the persona of particularly emblematicphoneticians: Bertil Malmberg embodied theboom that happened in the field of Swedishphonetics during this period. The emergence ofinternationally recognized Swedish research inphonetics was largely his work. This investigationis based on two different corpora. The firstcorpus is the set of 216 contributions, the fullauthorship of Malmberg published between1939 and 1969. The second corpus is his archive,owned by Lund University. It includessemi-official and official letters, administrativecorrespondence, funding applications (…). Thetwo are complementary. The study of both isnecessary for achieving a systematic descriptionof the development of phonetic knowledgein Sweden.Research in progressThe aim of the current project (“Swedish Phonetics’39-’69”) is to provide an account of thehistorical, social, discursive, and rhetoric conditionsthat determined the emergence of phoneticscience in Sweden during a thirty year period,situated between 1939 and 1969 (seeTouati <strong>2009</strong>; Touati forthcoming). The inquiryis based on a systematic investigation essentiallyin four areas: how empirical phonetic datawere analysed in the period, how the disciplinegained new knowledge about phonetic factsthrough improvements in experimental settings,how technological equipment specially adaptedto phonetic research was developed, and howdiverging phonetic explanations became competingparadigms.The claim sustaining this investigation isthat knowledge is a product of continually renewedand adjusted interactions between a seriesof instances, such as: fundamental research,institutional strategies and the ambition of individualresearchers. In this perspective, the inquirywill demonstrate that phonetic knowledgewas grounded first by discussions on the validityof questions to be asked, then by an evaluationin which results were “proposed, negotiated,modified, rejected or ratified in andthrough discursive processes” (Mondada 1995)and finally became facts when used in scientificarticles. Therefore, in order to understand theconstruction of this knowledge, it seems importantto undertake both a study of the phoneticcontent and of the rhetoric and the discursiveform used in articles explaining and propagatingphonetic facts. A part of this research is inthis way related to studies on textuality (Broncarkt1996), especially those devoted to “academicwriting” (Berge 2003; Bondi & Hyland2006; Del Lungo Camiciotti 2005; Fløttum &Rastier 2003; Ravelli & Ellis 2004; Tognini -Bonelli) and to studies on metadiscourse andinteractional resources (Hyland 2005; Hyland& Tse 2006; Kerbrat-Orecchioni 2005; Ädel2006).Understanding of the development of phoneticknowledge may be synthesised in the personaof particularly emblematic phoneticians.Among these, none has better than BertilMalmberg 1 [1913-1994] embodied the boomthat happened in the field of Swedish phonetics.The emergence of internationally recognizedSwedish research in phonetics was largely hiswork. As Rossi (1996: 99) wrote: “Today, allphoneticians identify with this modern conceptof phonetics that I will hereafter refer to, followingSaussure, as speech linguistics. Themuch admired and respected B. Malmberg significantlycontributed to the development ofthis concept in Europe”.208
<strong>Proceedings</strong>, FONETIK <strong>2009</strong>, Dept. of Linguistics, Stockholm UniversityThe starting date, “the terminus a quo” chosenfor the study is set in 1939, the year of thefirst publication by Malmberg, entitled "Vad ärfonologi?" (What is phonology?). The “terminusad quem” is fixed to 1969 when Malmbergleft phonetics for the newly created chair ingeneral linguistics at the University of Lund.CorporaMalmberg's authorship continued in an unbrokenflow until the end of his life. The list of hispublications, compiled as “Bertil MalmbergBibliography” by Gullberg (1993), amounts to315 titles (articles, monographs, manuals, reports).The first corpus on which I propose to conductmy analysis is the set of 216 contributions,the full authorship of Bertil Malmberg publishedbetween 1939 and 1969. The second corpusis his archive, owned by Lund University(“Lunds universitetsarkiv, Inst. f. Lingvistik,Prefektens korrespondens, B. Malmberg”) Itincludes semi-official and official letters, administrativecorrespondence, inventories, fundingapplications, administrative orders, transcriptsof meetings. In its totality, this corpusreflects the complexity of the social and scientificlife at the Institute of Phonetics. Malmbergenjoyed writing. He sent and received considerablenumbers of letters. Among his correspondentswere the greatest linguists of his time(Benveniste, Delattre, Dumezil, Fant, Halle,Hjelmslev, Jakobson, Martinet), as well as colleagues,students, and representatives of thenon-scientific public. Malmberg was a perfectpolyglot. He took pleasure in using the languageof his correspondent. The letters are inSwedish, German, English, Spanish, Italian,and in French, the latter obviously the languagefor which he had a predilection.The first corpus consists of texts in phonetics.They will be analysed primarily in terms oftheir scientific content (content-oriented analysis).The second corpus will be used to describethe social and institutional context (contextorientedanalysis). The two are complementary.The study of both is necessary for achieving asystematic description of the development ofphonetic knowledge. While the articles publishedin scientific journals are meant to ensurethe validity of the obtained knowledge by followingstrict research and writing procedures,the merit of the correspondence is to unveil in aunique, often friendly, sometimes astonishingway that, on the contrary, knowledge is unstableand highly subject to negotiation.The phoneticianBertil Malmberg was born on April 22, 1913 inthe city of Helsingborg, situated in Scania insouthern Sweden (see also Sigurd 1995). In theautumn of 1932, then aged nineteen, he beganto study at the University of Lund. He obtainedhis BA in 1935. During the following academicyear (1936-1937), he went to Paris to studyphonetics with Pierre Fouché [1891-1967].That same year he discovered phonologythrough the teaching of André Martinet [1908-1999]. Back in Lund, he completed his highereducation on October 5, 1940 when he defendeda doctoral dissertation focused on a traditionaltopic of philology. He was appointed"docent" in Romance languages on December6, 1940.After a decade of research, in November 24,1950, Malmberg finally reached the goal of hisambitions, both personal and institutional. Phoneticsciences was proposed as the first chair inphonetics in Sweden and established at theUniversity of Lund, at the disposal of Malmberg.Phonetics had thus become an academicdiscipline and received its institutional recognition.Letters of congratulation came from farand wide. Two of them deserve special mention.They are addressed to Malmberg by twomajor representatives of contemporary linguistics,André Martinet and Roman Jakobson.Martinet's letter is sent from Columbia University:« Cher Monsieur, / Permettez-moi toutd’abord de vous féliciter de votre nomination.C’est le couronnement bien mérité de votrebelle activité scientifique au cours des années40. Je suis heureux d’apprendre que vous allezpouvoir continuer dans de meilleures conditionsl’excellent travail que vous faites enSuède.» Jakobson's letter, sent from HarvardUniversity early in 1951, highlights the factthat the appointment of Malmberg meant theestablishment of a research centre in phoneticsand phonology in Sweden: “[...] our warmestcongratulations to your appointment. Finallyphonetics and phonemics have an adequate centerin Sweden”. As can be seen, both are delightednot only by Malmberg's personal successbut also by the success of phonetics as anacademic discipline.209
<strong>Proceedings</strong>, FONETIK <strong>2009</strong>, Dept. of Linguistics, Stockholm UniversityA point of departure: Two articlesMalmberg started his prolific authorship in1939 with an article dedicated to the new Praguephonology. For this inaugural article,Malmberg set the objective to inform Swedishlanguage teachers about a series of fundamentalphonological concepts such as function, phoneme,opposition and correlation, concepts advancedby the three Russian linguists R. Jakobson[1896-1982], S. Karcevskij [1884-1995]and N.S. Trubetzkoy [1890-1938]. To emphasizethe revolutionary aspects of Prague phonology,Malmberg started off by clarifying thedifference between phonetics and phonology:« Alors que la phonétique se préoccupe desfaits sonores à caractère langagier et qu’elle sepropose de décrire de manière objective, voireexpérimentale, les différentes phases de la productionde la parole et ce faisant du rôle desorganes phonatoires, la phonologie fixe son attentionuniquement sur la description des propriétésde la parole qui ont un rôle fonctionnel» (Malmberg, 1939 : 204.)He praised Prague phonology in its effort toidentify and systematize functional linguisticforms, but did not hesitate to pronounce severecriticism against Trubetzkoy and his followerswhen they advocated phonology as a sciencestrictly separate from phonetics. Malmberg sustainedthe idea that phonology, if claimed to bea new science, must engage in the search forrelationships between functional aspects ofsounds and their purely phonetic propertieswithin a given system – a particular language.His article includes examples borrowed fromFrench, German, Italian, Swedish and Welsh.For Malmberg, there is no doubt that « la phonologieet la phonétique ne sont pas des sciencesdifférentes mais deux points de vue sur unmême objet, à savoir les formes sonores du langage» (Malmberg 1939 : 210).The first article in experimental phoneticswas published the following year (Malmberg1940) but was based on research conductedduring his stay in Paris 1937-1938. Advisedand encouraged by Fouché, Malmberg tackles,in this first experimental work, an importantproblem of Swedish phonetics, namely the descriptionof musical accents. In the resultingarticle, he presents the experimental protocol asfollows:« On prononce le mot ou la phrase en questiondans une embouchure reliée par un tube élastiqueà un diaphragme phonographique pourvud’un style inscripteur et placé devant un cylindreenregistreur. Le mouvement vibratoire de lacolonne d’air s’inscrit sur un papier noirci sousla forme d’une ligne sinueuse. » (Malmberg1940: 63)The first analysed words anden vs. anden(‘soul’ vs. ‘duck’) revealed a difference in tonalmanifestation. More examples of minimal pairsof word accents, displayed in figures andcurves confirmed the observation. Malmbergclosed his article by putting emphasis on thesignificance of word accents as an importantresearch area in experimental phonetics:« Il y aurait ici un vaste champ de travail pourla phonétique expérimentale, surtout si onconsidère toutes les variations dialectales et individuellesqui existent dans le domaine deslangues suédoise et norvégienne. » (Malmberg1940: 76)Final year in phonetics (1968)Malmberg's correspondence during the year1968 is particularly interesting. It containsabundant information, not least about the varietyof people writing to Malmberg, of issuesraised, and about how Malmberg introducedevents of his private life, health, social and institutionalactivities in his letters. Some exampleswill demonstrate the rich contents of theletters, here presented chronologically (while inthe archive, the correspondence is in alphabeticalorder (based on the initial of the surname ofthe correspondent):January: The year 1968 began as it should!On January 4, representatives of students sent aquestionnaire concerning the Vietnam War toProfessor Malmberg. They emphasized that,they particularly desired answers from thegroup of faculty professors. Malmberg apparentlyneglected to answer. Hence a reminderwas dispatched on January 12. A few dayslater, Malmberg received a prestigious invitationto participate in a "table ronde", a paneldiscussion on structuralism and sociology. Theinvitation particularly stressed the presence tobe of Lévi-Strauss and other eminent professorsof sociology and law. We learn from Malmberg'sresponse, dated February 12, that he haddeclined the invitation for reasons of poorhealth. January also saw the beginning of animportant correspondence between Malmbergand Max Wajskop [1932-1993]. In this correspondence,some of Malmberg's letters were210
<strong>Proceedings</strong>, FONETIK <strong>2009</strong>, Dept. of Linguistics, Stockholm Universitygoing to play a decisive role for the genesis ofphonetics in Belgium, and subsequently also inthe francophone world at large (see Touati,forthcoming).February: On February 8, Sture Allen [born1928] invites Malmberg to participate in a radioprogram on "Vad är allmän språkvetenskap?"(What is general linguistics?). Once more, hehad to decline for reasons of health (letter ofFebruary 12). On February 19, the universityadministration informs that there were threeapplicants for the post as lecturer in phoneticsat the University of Lund: C.-C. Elert, E. Gårdingand K. Hadding-Kock.March: The school specialized in educationof deaf children in Lund asks Malmberg to helpreflect on new structures for its future functioning.April: Malmberg gives a lecture on “Fonetiskaaspekter på uttalsundervisningen i skolor<strong>för</strong> hörande och hörselskadade” (Phonetic aspectsin the teaching of pronunciation inschools for the deaf and hearing disabled).September: The student union informsMalmberg that a Day's Work for the benefit ofthe students in Hanoi will be organised duringthe week of September 21 to 29.October: A letter of thanks is sent to HansVogt, professor at the University of Oslo, forthe assessment done in view of Malmberg's appointmentto the chair of general linguistics inLund. That same month he received a ratheramusing letter from a young man from Sundsvallwho asks for his autograph as well as asigned photograph. The young man expands onthat his vast collection already boasts the autographof the king of Sweden. Malmberg grantsthe wishes of his young correspondent on November4.November: A "docent" at the University ofUppsala who disagrees with his colleaguesabout the realization of schwa asks Malmbergto serve as expert and make a judgment in thematter. In late November, Malmberg has to goto Uppsala to attend lectures given by applicantsfor two new Swedish professorships inphonetics, at the University of Uppsala and theUniversity of Umeå, respectively. Candidateswho will all become renowned professors inphonetics are Claes-Christan Elert, KerstinHadding-Koch, Björn Lindblom and Sven Öhman(In 1968 and 1969, there is a strong processof institutionalization of phonetics takingplace in Sweden).A theoretical dead-endIn an article just three pages long, Malmberg(1968) traces a brief history of phonemes. Theargument opens on a structuralist credo « Onest d’accord pour voir dans les éléments dulangage humain de toute grandeur et à tous lesniveaux de la description scientifique (contenu,expression, différentes fonctions, etc…), deséléments discrets. » Malmberg continues witha summary of the efforts of classical phoneticiansto produce that monument of phoneticknowledge - the International Alphabet - createdwith the ambition to reflect a universal andphysiological (articulatory according to Malmberg)description of phonemes. The authoritiesquoted here are Passy, Sweet, Sievers,Forchhammer and Jones. He continues by referringto « l’idée ingénieuse [qui] surgira dedécomposer les dits phonèmes […] en unitésplus petites et par là même plus générales et devoir chaque phonème comme une combinaison[…] de traits distinctifs ». In other words, herefers to "Preliminaries to Speech Analysis" byJakobson, Fant and Halle (1952), a publicationwhich may be considered a turning point inphonetics. Indeed, later in his presentation,Malmberg somehow refutes his own argumentabout the ability of acoustic properties to beused as an elegant, simple and unitary way formodelling sounds of language. He highlightsthe fact that spectrographic analysis reveals theneed for an appeal to a notion such as the locusin order to describe, in its complexity andvariation, the acoustic structure of consonants.Malmberg completed his presentation by emphasizingthe following:« Mais rien n’est stable dans le monde des sciences.En phonétique l’intérêt est en train de sedéplacer dans la direction des rapports stimuluset perception […] Si dans mon travail sur leclassement des sons du langage de 1952, j’avaisespéré retrouver dans les faits acoustiques cetordre qui s’était perdu en cours de route avecl’avancement des méthodes physiologiques, jedeviens maintenant de plus en plus enclin àchercher cet ordre non plus dans les spectresqui les spécifient mais sur le niveau perceptuel.Ma conclusion avait été fondée sur une fausseidée des rapports entre son et impression auditive.Je crois avoir découvert, en travaillant parexemple sur différents problèmes de la prosodie,que ces rapports sont bien plus compliquésque je l’avais pensé au début » (Malmberg1968 : 165)211
<strong>Proceedings</strong>, FONETIK <strong>2009</strong>, Dept. of Linguistics, Stockholm UniversityAs can be seen from reading these lines,Malmberg had the courage to recognize that hehad underestimated the difficulties pertaining tothe relationship between sound and auditoryimpression. It seems that Malmberg had thepremonition of the cognitive and central roleplayed by the perception of sounds but he wasnot able to recognise it properly since he wascaptive in his structural paradigm.To concludeIn a letter, dated October 30,1968, addressed tohis friend and fellow, the Spanish linguist A.Quilis, Malmberg says that he suffers from alimitation: “ Tengo miedo un poco del aspectomuy técnico y matemático de la fonética moderna.A mi edad estas cosas se aprendendifícilmente.” By the end of 1968, Malmberg isthus well aware of the evolution of phoneticsand thereby of what had become his own scientificlimitations. Empirical phonetic researchhad taken a radical technological orientation(see Grosseti & Boë 2008). It is undoubtedlywith some relief that he joined his new assignmentas professor of general linguistics.Notes1. And of course Gunnar Fant, the other grandold man of Swedish phonetics.ReferencesÄdel A. (2006) Metadiscourse in L1 and L2English. Amsterdam/Philadelphia: JohnBenjamins Publishing Company.Berge K.L. (2003) The scientific text genres associal actions: text theoretical reflections onthe relations between context and text inscientific writing. In Fløttum K. & RastierF. (eds) Academic discourse. Multidisciplinaryapproaches, 141-157, Olso: NovusPress.Broncarkt J.-P. (1996) Activité langagière, texteset discours. Pour un interactionnismesocio-discursif. Lausanne-Paris: Delachaux& Niestlé.Fløttum K. & Rastier F. (eds) (2003) Academicdiscourse. Multidisciplinary approaches.Olso: Novus Press.Gullberg, M. (1993) Bertil Malmberg Bibliography,Working Papers 40, 5-24.Grossetti M. & Boë L.-J. (2008) Sciences humaineset recherche instrumentale : qui instrumentequi ?. L’exemple du passage de laphonétique à la communication parlée. Revued’anthropologie des connaissances 3,97-114.Hyland K. (2005) Metadiscourse. ExploringInteraction in Writing, London-New York:Continum.Hyland K. & Bondi M. (eds.) (2006) AcademicDiscourse Across Disciplines. Bern: PeterLang.Kerbrat-Orecchioni C. (2005) Le discours eninteraction. Paris: Armand Colin.Malmberg, B. (1939) Vad är fonologi ?, ModernaSpråk XXXIII, 203-213.Malmberg, B. (1940) Recherches expérimentalessur l’accent musical du mot en suédois.Archives néerlandaises de Phonétique expérimentale,Tome XVL, 62-76.Malmberg, B. (1968) Acoustique, audition etperfection linguistique. Autour du problèmede l’analyse de l’expression du langage.Revue d’Acoustique 3-4, 163-166.Mondada L. (1995) La construction discursivedes objets de savoir dans l'écriture de lascience. Réseaux 71, 55-77.Ravelli L.J. & Ellis R.A. (2004) AnalysingAcademic Writing : Contextualized Frameworks.London : Continuum.Rossi M. (1996). The evolution of phonetics: Afundamental and applied science. SpeechCommunication, vol. 18, noº 1, 96-102.Sigurd B. (1995). Bertil Malmberg in memoriam.Working Papers 44,1-4.Tognini-Bonelli E .& Del Longo Camiciotti G.(eds.) (2005) Strategies in Academic Discourse.Amsterdam/Philadelphia: John BenjaminsPublishing Company.Touati P. (<strong>2009</strong>) De la construction discursiveet rhétorique du savoir phonétique en Suède: Bertil Malmberg, phonéticien (1939-1969). In Bernardini P, Egerland V &Grandfeldt J (eds) Mélanges plurilinguesofferts à Suzanne Schlyter à l’occasion deson 65éme anniversaire, Lund : Études romanesde Lund 85, 417-439.Touati P. (Forthcoming) De la médiation épistolairedans la construction du savoir scientifique.Le cas d’une correspondance entrephonéticiens. Revue d’anthropologie desconnaissances.212
<strong>Proceedings</strong>, FONETIK <strong>2009</strong>, Dept. of Linguistics, Stockholm University213
<strong>Proceedings</strong>, FONETIK <strong>2009</strong>, Dept. of Linguistics, Stockholm UniversityHow do Swedish encyclopedia users want pronunciationto be presented?Michaël StenbergCentre for Languages and Literature, Lund UniversityAbstractThis paper about presentation of pronunciationin Swedish encyclopedias is part of a doctoraldissertation in progress. It reports on a panelsurvey on how users view presentation of pronunciationby transcriptions and recordings,so-called audio pronunciations. The followingmain issues are dealt with: What system shouldbe used to render stress and segments? Forwhat words should pronunciation be given(only entry headwords or other words as well)?What kind of pronunciation should be presented(standard vs. local, original language vs.swedicized)? How detailed should a phonetictranscription be? How should ‘audio pronunciations’be recorded (human vs. syntheticspeech, native vs. Swedish speakers, male vs.female speakers)? Results show that a clearmajority preferred IPA transcriptions to ‘respelledpronunciation’ given in ordinary orthography.An even vaster majority (90%) didnot want stress to be marked in entry headwordsbut in separate IPA transcriptions. Onlya small number of subjects would consider usingaudio pronunciations made up of syntheticspeech.IntroductionIn spite of phonetic transcriptions having beenused for more than 130 years to show pronunciationin Swedish encyclopedias, very littleis known about the users’ preferences and theiropinion of existing methods of presenting pronunciation.I therefore decided to procure informationon this. Rather than asking a randomsample of more than 1,000 persons, as incustomary opinion polls, I chose to consult asmaller panel of persons with a high probabilityof being experienced users of encyclopedias.This meant a qualitative metod and more qualifiedquestions than in a mass survey.MethodA questionnaire made up of 24 multiple choicequestions was compiled. Besides these, therewere four introductory questions about age andlinguistic background. In order to evaluate thequestions, a pilot test was first made, with fiveparticipants: library and administrative staff,and students of linguistics, though not specializingin phonetics. This pilot test, conducted inMarch <strong>2009</strong>, resulted in some of the questionsbeing revised for the sake of clarity.The survey proper was carried out inMarch―April <strong>2009</strong>. Fifty-four subjects between19 and 80 years of age, all of them affiliatedto Lund University, were personally approached.No reward was offered for participating.Among them were librarians, administrativestaff, professors, researchers and students.Their academic studies comprised Linguistics(including General Linguistics andPhonetics) Logopedics, Audiology, Semiology,Cognitive Science, English, Nordic Languages,German, French, Spanish, Italian, Polish,Russian, Latin, Arabic, Japanese, TranslationProgram, Comparative Literature, Film Studies,Education, Law, Social Science, Medicine,Biology and Environmental Science. A majorityof the subjects had Swedish as their firstlanguage; however, the following languageswere also represented: Norwegian, Dutch, German,Spanish, Portuguese, Romanian, Russian,Bulgarian and Hebrew.The average time for filling in the 11-pagequestionnaire was 20 minutes. Each questionhad 2―5 answer options. As a rule, only one ofthem should be marked, but for questionswhere more than one option was chosen, eachsubject’s score was evenly distributed over theoptions marked. Some follow-up questionswere not to be answered by all subjects. In asmall number of cases, questions were mistakenlyomitted. The percentage of answers for acertain option has always been based on theactual number of subjects who answered eachquestion. For many of the questions, an opportunityfor comments was provided. In a fewcases, comments made by subjects have led toreinterpretation of their answers, i.e., if thechoice of a given option does not coincide with214
<strong>Proceedings</strong>, FONETIK <strong>2009</strong>, Dept. of Linguistics, Stockholm Universitya comment on it, the answer has been interpretedin accordance with the comment.Questions and resultsThe initial question concerned the main motivefor seeking pronunciation advice in encyclopedias.As might have been expected, a vast majority,69%, reported that they personally wantedto know the pronunciation of items theywere looking up, but, interestingly enough, for13%, the reason was to resolve disputes aboutpronunciation. Others used the pronunciationadvice to feel more secure in company or toprepare themselves for speaking in public.When it came to the purpose of the advicegiven, almost half of the subjects (44%) wantedit to be descriptive (presenting one or more existingpronunciations). The other options wereprescriptive and guiding, the latter principle beingadopted by several modern encyclopedias.For entries consisting of personal names, astriking majority, 97%, wanted pronunciationto be given not only for second (family) names,but also for first names, at least for persons whoare always referred to by both names. This resultis quite contrary to the prevalent traditionin Sweden, where pronunciation is provided exclusivelyfor second names. Somewhat surprisingly,a majority of 69% wanted pronunciation(or stress) only to be given for entry headings,not for scientific terms mentioned later. Of theremaining 31%, however, 76% wanted stress tobe marked in scientific terms, e.g., Calendulaofficinalis, mentioned either initially only oralso further down in the article text.Notation of prosodic featuresThe next section covered stress and tonal features.46% considered it sufficient to markmain stress, whereas main plus secondary stresswas preferred by 31%. The rest demanded evena third degree of stress to be featured. Such asystem has been used in John Wells’s LongmanPronunciation Dictionary, but was abandonedwith its 3rd edition (2008).70% of the subjects wanted tonal features tobe dipslayed, and 75% of those thoughtSwedish accent 1 and 2 and the correspondingNorwegian tonelag features would suffice to beshown.A number of systems for marking stressexist, both within phonetic transcriptions insquare brackets and outside these, in wordswritten in normal orthography. In table 1examples of systems for marking stress in entryheadings are given. However, subjects showeda strong tendency to dislike having stressmarked in entry headings. As many as 90%favoured a separate IPA transcription instead.According to the comments made, the reasonwas that they did not want the image of theorthograpic word to be disturbed by signs thatcould possibly be mistaken for diacritics.Table 1 shows five different ways ofmarking stress in orthographic words that thepanel had to evaluate. The corresponding IPAtranscriptions of the four words would be[noˈbɛl], [ˈmaŋkəl], [ˈramˌløːsa] and [ɧaˈmɑːn].Table 1. Examples of systems for marking mainstress in orthographic words: (a) IPA system asused by Den Store Danske Encyklopædi, (b) Nationalencyklopedin& Nordisk Familjebok 2nd edn.system, (c) SAOL (Swedish Academy Wordlist),Svensk uppslagsbok & NE:s ordbok system, (d) BraBöckers lexikon & Lexikon 2000 system, (e) Brockhaus,Meyers & Duden Aussprachewörterbuch system.1(a) Noˈbel ˈMankell ˈRamlösa schaˈman(b) Nobe´l Ma´nkell Ra´mlösa schama´n(c) Nobel´ Man´kell Ram´lösa schama´n(d) Nobel Mankell Ramlösa schaman(e) Nobel Mankell Ramlösa schamaṉIn case stress was still to be marked in entryheadings, the subjects’ preferences for theabove systems were as follows:(a) : 51 %(b) : 11 %(c) : 9 %(d) : 6 %(e) : 20 %As the figures show, this meant a strong supportfor IPA, whereas three of the systemswidely used in Sweden were largely dismissed.System (e) is a German one, used in works withMax Mangold in the board of editors. It has thesame economic advantages as (c), and is wellsuited for Swedish, where quantity is complementarydistributed between vowels and consonantsin stressed syllables. System (d), whichdoes not account for quantity, can be seen as asimplification of (e). It seems to have been introducedin Sweden by Bra Böckers Lexikon, avery widespread Swedish encyclopedia, havingthe Danish work Lademanns Leksikon as its215
<strong>Proceedings</strong>, FONETIK <strong>2009</strong>, Dept. of Linguistics, Stockholm Universitymodel, published from 1973 on and now supersededby Lexikon 2000. The only Swedish encyclopediawhere solely IPA transcriptions inbrackets are used appears to be Respons (1997—8), a minor work of c. 30,000 entries, whichis an adaptation of the Finnish Studia, aimed atyoung people. Its pronunciation system is, however,conceived in Sweden.It ought to be mentioned that SAOB (SvenskaAkademiens ordbok), the vast dictionary ofthe Swedish language, which began to be publishedin 1898 (sic!) and is still under edition,uses a system of its own. The above exampleswould be represented as follows: nåbäl 3 ,maŋ 4 kel, ram 3 lø 2 sa, ʃama4n. The digits 1—4represent different degrees of stress and areplaced in the same way as the stress marks insystem (c) above, their position thus denotingquantity, from which the quality of the a’scould, in turn, be derived. The digits also expressaccent 1 (in Mankell) and accent 2 (inRamlösa). Being complex, this system has notbeen used in any encyclopedia.Notation of segmentsFor showing the pronunciation of segments,there was a strong bias, 80%, in favour of theIPA, possibly with some modifications, whereasthe remaining 20% only wanted letters of theSwedish alphabet to be used. Two questionsconcerned the narrowness of transcriptions.Half of the subjects wanted transcriptions to beas narrow as in a textbook of the language inquestion, 31% narrow enough for a word to beidentified by a native speaker if pronounced inaccordance with the transcription. The remaining19% meant that narrowness should beallowed to vary from language to language.Those who were of this opinion had thefollowing motives for making a more narrowtranscription for a certain language: the languageis widely studied in Swedish schools(e.g., English, French, German, Spanish), 47%;the language is culturally and geographicallyclose to Sweden, e.g., Danish, Finnish), 29%;the pronunciation of the language is judged tobe easy for speakers of Swedish without knowledgeof the language in question, (e.g., Italian,Spanish, Greek), 24%. More than one optionhad often been marked.What pronunciation to present?One section dealt with the kinds of pronunciationto present. An important dimension isswedicized—foreign, another one standard—local. Like loanwords, many foreign geographicalnames, e.g., Hamburg, London, Paris,Barcelona, have obtained a standard, swedicizedpronunciation, whereas other ones, sometimes—butnot always—less well-known, e.g.,Bordeaux, Newcastle, Katowice, have not. Thepanel was asked how to treat the two types ofnames. A majority, 69% wanted a swedicizedpronunciation, if established, to be given, otherwisethe original pronunciation. However, theremaining 31% would even permit the editorsthemselves to invent a pronunciation consideredeasier for speakers of Swedish in‘difficult’ cases where no established swedificationsexist, like Łódź and Poznań. Threesubjects commented that they wanted both theoriginal and swedicized pronunciation to begiven for Paris, Hamburg, etc.In most of Sweden /r/ + dentals areamalgamated into retroflex sounds, [ ʂ], [ ʈ ], [ɖ]etc. In Finland, however, and in southernSweden, where /r/ is always realized as [ ʁ ] or[ ʀ ], the /r/ and the dentals are pronouncedseparately. One question put to the panel waswhether etc. should be transcribed asretroflex sounds—as in the recently publishedNorstedts svenska uttalsordbok (a Swedishpronunciation dictionary)—or as sequences of[r] and dentals—as in most encyclopedias. Thescores were 44% and 50% respectively, with anadditional 6% answering by an option of theirown: the local pronunciation of a geographicalname should decide. No one in the panel wasfrom Finland, but 71% of those members withSwedish as their first language were speakers ofdialects lacking retroflex sounds.Particularly for geographical names, twodifferent pronunciations often exist side byside: one used by the local population, andanother, a so-called reading pronunciation, usedby people from outside, and sometimes by theinhabitants when speaking to strangers. Thelatter could be described as the result ofsomebody—who has never heard the namepronounced—reading it and making a guess atits pronunciation. Often the reading pronunciationhas become some sort of nationalstandard. A Swedish example is the ancienttown of Vadstena, on site being pronounced[ˈvasˌsteːna], elsewhere mostly [ˈvɑːdˌsteːna].The reading pronunciation was preferred by62% of the subjects, the local one by 22%. Theremainder also opted for local pronunciation,provided it did not contain any phoneticfeatures alien to speakers of standard Swedish.216
<strong>Proceedings</strong>, FONETIK <strong>2009</strong>, Dept. of Linguistics, Stockholm UniversityFor English, Spanish and Portuguese,different standards exist in Europe, the Americasand other parts of the world. The panelwas asked whether words in these languagesshould be transcribed in one standard varietyfor each language (e.g., Received Pronunciation,Madrid Spanish and Lisbon Portuguese),one European and one American pronunciationfor each language, or if the local standardpronunciation (e.g., Australian English) shouldas far as possible be provided. The scoresobtained were 27%, 52% and 21% respectively.Obviously, the panel felt a need to distinguishbetween European and American pronunciations,which is done in Nationalencyklopedin. Itcould be objected that native speakers of thelanguages in question use their own variety,irrespective of topic. On the other hand, it maybe controversial to transcribe a living person’sname in a way alien to him-/herself. Forexample, the name Berger is pronounced[ˈbɜːdʒə] in Britain but [ˈbɜ˞ːgər] in the U.S.Audio pronunciationsThere were five questions about audio pronunciations,i.e. clickable recordings. The first onewas whether such recordings should be read bynative speakers in the standard variety of thelanguage in question (as done in the digitalversions of Nationalencyklopedin) or by oneand the same speaker with a swedicizedpronunciation. Two thirds chose the firstoption.The next question dealt with speaker sex.More than 87% wanted both male and femalespeakers, evenly distributed, while 4%preferred female and 8% male speakers. One ofthe subjects opting for male speakers commentedthat men, or women with voices in thelower frequency range, were preferable sincethey were easier to perceive for many personswith a hearing loss.Then subjects were asked if they would liketo use a digital encyclopedia where pronunciationwas presented by means of syntheticspeech recordings. 68% were clearly against,and of the remaining 32%, some expressedreservations like ‘Only if extremely natural’, ‘IfI have to’ and ‘I prefer natural speech’.In the following question, the panel wasasked how it would most frequently act whenseeking pronunciation information in a digitalencyclopedia with both easily accessible audiopronunciations and phonetic transcriptions. Noless than 71% declared that they would useboth possibilites—which seems to be a wisestrategy—, 19% would just listen, wheras theremaining 10% would stick to the transcriptions.This section concluded with a questionabout the preferred way to describe the speechsounds represented by the signs. Should it bemade by means of articulation descriptions like‘voiced bilabial fricative’ or example wordsfrom languages where the sound appears, as‘[β] Spanish saber, jabón’ or by clickablerecordings? Or by a combination of these? Thescores were approximately 18%, 52% and 31%respectively. Several subjects preferred combinations.In such cases, each subject’s score wasevenly distributed over the options marked.Familiarity with IPA alphabetIn order to provide an idea of how familiar thepanel members were with the IPA alphabet,they were finally presented with a chart of 36frequently used IPA signs and asked to markthose they felt sure of how to pronounce. Theaverage number of signs marked turned out tobe 17. Of the 54 panel members, 6 did not markany sign at all. The top scores were [æ]: 44, [ ʃ ]and [o]: both 41, [u]: 40, [ə]: 39, [a]: 37 and [ʒ]:35. Somewhat surprising, [ ʔ ] obtained no lessthan 17 marks.DiscussionApparently, Sweden and Germany are the twocountries where pronunciation in encyclopediasare best satisfied. Many important works in othercountries either do not supply pronunciationat all (Encyclopædia Britannica), or do so onlysparingly (Grand Larousse universel and DenStore Danske Encyklopædi), instead referringtheir users to specialized pronunciation dictionaries.This solution is unsatisfactory because(i) such works are not readily available (ii) theyare difficult for a layman to use (iii) you haveto consult several works with different notations(iv) you will be unable to find the pronunciationof many words, proper names in particular.An issue that pronunciation editors have toconsider, but that was not taken up in the surveyis how formal—casual the presented pronunciationshould be. It is a rather theoreticalproblem, complicated to explain to panel membersif they are not able to listen to any recordings.Normally, citation forms are given, but itcan be of importance to have set rules for how217
<strong>Proceedings</strong>, FONETIK <strong>2009</strong>, Dept. of Linguistics, Stockholm Universitycoarticulation and sandhi phenomena should betreated.Another tricky task for pronunciation editorsis to characterize the pronunciation of thephonetic signs. As one subject pointed out in acomment, descriptions like ‘voiced bilabialfricative’ do not tell you much unless you havebeen through an elementary course of phonetics.Neither do written example words servetheir purpose to users without knowledge of thelanguages in question. It is quite evident thataudio recordings of the written example words—in various languages for each sign, thus illustratingthe phonetic range of it—would reallyadd something.The panel favoured original language pronunciationboth in transcriptions (69% or more)and in audio recordings (67%). At least in Sweden,learners of foreign languages normally aimat a pronunciation as native-like as possible.However, this might not always be valid for encyclopediausers. When speaking your mothertongue, pronouncing single foreign words in atruly native-like way may appear snobbish oraffected. Newsreaders usually do not changetheir base of articulation when encountering aforeign name. A general solution is hard tofind. Since you do not know for what purposeusers are seeking pronunciation advice, adoptinga fixed level of swedicization would not besatisfactory. The Oxford BBC Guide topronunciation has solved this problem bysupplying two pronunciations: an anglicizedone, given as ‘respelled pronunciation’, andanother one, more close to the originallanguage, transcribed in IPA.Interim strategiesOne question was an attempt to explore the thestrategies most frequently used by the subjectswhen they had run into words they did notknow how to pronounce, in other words to findout what was going on in their minds beforethey began to seek pronunciation advice. Theoptions and their scores were as follows:(a) I guess at a pronunciation and then use itsilently to myself: 51%(b) I imagine the word pronounced in Swedishand then I use that pronunciation silentlyto myself: 16%(c) I can’t relax before I know how to pronouncethe word; therefore, I avoid allconjectures and immediately try to findout how the word is pronounced: 22%(d) I don’t imagine any pronunciation at all butmemorize the image of the written wordand link it to the concept it represents:11%.It can be doubted whether (d) is a plausible optionfor people using alphabetical script. Onesubject commented that it was not. Anyway, itseems that it would be more likely to be usedby those brought up in the tradition of iconographicscript. Researchers of the reading processmight be able to judge.The outcome is that the panel is ratherreluctant to use Swedish pronunciation—evententatively—for foreign words, like saying forexample [ˈʃɑːkəˌspeːarə] for Shakespeare or[ˈkɑːmɵs] for Camus, pronunciations that aresometimes heard from Swedish children.Rather, they prefer to make guesses like[ˈgriːnwɪtʃ] for Greenwich, as is frequently donein Sweden.ConclusionSweden has grand traditions in the field of presentingpronunciation in encyclopedias, but thisdoes not mean that they should be left unchanged.It is quite evident from the panel’s answersthat the principle of not giving pronunciationfor first names is totally outdated.The digital revolution provides new possibilities.Not only does it allow for showingmore than one pronunciation, e.g., one standardand one regional variety, since there is nowspace galore. Besides allowing audio recordingsof entry headings, it makes for better descriptionsof the sounds represented by the varioussigns, by completing written examplewords in various languages with sound recordingsof them.IPA transcriptions should be favoured whenproducing new encyclopedias. The Internet hascontributed to an increased use of the IPA, especiallyon the Wikipedia, but since the authorsof those transcriptions do not always have sufficientknowledge of phonetics, the correctnessof certain transcriptions ought to be questioned.The extent to which transcriptions should beused, and how detailed they should be must dependon the kind of reference book and of thegroup of users aimed at. Nevertheless, accountmust always be taken of the many erroneouspronunciations that exist and continue tospread, e.g., [ˈnætʃənəl] for the English wordnational, a result of Swedish influence.218
<strong>Proceedings</strong>, FONETIK <strong>2009</strong>, Dept. of Linguistics, Stockholm UniversityAcknowledgementsI wish to thank all members of the panel fortheir kind help. Altogether, they have spentmore than two working days on answering myquestions—without being paid for it.Notes1. In Bra Böckers Lexikon and Lexikon 2000,system (d)—dots under vowel signs—is usedfor denoting main stress also in transcriptionswithin brackets, where segments are renderedin IPA.2. Also available free of charge on the Internet.ReferencesBra Böckers Lexikon (1973—81 and lateredns.) Höganäs: Bra Böcker.Den Store Danske Encyklopædi (1994—2001)Copenhagen: Danmarks Nationalleksikon.Duden, Aussprachewörterbuch, 6th edn.,revised and updated (2005) Mannheim:Dudenverlag.Elert, C.-C. (1967) Uttalsbeteckningar isvenska ordlistor, uppslags- och läroböcker.In Språkvård 2. Stockholm: Svenskaspråknämnden.Garlén, C. (2003) Svenska språknämndens uttalsordbok.Stockholm: Svenska språknämnden.Norstedts ordbok.Lexikon 2000 (1997—9) Malmö: Bra Böcker.Nationalencyklopedin (1989—96) Höganäs:Bra Böcker.Nordisk familjebok, 2nd edn. (1904—26)Stockholm: Nordisk familjeboks <strong>för</strong>lag.Olausson, L. and Sangster, C. (2006) OxfordBBC Guide to pronunciation. Oxford:Oxford Univ. Press.Respons (1997—8) Malmö: Bertmarks.Rosenqvist, H. (2004) Markering av prosodi isvenska ordböcker och läromedel. In Ekberg,L. and Håkansson, G. (eds.) Nordand6. Sjätte konferensen om Nordens språksom andraspråk. Lund: Lunds universitet.<strong>Institutionen</strong> <strong>för</strong> nordiska språk.Svenska Akademiens ordbok (1898—) Lund:C.W.K. Gleerup. 2Svenska Akademiens ordlista, 13th edn. (2006)Stockholm: Norstedts akademiska <strong>för</strong>lag(distributor). 2Svensk uppslagsbok, 2nd edn. (1947—55)Malmö: Förlagshuset Norden.219
<strong>Proceedings</strong>, FONETIK <strong>2009</strong>, Dept. of Linguistics, Stockholm UniversityLVA-technology – The illusion of “lie detection” 1Francisco LacerdaDepartment of Linguistics, Stockholm UniversityAbstractThe new speech-based lie-detection LVAtechnologyis being used in some countries toscreen applicants, passengers or customers inareas like security, medicine, technology andrisk management (anti-fraud). However, a scientificevaluation of this technology and of theprinciples on which it relies indicates, not surprisingly,that it is neither valid nor reliable.This article presents a scientific analysis of thisLVA-technology and demonstrates that it simplycannot work.IntroductionAfter of the attacks of September 11, 2001, thedemand for security technology was considerably(and understandably) boosted. Among thesecurity solutions emerging in this context,Nemesysco Company’s applications claim to becapable of determining a speaker’s mental statefrom the analysis of samples of his or her voice.In popular terms Nemesysco’s devices can begenerally described as “lie-detectors”, presumablycapable of detecting lies using shortsamples of an individual’s recorded or on-linecaptured speech. However Nemesysco claimstheir products can do much more than this.Their products are supposed to provide a wholerange of descriptors of the speaker’s emotionalstatus, such as exaggeration, excitement and“outsmarting” using a new “method for detectingemotional status of an individual”, throughthe analysis of samples of her speech. The keycomponent is Nemesysco’s patented LVAtechnology(Liberman, 2003). The technologyis presented as unique and applicable in areassuch as security, medicine, technology and riskmanagement (anti-fraud). Given the consequencesthat applications in these areas mayhave for the lives of screened individuals, a scientificassessment of this LVA-technologyshould be in the public’s and authorities’ interest.Nemesysco’s claimsAccording to Nemesysco’s web site, “LVAidentifies various types of stress, cognitiveprocesses and emotional reactions which togethercomprise the “emotional signature” of anindividual at a given moment, based solely onthe properties of his or her voice” i . Indeed,“LVA is Nemesysco's core technology adaptedto meet the needs of various security-relatedactivities, such as formal police investigations,security clearances, secured area access control,intelligence source questioning, and hostagenegotiation” ii and “(LVA) uses a patented andunique technology to detect ‘brain activitytraces’ using the voice as a medium. By utilizinga wide range spectrum analysis to detectminute involuntary changes in the speech waveformitself, LVA can detect anomalies in brainactivity and classify them in terms of stress, excitement,deception, and varying emotionalstates, accordingly”. Since the principles andthe code used in the technology are described inthe publicly available US 6,638,217 B1 patent,a detailed study of the method was possible andits main conclusions are reported here.Deriving the “emotional signature”from a speech signalWhile assessing a person’s mental state usingthe linguistic information provided by thespeaker (essentially by listening and interpretingthe person’s own description of her or hisstate of mind) might, in principle, be possible ifbased on an advanced speech recognition system,Nemesysco’s claim that the LVAtechnologycan derive "mental state" informationfrom “minute involuntary changes in thespeech waveform itself” is at least astonishingfrom both a phonetic and a general scientificperspective. How the technology accomplishesthis is however rather unclear. No useful infor-1 This text is a modified version of Lacerda (<strong>2009</strong>), “LVA-technology – A short analysis of a lie”, available online athttp://blogs.su.se/frasse/, and is intended for a general educated but not specialized audience.220
<strong>Proceedings</strong>, FONETIK <strong>2009</strong>, Dept. of Linguistics, Stockholm Universitymation is provided on the magnitude of these“minute involuntary changes” but the wordingconveys the impression that these are very subtlechanges in the amplitude and time structureof the speech signal. A reasonable assumptionis to expect the order of magnitude of such "involuntarychanges" to be at least one or two ordersof magnitude below typical values forspeech signals, inevitably leading to the firstissue along the series of ungrounded claimsmade by Nemesysco. If the company's referenceto "minute changes" is to be taken seriously,then such changes are at least 20 dB below thespeech signal's level and therefore masked bytypical background noise. For a speech waveformcaptured by a standard microphone in acommon reverberant room, the magnitude ofthese "minute changes" would be comparable tothat of the disturbances caused by reflections ofthe acoustic energy from the walls, ceiling andfloor of the room. In theory, it could be possibleto separate the amplitude fluctuations caused byroom acoustics from fluctuations associatedwith the presumed “involuntary changes” butthe success of such separation procedure iscritically dependent on the precision with whichthe acoustic signal is represented and on theprecision and adequacy of the models used torepresent the room acoustics and the speaker'sacoustic output. This is a very complex problemthat requires multiple sources of acoustic informationto be solved. Also the reliability ofthe solutions to the problem is limited by factorslike the precision with which the speaker'sdirect wave-front (originating from thespeaker’s mouth, nostrils, cheeks, throat, breastand other radiating surfaces) and the roomacoustics can be described. Yet another issueraised by such “sound signatures” is that theyare not even physically possible given themasses and the forces involved in speech production.The inertia of the vocal tract walls, velum,vocal folds and the very characteristics ofthe phonation process lead to the inevitableconclusion that Nemesysco’s claims of pickingup that type of "sound signatures" from thespeaker’s speech waveform are simply not realistic.It is also possible that these “minutechanges” are thought as spreading over severalperiods of vocal-fold vibration. In this case theywould be observable but typically not “involuntary”.Assuming for a moment that the signalpicked up by Nemesysco’s system would not becontaminated with room acoustics and backgroundnoise, the particular temporal profile ofthe waveform is essentially created by the vocaltract’s response to the pulses generated by thevocal folds’ vibration. However these pulsesare neither “minute” nor “involuntary”. Thechanges observed in the details of the waveformscan simply be the result of the superpositionof pulses that interfere at different delays.In general, the company’s descriptions of themethods and principles are circular, inconclusiveand often incorrect. This conveys the impressionof superficial knowledge of acousticphonetics, obviously undermining the credibilityof Nemesysco’s claims that the LVAtechnologyperforms a sophisticated analysis ofthe speech signal. As to the claim that the productsmarketed by Nemesysco would actually beable to detect the speaker’s emotional status,there is no known independent evidence to supportit. Given the current state of knowledge,unless the company is capable of presentingscientifically sound arguments or at least producingindependently and replicable empiricaldata showing that there is a significant differencebetween their systems’ hit and false-alarmrates, Nemesysco’s claims are unsupported.How LVA-technology worksThis section examines the core principles ofNemesysco’s LVA-technology, as available inthe Visual Basic Code in the method’s patent.Digitizing the speech signalFor a method claiming to use information fromminute details in the speech wave, it is surprisingthat the sampling frequency and the samplesizes are as low as 11.025 kHz and 8 bit persample. By itself, this sampling frequency isacceptable for many analysis purposes but,without knowing which information the LVAtechnologyis supposed to extract from the signal,it is not possible to determine whether11.025 kHz is appropriate or not. In contrast,the 8 bit samples inevitably introduce clearlyaudible quantification errors that preclude theanalysis of “minute details”. With 8 bit samplesonly 256 levels are available to encode thesampled signal’s amplitude, rather than 65536quantization levels associated with a 16 bitsample. In acoustic terms this reduction in samplelength is associated with a 48 dB increase of221
<strong>Proceedings</strong>, FONETIK <strong>2009</strong>, Dept. of Linguistics, Stockholm Universitythe background noise relative to what wouldhave been possible using a 16-bit/sample representation.It is puzzling that such crude signalrepresentations are used by a technology claimingto work on “details”. But the degradation ofthe amplitude resolution becomes even worseas a “filter” that introduces a coarser quantizationusing 3 units’ steps reduces the 256 levelsof the 8-bit representation to only 85 quantizationlevels (ranging from -42 to +42). This verylow sample resolution (something around 6.4-bit/sample), resulting in a terrible sound quality,is indeed the basis for all the subsequent signalprocessing carried out by the LVA-technology.The promise of an analysis of “minute” detailsin the speech waveform cannot be taken seriously.Figure 1 displays a visual analogue of thesignal degradation introduced by the LVAtechnology.Figure 1. Visual analogs of LVA-technology’sspeech signal input. The 256×256 pixels image,corresponding to 16 bit samples, is sampleddown to 16×16 pixels (8 bit samples) and finallydown-sampled to approximately 9×9 pixelsrepresenting the ±42 levels of amplitude encodingused by the LVA-technology.The core analysis procedureIn the next step, the LVA-technology scans thatcrude speech signal representation for “thorns”and “plateaus” using triplets of consecutivesamples."Thorns"According to Nemesysco’s definition, thornsare counted every time the middle sample ishigher than the maximum of the first and thirdsamples, provided all three samples are abovean arbitrary threshold of +15. Similarly, a thornis also detected when the middle sample valueis lower than the minimum of both the first andthe third samples in the triplet and all threesamples are below -15. In short, thorns are localmaxima, if the triplet is above +15 and localminima if the triplet is below -15. Incidentallythis is not compatible with the illustration providedin fig. 2 of the patent, where any localmaxima or minima are counted as thorns, providedthe three samples fall outside the(-15;+15) threshold interval."Plateaus"Potential plateaus are detected when the samplesin a triplet have a maximum absolute amplitudedeviation that is less than 5 units. The±15 threshold is not used in this case but tocount as a plateau the number of samples in thesequence must be between 5 and 22. The numberof occurrences of plateaus and their lengthsare the information stored for further processing.A blind technologyAlthough Nemesysco presents a rationale forthe choice of these “thorns” and “plateaus” thatsimply does not make sense from a signal processingperspective, there are several interestingproperties associated with these peculiar variables.The crucial temporal information is completelylost during this analysis. Thorns and plateausare simply counted within arbitrarychunks of the poorly represented speech signalwhich means that a vast class of waveformscreated by shuffling the positions of the thornsand plateaus are indistinguishable from eachother in terms of totals of thorns and plateaus.Many of these waveforms may even not soundlike speech at all. This inability to distinguishbetween different waveforms is a direct consequenceof the information loss accomplished bythe signal degradation and the loss of temporalinformation. In addition to this, the absolutevalues of the amplitudes of the thorns can bearbitrarily increased up to the ±42 maximumlevel, creating yet another variant of physicallydifferent waveforms that are interpreted asidentical from the LVA-technology’s perspective.222
<strong>Proceedings</strong>, FONETIK <strong>2009</strong>, Dept. of Linguistics, Stockholm UniversityThe measurement of the plateaus appears toprovide only very crude information and is affectedby some flaws. Indeed, the program codeallows for triplets to be counted as both thornsand plateaus. Whether this is intentional or justa programming error is impossible to determinebecause there is no theoretical model behind theLVA-technology against which this could bechecked. In addition, what is counted as a plateaudoes not even have to look like a plateau.An increasing or decreasing sequence of sampleswhere differences between adjacent samplesare less than ±5 units will count as a plateau.Only the length and the duration of theseplateaus are used and because the ±5 criterion isactually a limitation on the derivate of the amplitudefunction, large amplitude drifts can occurin sequences that are still viewed by LVAtechnologyas if they were flat. Incidentally,given that these plateaus can be up to 22 sampleslong, the total span of the amplitude driftwithin a plateau can be as large as 88 units,which would allow for a ramp to sweep throughthe whole range of possible amplitudes (-42 to+42). This is hardly compatible with the notionof high precision technology suggested byNemesysco. Finally, in addition to the countingof plateaus, the program also computes thesquare root of the cumulative absolute deviationfor the distribution of the plateau lengths.Maybe the intention was to compute the standarddeviation of the sample distribution andthis is yet another programming error but sincethere is no theoretical rationale it is impossibleto discuss this issue.Assessing the speaker’s emotionalstateThe rest of the LVA-technology simply uses theinformation provided by these four variables:(1) the number of thorns per sample, (2) thenumber of counts of plateaus per sample, (3)the average length of the plateaus and (4) thesquare root of their cumulative absolute deviation.From this point on the program code is nolonger related to any measureable physicalevents. In the absence of a theoretical model,the discussion of this final stage and its outcomeis obviously meaningless. It is enough topoint out that the values of the variables used toissue the final statements concerning thespeaker’s emotional status are as arbitrary asany other and of course contain no more informationthan what already was present in thefour variables above.Examples of waveforms that becomeassociated with “LIES” 2Figure 2 shows several examples of a syntheticvowel that was created by superimposing withthe appropriate delays to generate different fundamentalfrequencies, a glottal pulse extractedfrom a natural production.After calibration with glottal pulses simulatinga vowel with a 120 Hz fundamental frequency,the same glottal pulses are interpretedas indicating a “LIE” if the fundamental frequencyis lowered to 70 Hz whereas a raise infundamental frequency from 120 Hz to 220 Hzis detected as “outsmart”. Also a fundamentalfrequency as low as 20 Hz is interpreted as signallinga “LIE”, relative to the 120 Hz calibration.Using the 20 Hz waveform as calibrationand testing with the 120 Hz is detected as “outsmart”.A calibration with the 120 Hz waveabove followed by the same wave contaminatedby some room acoustics is also interpreted as“outsmart”.The illusion of a serious analysisThe examples above suggest that the LVAtechnologygenerates outputs contingent on therelationship between the calibration and the testsignals. Although the signal analysis performedby the LVA-technology is a naive and ad hocmeasurement of essentially irrelevant aspects ofthe speech signal, the fact that some of the "detectedemotions" are strongly dependent on thestatistical properties of the "plateaus" leads tooutcomes that vaguely reflect variations in F0.For instance, the algorithm's output tends to bea “lie” when the F0 of the test signal is generallylower than that of the calibration. The mainreason for this is that the program issues “lie”-warnings when the number of detected “plateaus”during the analysis phase exceeds by acertain threshold the number of “plateaus”measured during calibration. When the F0 is2 The amplitudes of the waveforms used in this demonstrationare encoded at 16 bit per sample.223
<strong>Proceedings</strong>, FONETIK <strong>2009</strong>, Dept. of Linguistics, Stockholm Universitylow amplitude oscillations are lost and the sequencesare interpreted as plateaus that arelonger (and therefore fewer within the analysiswindow) than those measured in speech segmentsproduced with higher F0. Such momentarychanges in the structure of the plateaus areinterpreted by the program's arbitrary code asindicating "deception". Under typical circumstances,flagging "lie" in association with loweringof F0 will give the illusion that the programis doing something sensible because F0tends to be lower when a speaker produces fillersduring hesitations than when the speaker'sspeech flows normally. Since the "lie-detector"is probably calibrated with responses to questionsabout obvious things the speaker will tendto answer using a typical F0 range that willgenerally be higher than when the speaker hasto answer to questions under split-attentionloads. Of course, when asked about events thatdemand recalling information, the speaker willtend to produce fillers or speak at a lowerspeech rate, thereby increasing the probabilityof being flagged by the system as attempting to"lie", although in fact hesitations or lowering ofF0 are known to be no reliable signs of deception.Intentionally or by accident, the illusion ofseriousness is further enhanced by the randomcharacter of the LVA outputs. This is a directconsequence of the technology's responses toboth the speech signal and all sorts of spuriousacoustic and digitalization accidents. The instabilityis likely to confuse both the speaker andthe "certified examiner", conveying the impressionthat the system really is detecting somebrain activity that the speaker cannot control 3and may not even be aware of! It may even givethe illusion of robustness as the performance isequally bad in all environments.Figure 2. The figures above show synthetic vowelsconstructed by algebraic addition of delayedversions of a natural glottal pulse. Thesewaveforms lead generate different “emotionaloutputs” depending on the relationship betweenthe F0 of the waveform being tested and the F0of the “calibration” waveform.low, the final portions of the vocal tract'sdamped responses to more sparse glottal pulseswill tend to achieve lower amplitudes in betweenconsecutive pulses. Given the technology'svery crude amplitude quantization, theseThe UK's DWP's evaluation of LVAThe UK's Department of Work and Pensionshas recently published statistics on the resultsof a large and systematic evaluation of theLVA-technology iii assessing 2785 subjects andcosting £2.4 million iv . The results indicate thatthe areas under the ROC curves for seven districtsvary from 0.51 to 0.73. The best of these3 Ironically this is true because the output is determinedby random factors associated with room acoustics, backgroundnoise, digitalization problems, distortion, etc.224
<strong>Proceedings</strong>, FONETIK <strong>2009</strong>, Dept. of Linguistics, Stockholm Universityresults corresponds to a d' of about 0.9, which isa rather poor performance. But the numbers reportedin the table reflect probably the judgementsof the "Nemesysco-certified" personal 4in which case the meaningless results generatedby the LVA-technology may have been overriddenby personal's uncontrolled "interpretations"of the direct outcomes after listening torecordings of the interviews.Tabell 1. Evaluation results published by the UK'sDWP.NLow risk caseswith no change inbenefitHigh risk caseswith no change inbenefitLow risk caseswith change inbenefitHigh risk caseswith change inbenefitTrue NegativeFalse PositiveFalse NegativeTrue PositiveAUC of ROCCurveJobcentre Plus 787 354 182 145 106 0.54Birmingham 145 60 49 3 33 0.73Derwentside 316 271 22 11 12 0.72Edinburgh 82 60 8 8 6 0.66Harrow 268 193 15 53 7 0.52Lambeth 1101 811 108 153 29 0.52Wealden 86 70 7 8 1 0.51Overall 2785 1819 391 381 194 0.65ConclusionsThe essential problem of this LVA-technologyis that it does not extract relevant informationfrom the speech signal. It lacks validity.Strictly, the only procedure that might makesense is the calibration phase, where variablesare initialized with values derived from the fourvariables above. This is formally correct butrather meaningless because the waveformmeasurements lack validity and their reliabilityis low because of the huge information loss inthe representation of the speech signal used bythe LVA-technology. The association of ad hocwaveform measurements with the speaker’semotional state is extremely naive and ungroundedwishful thinking that makes thewhole calibration procedure simply void.4 An inquiry on the methodological details of the evaluationwas sent to the DWP on the 23 April <strong>2009</strong> but themethodological information has not yet been provided.In terms of “lie-detection”, the algorithm reliesstrongly on the variables associated withthe plateaus. Given the phonetic structure of thespeech signals, this predicts that, in principle,lowering the fundamental frequency and changingthe phonation mode towards a more creakyvoice type will tend to count as an indication oflie, in relation to a calibration made under modalphonation. Of course this does not haveanything to do with lying. It is just the consequencea common phonetic change in speakingstyle, in association with the arbitrary constructionof the “lie”-variable that happens to givemore weight to plateaus, which in turn are associatedwith the lower waveform amplitudestowards the end of the glottal periods in particularwhen the fundamental frequency is low.The overall conclusion from this study isthat from the perspectives of acoustic phoneticsand speech signal processing, the LVAtechnologystands out as a crude and absurdprocessing technique. Not only it lacks a theoreticalmodel linking its measurements of thewaveform with the speaker’s emotional statusbut the measurements themselves are so imprecisethat they cannot possibly convey useful information.And it will not make any differenceif Nemesysco “updates” in its LVA-technology.The problem is in the concept’s lack of validity.Without validity, “success stories” of “percentdetection rates” are simply void. Indeed, these“hit-rates” will not even be statistically significantdifferent from associated “false-alarms”,given the method’s lack of validity. Until proofof the contrary, the LVA-technology should besimply regarded as a hoax and should not beused for any serious purposes (Eriksson &Lacerda, 2007).ReferencesEriksson, A. and Lacerda, F. (2007). Charlatanryin forensic speech science: A problemto be taken seriously. Int Journal of Speech,Language and the Law, 14, 169-193.Liberman, A. (10-28-2003). Layered VoiceAnalysis (LVA). [6,638,217 B1]. US patent.i http://www.nemesysco.com/technology.htmlii http://www.nemesysco.com/technology-lvavoiceanalysis.htmliii http://spreadsheets.google.com/ccc?key=phNtm3LmDZEME67-nBnsRMwiv http://www.guardian.co.uk/news/datablog/<strong>2009</strong>/mar/19/dwp-voicerisk-analysis-statistics225
<strong>Proceedings</strong>, FONETIK <strong>2009</strong>, Dept. of Linguistics, Stockholm UniversityAuthor indexAl Moubayed 140Allwood 180Ambrazaitis 72Ananthakrishnan 202Asu 54Beskow 28, 140, 190Blomberg 144, 154Bruce 42, 48Bulukin Wilén 150Carlson 86Cunningham 108Edlund 102, 190Eklöf 150Eklund 92Elenius, D. 144, 154Elenius, K. 190Enflo 24Engwall 30Forsén 130Granström 48, 140Gustafson, J. 28Gustafson, K. 86Gustafsson 150Hartelius 18Hellmer 190Herzke 140Hincks 102Horne 66House 78, 82, 190Inoue 112Johansson 130Karlsson 78, 82Keränen 116Klintfors 40, 126Krull 18Kügler 54Lacerda 126, 130, 160, 220Lång 130Lindblom 8, 18Lindh 186, 194Mårback 92Marklund 160McAllister 120Narel 130Neiberg 202Öhrström 150Ormel 140Öster 96, 140Pabst 24Riad 12Ringen 60Roll 66Salvi 140Sarwar 180Schalling 18Schötz 42, 48, 54Schwarz 92, 130Seppänen 116Simpson 172Sjöberg 92Sjölander 36Söderlund 160Stenberg 214Strömbergsson 136, 190, 198Sundberg, J. 24Sundberg, U. 40, 126Suomi 60Svantesson 78, 82Tånnander 36Tayanin 78, 82Toivanen, A. 176Toivanen, J. 116, 176Touati 208Traunmüller 166Tronnier 120Valdés 130van Son 140Väyrynen 116Wik 30Zetterholm 180226
Department of LinguisticsPhonetics group