Next Article in Journal
Anti-Reflective Zeolite Coating for Implantable Bioelectronic Devices
Next Article in Special Issue
Transcriptome-Wide Analysis Revealed the Potential of the High-Affinity Potassium Transporter (HKT) Gene Family in Rice Salinity Tolerance via Ion Homeostasis
Previous Article in Journal
Subject-Based Model for Reconstructing Arterial Blood Pressure from Photoplethysmogram
Previous Article in Special Issue
The Homeodomain-Leucine Zipper Genes Family Regulates the Jinggangmycin Mediated Immune Response of Oryza sativa to Nilaparvata lugens, and Laodelphax striatellus
 
 
Correction published on 10 April 2024, see Bioengineering 2024, 11(4), 361.
Article

Molecular and Morphological Characterization of Exserohilum turcicum (Passerini) Leonard and Suggs Causing Northern Corn Leaf Blight of Maize in Bihar

1
Department of Plant Pathology, Bihar Agricultural University, Sabour 813210, Bhagalpur, India
2
Department of Molecular Biology and Genetic Engineering, Bihar Agricultural University, Sabour 813210, Bhagalpur, India
3
Department of Plant Breeding and Genetics, Bihar Agricultural University, Sabour 813210, Bhagalpur, India
*
Authors to whom correspondence should be addressed.
Bioengineering 2022, 9(8), 403; https://doi.org/10.3390/bioengineering9080403
Submission received: 1 August 2022 / Revised: 12 August 2022 / Accepted: 16 August 2022 / Published: 19 August 2022 / Corrected: 10 April 2024

Abstract

:
Maize is considered the third most important cereal crop in Asia after rice and wheat. Many diseases affect this crop due to the cultivation of various hybrids. This research aimed to characterize the causative agent of northern corn leaf blight disease in Bihar, India, caused by Exserohilum turcicum (Passerini) Leonard and Suggs. Leaf samples were collected from infected fields in five maize growing districts of Bihar in 2020–2022. A total of 45 fungal isolates from 135 samples were examined for cultural, morphological, and molecular characteristics and were identified as E. turcicum. The isolates were grouped into four groups based on colony color, i.e., olivaceous brown, blackish brown, whitish black, and grayish, and into two groups based on regular and irregular margins. The conidial shapes were observed to be elongated and spindle-shaped with protruding hilum, with conidial septa ranging from 2–12. Similarly, conidial length varied from 52.94 μm to 144.12 μm. β-tubulin gene sequences analysis made it possible to verify the identities of fungal strains and the phylogenetic relationships of all isolates, which were clustered in the same clade. The β-tubulin gene sequences of all the isolates showed a high level of similarity (100%) with reference isolates from GenBank accession numbers KU670342.1, KU670344.1, KU670343.1, KU670341.1, and KU670340.1. The findings of this study will serve as a baseline for future studies and will help to minimize yield losses.

Graphical Abstract

1. Introduction

Maize is the third most significant cereal crop in India after rice and wheat. Numerous bacterial, viral, and fungal diseases can damage this crop. One of the significant foliar diseases is northern corn leaf blight (NCLB), which is caused by the fungus teleomorph—Setosphaeria turcica (Luttrell) and anamorph—Exserohilum turcicum (Passerini) Leonard and Suggs. The disease was initially described in Italy by Passerini in 1876 [1] and in 1907 by Butler in India [2]. Andhra Pradesh, Karnataka, Bihar, Himachal Pradesh, and Maharashtra are the states in India most affected by this disease. Early disease epidemics cause blighted leaves to die prematurely and lose their nutritional value, even as fodder. The majority of the composite and hybrid plants that are produced on a commercial scale are reported to be somewhat vulnerable to NCLB. In cooler maize-growing locations, NCLB is an endemic disease that is regarded to be crucial in terms of its geographic prevalence and ability to reduce production. When the leaves over the ear are impacted even very slightly during the post-flowering period, losses from NCLB are more severe. The most severe disease impacts are produced by a warm, humid climate; late planting; and maize grown from previous seasons [3]. NCLB is among the most devastating foliar diseases, causing serious diminishment in grain yield of around 16–98% [4]. In mid-elevation tropical zones with low temperatures, cloudy weather, and excessive humidity during the maize growing season, NCLB can be a major problem [5]. If the symptoms appear prior to flowering, yield losses may exceed 50% [6,7]. The infection manifests as boat-shaped blighting and long gray, green, or brown elliptical streaks. The primary determinant of host-plant resistance and the development of effective disease management strategies are the genetic variability and pathogenicity of the pathogen. This pathogen’s virulence has been reported to vary in maize [8] and, more recently, in sorghum [9]. In sorghum, three RAPD markers that are tightly linked to a locus for resistance to NCLB have been discovered [10]. Little is known about the variations in isolates of E. turcicum at the molecular level [11]. However, according to Mathur [12], there are no such reports on the existence of various E. turcicum races in sorghum. In order to standardize molecular markers helpful for such research and ascertain the degree of genetic variability in this disease, an assessment was required. In studying the ecology and biology of fungi, RAPD and SSR markers are useful for determining genetic similarity and identifying variation within and among populations of E. turcicum [11,13] and other fungal species [14,15]. Numerous researchers have tried to identify the specific pathogen that causes NCLB disease. However, in this study, cultural and morphological variability of E. turcicum among different isolates causing NCLB disease in maize was identified and isolates’ molecular characterization was done in order to better and more easily identify this pathogen via morphological and molecular diversity, as well as to emphasize the development of disease-resistant cultivars.

2. Materials and Methods

2.1. Sample Collection and Isolation of Pathogens under Standard Cultivation Conditions

In the present study, E. turcicum isolates were collected in 2020–2022 from five districts of Bihar; three blocks from each district and nine villages from each block were chosen for sample collection. The details of the districts surveyed and the areas from which diseased isolates were collected for variability studies are given in Table 1. Field samples were labeled, kept in cold boxes, and brought to the laboratory for further study [16].

2.2. Isolation and Identification of Exserohilum Turcicum

The isolation of fungus from diseased samples was carried out using the method described by Manamgoda [17]. Small portions of infected leaf tissue with some adjacent healthy tissues of around 0.5 cm × 0.5 cm in diameter were cut. The leaf portions were surface sterilized with 1% sodium hypochlorite (NaOCl) for 30 s. The desired portions were removed with sterilized forceps and transferred into distilled water for 1–2 min. The portions were blotted on sterilized filter paper in order to absorb moisture, and finally the portions were placed on a suitable nutrient potato dextrose agar (PDA) medium and the plates were completely sealed with Para film®, followed by incubation at 26 ± 2 °C. Colonies were observed at 2–3 day intervals until full growth was attained. Small portions of fungal mycelium from fully grown culture were aseptically transferred to plates of fresh PDA culture medium in order to obtain pure cultures of E. turcicum [16,18].

2.3. Cultural and Morphological Characterization

Growing cultures of 7–10 days were used for this study. The growing cultures in Petri plates were aseptically opened under laminar air flow, clean microscope glass slides were gently placed over the surface of the colonies, touching the edge, and the plates were resealed, followed by incubation under continuous light to produce spores. A total of 45 fungal isolates were studied for morphological and cultural characteristics after the culture growth reached 10 days [18,19]. The color and texture of the colonies as well as growth pattern, pigmentation, and margin growth were observed [19]. In the conidial study, number of septa, conidial length, color, and width of 30 spores per isolate were measured using a fluorescent microscope (Evos, Thermo Fisher Scientific, Waltham, MA, USA) and analyzed using Image J software [20].

2.4. Molecular Characterization

2.4.1. DNA Isolation

Conical flasks with 2% potato dextrose broth were used to culture E. turcicum isolates for 10 days at 26 ± 2 °C. A few changes to the modified CTAB procedure [21,22] were made in order to extract DNA from the growing mycelial mats. Using liquid nitrogen, the collected fungus mats were ground into a fine powder. The extracts were transferred to sterile polypropylene tubes with 15 mL of 2× CTAB extraction buffer, which contains 2–3 percent W/V CTAB, 1.4 M NaCl, 20 mM EDTA, 100 mM Tris-HCl, pH-8, and 0.17% beta-mercaptoethanol, preheated to 65 °C. The DNA was purified using equal volumes of ethanol and chloroform-isoamyl alcohol. Centrifugation was then done at 10,000 rpm for 5 min and the supernatant was transferred to a new tube. Genomic DNA was precipitated by adding ice-chilled iso-propenol (0.6 mL), mixed by inversion, and incubated in ice for 30 min. The samples were then centrifuged at 10,000 rpm for 10 min at 4 °C. Supernatant was discarded and DNA was washed with 70% ethanol. The pellets were air dried and re-suspended in 100 µL of TE buffer [21,23].

2.4.2. PCR Amplification

The modified CTAB protocol was followed in order to extract the DNA, and then PCR was used to amplify the DNA using the universal primers TUBUF2 forward (5′-CGGTAACAACTGGGCCAAGG-3′) and TUBUR1 reverse (5′-CCTGGTACTGCT GGTACTCAG-3′) [24]. A thermal cycler was used to carry out the PCR amplification. The overall volume for the PCR reaction was 30 μL, which included 2 μL of DNA template, 1.5 μL of forward and reverse primer [24], 10 μL of nuclease-free water, and 15 μL of PCR master mix (Taq polymerase). The thermo cycler (Gradient thermal cycler Master cycler® nexus) consisted of an initial denaturation step at 95 °C for 4 min, 30 cycles of denaturation at 95 °C for 30 s, annealing at 56.6 °C for 30 s, extension at 72 °C for 1 min, and final extension at 72 °C for 5 min. Gel electrophoresis and staining were carried out by adding 10 μL of PCR product and 1% of agarose gel to a TAE buffer solution (40 mM Tris, 20 mM acetic acid, and 1 mM EDTA) and running the mixture at 80 V for 50 min at 25 °C. The gel was stained with Fluorosafe stain and the PCR products were observed under a UV light and documented using a gel documentation system (Invitrogen, Thermo Fisher, Scientific, Waltham, MA, USA). A molecular marker (DNA ladder mix, 1 kb, Genbiotech, SRL) was used to determine the size of amplified DNA bands. The PCR products were finally sent for sequencing, which was done by Sanger sequencing method (Illumina, San Digo, CA, USA) [25]. Multiple sequence alignments were generated using Clustal Omega (http://www.ebi.ac.uk/Tools/msa/clustalo/) accessed on 11 August 2022 [26] and were also manually corrected for domain superimpositions. MEGA11 software was used to align the β-tubulin sequences, and BLASTN search was used to compare them to sequences in the GenBank database (http://www.ncbi.nlm.nih.gov) accessed on 11 August 2022 [27]. All of the isolate accession numbers were taken from GenBank. MEGA11 software was used to create a phylogenetic tree [28].

3. Results

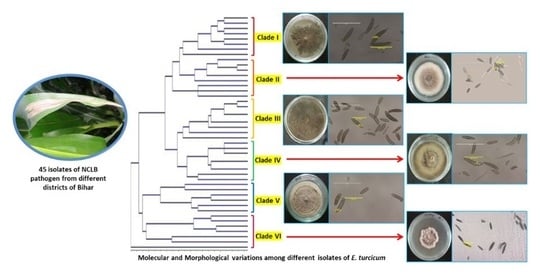
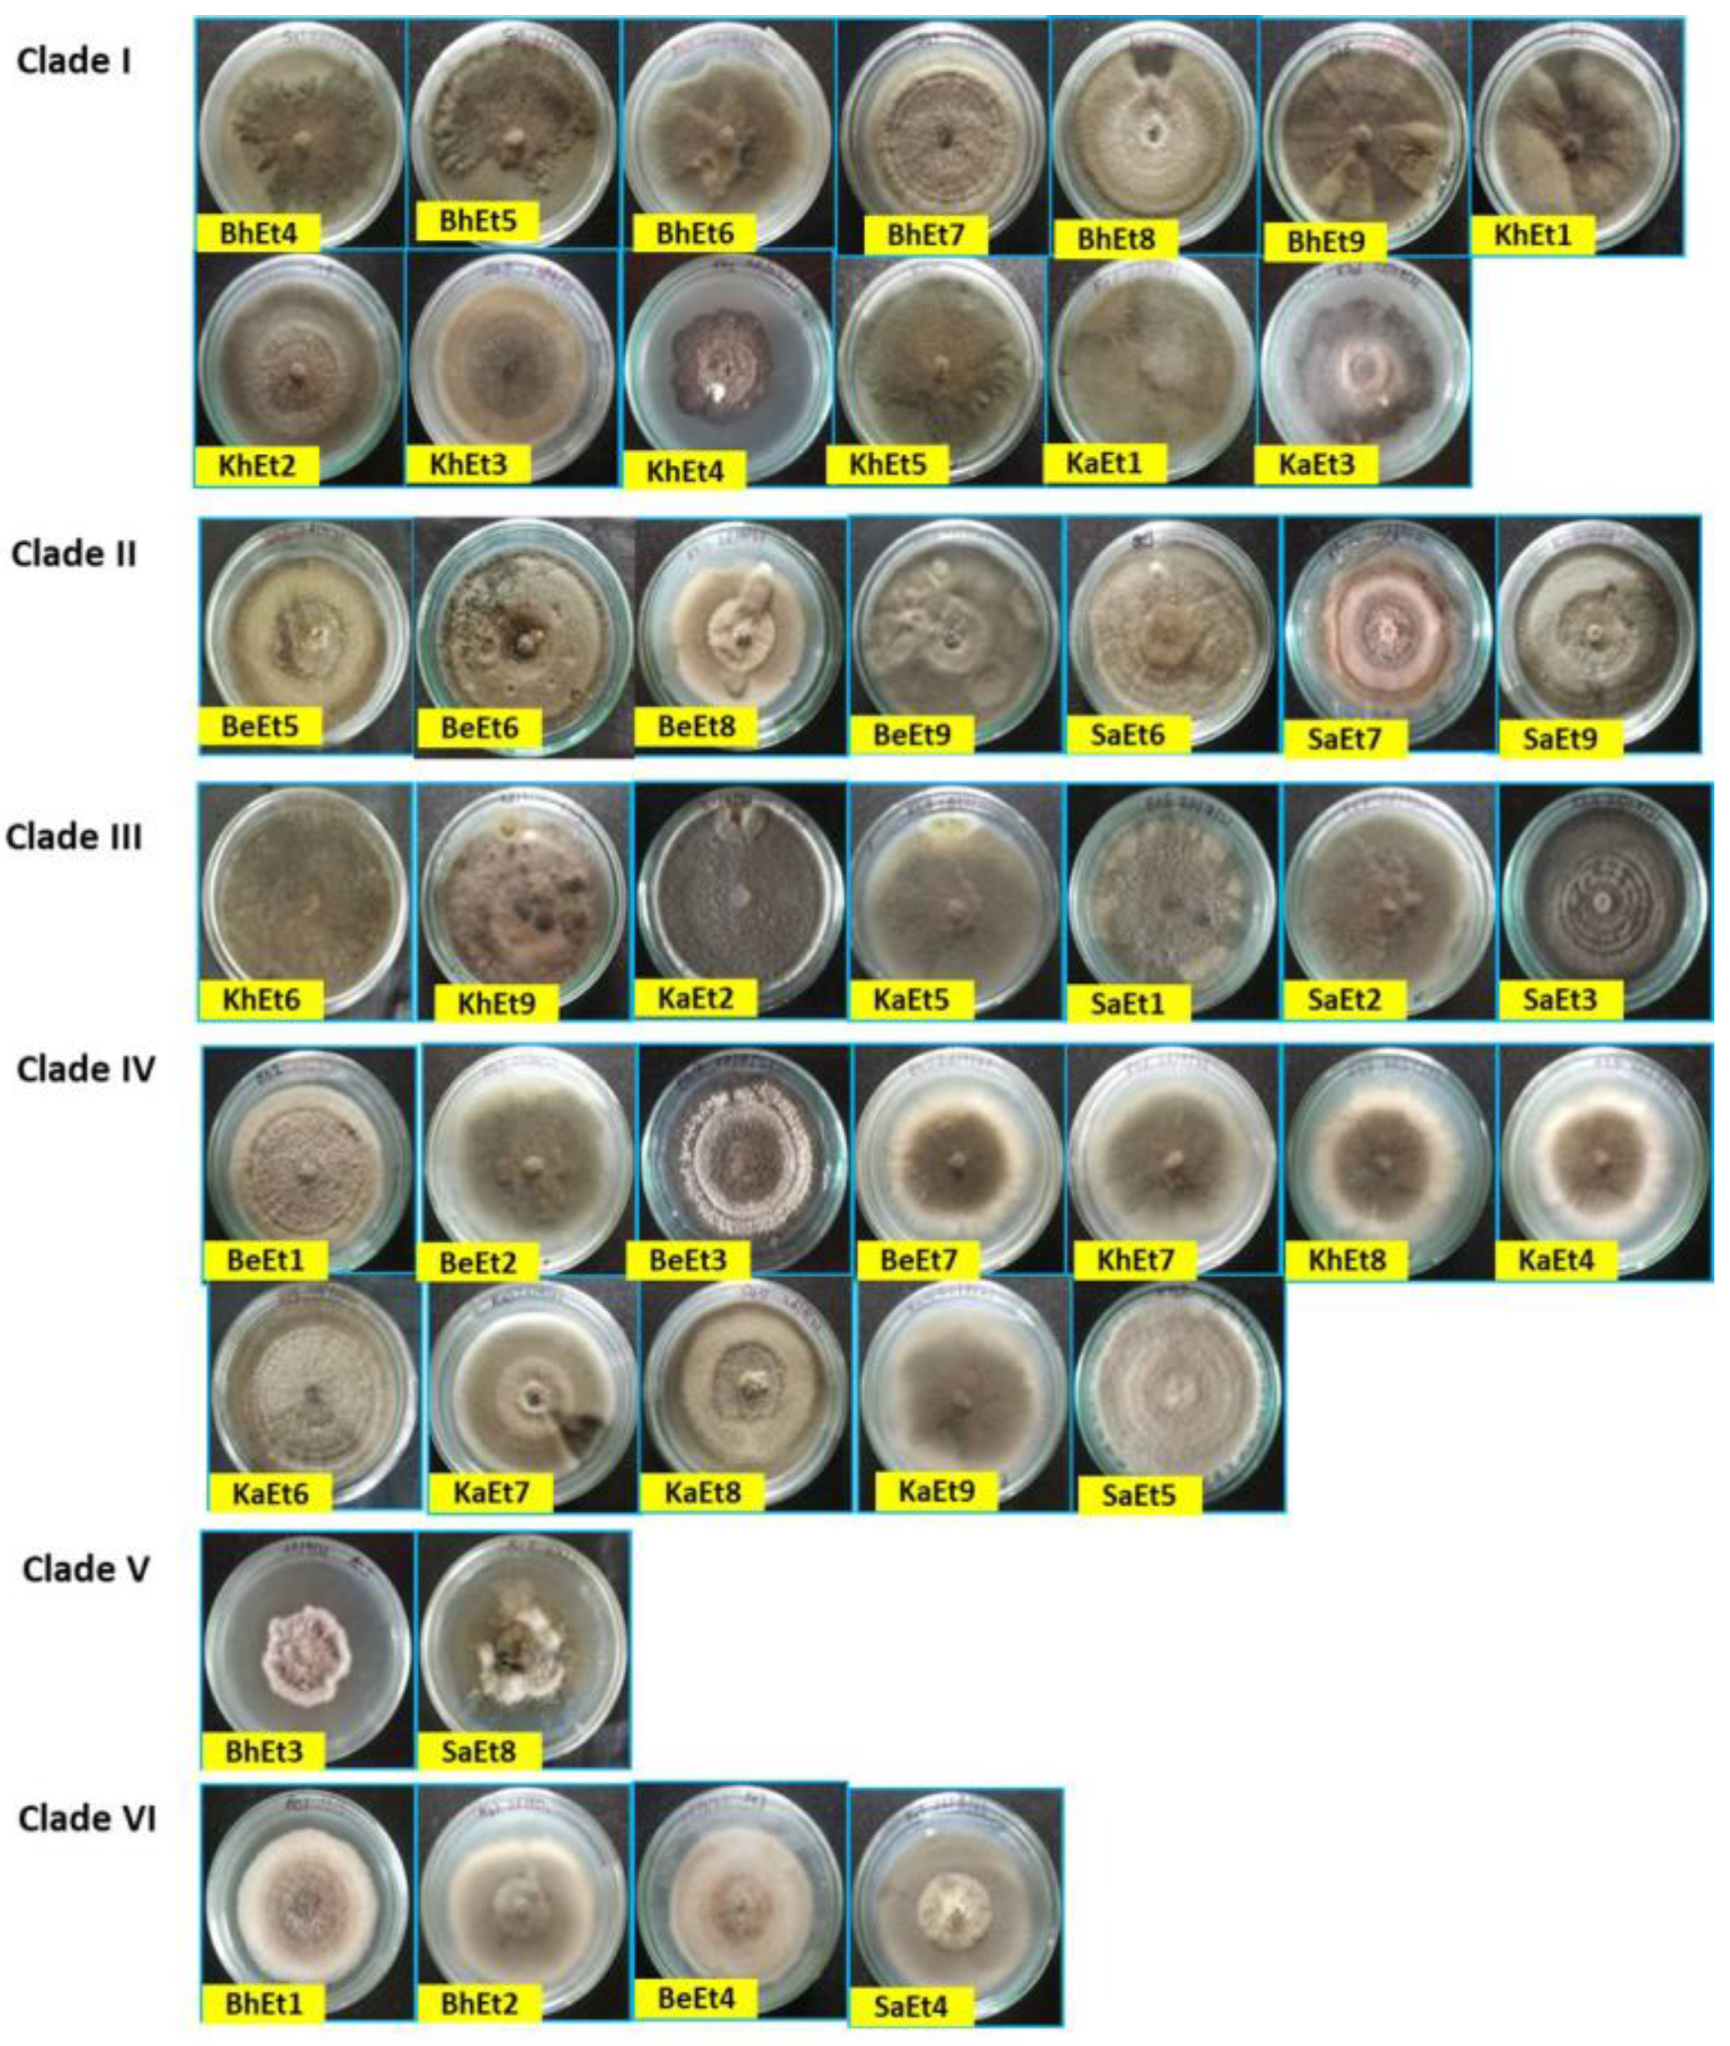
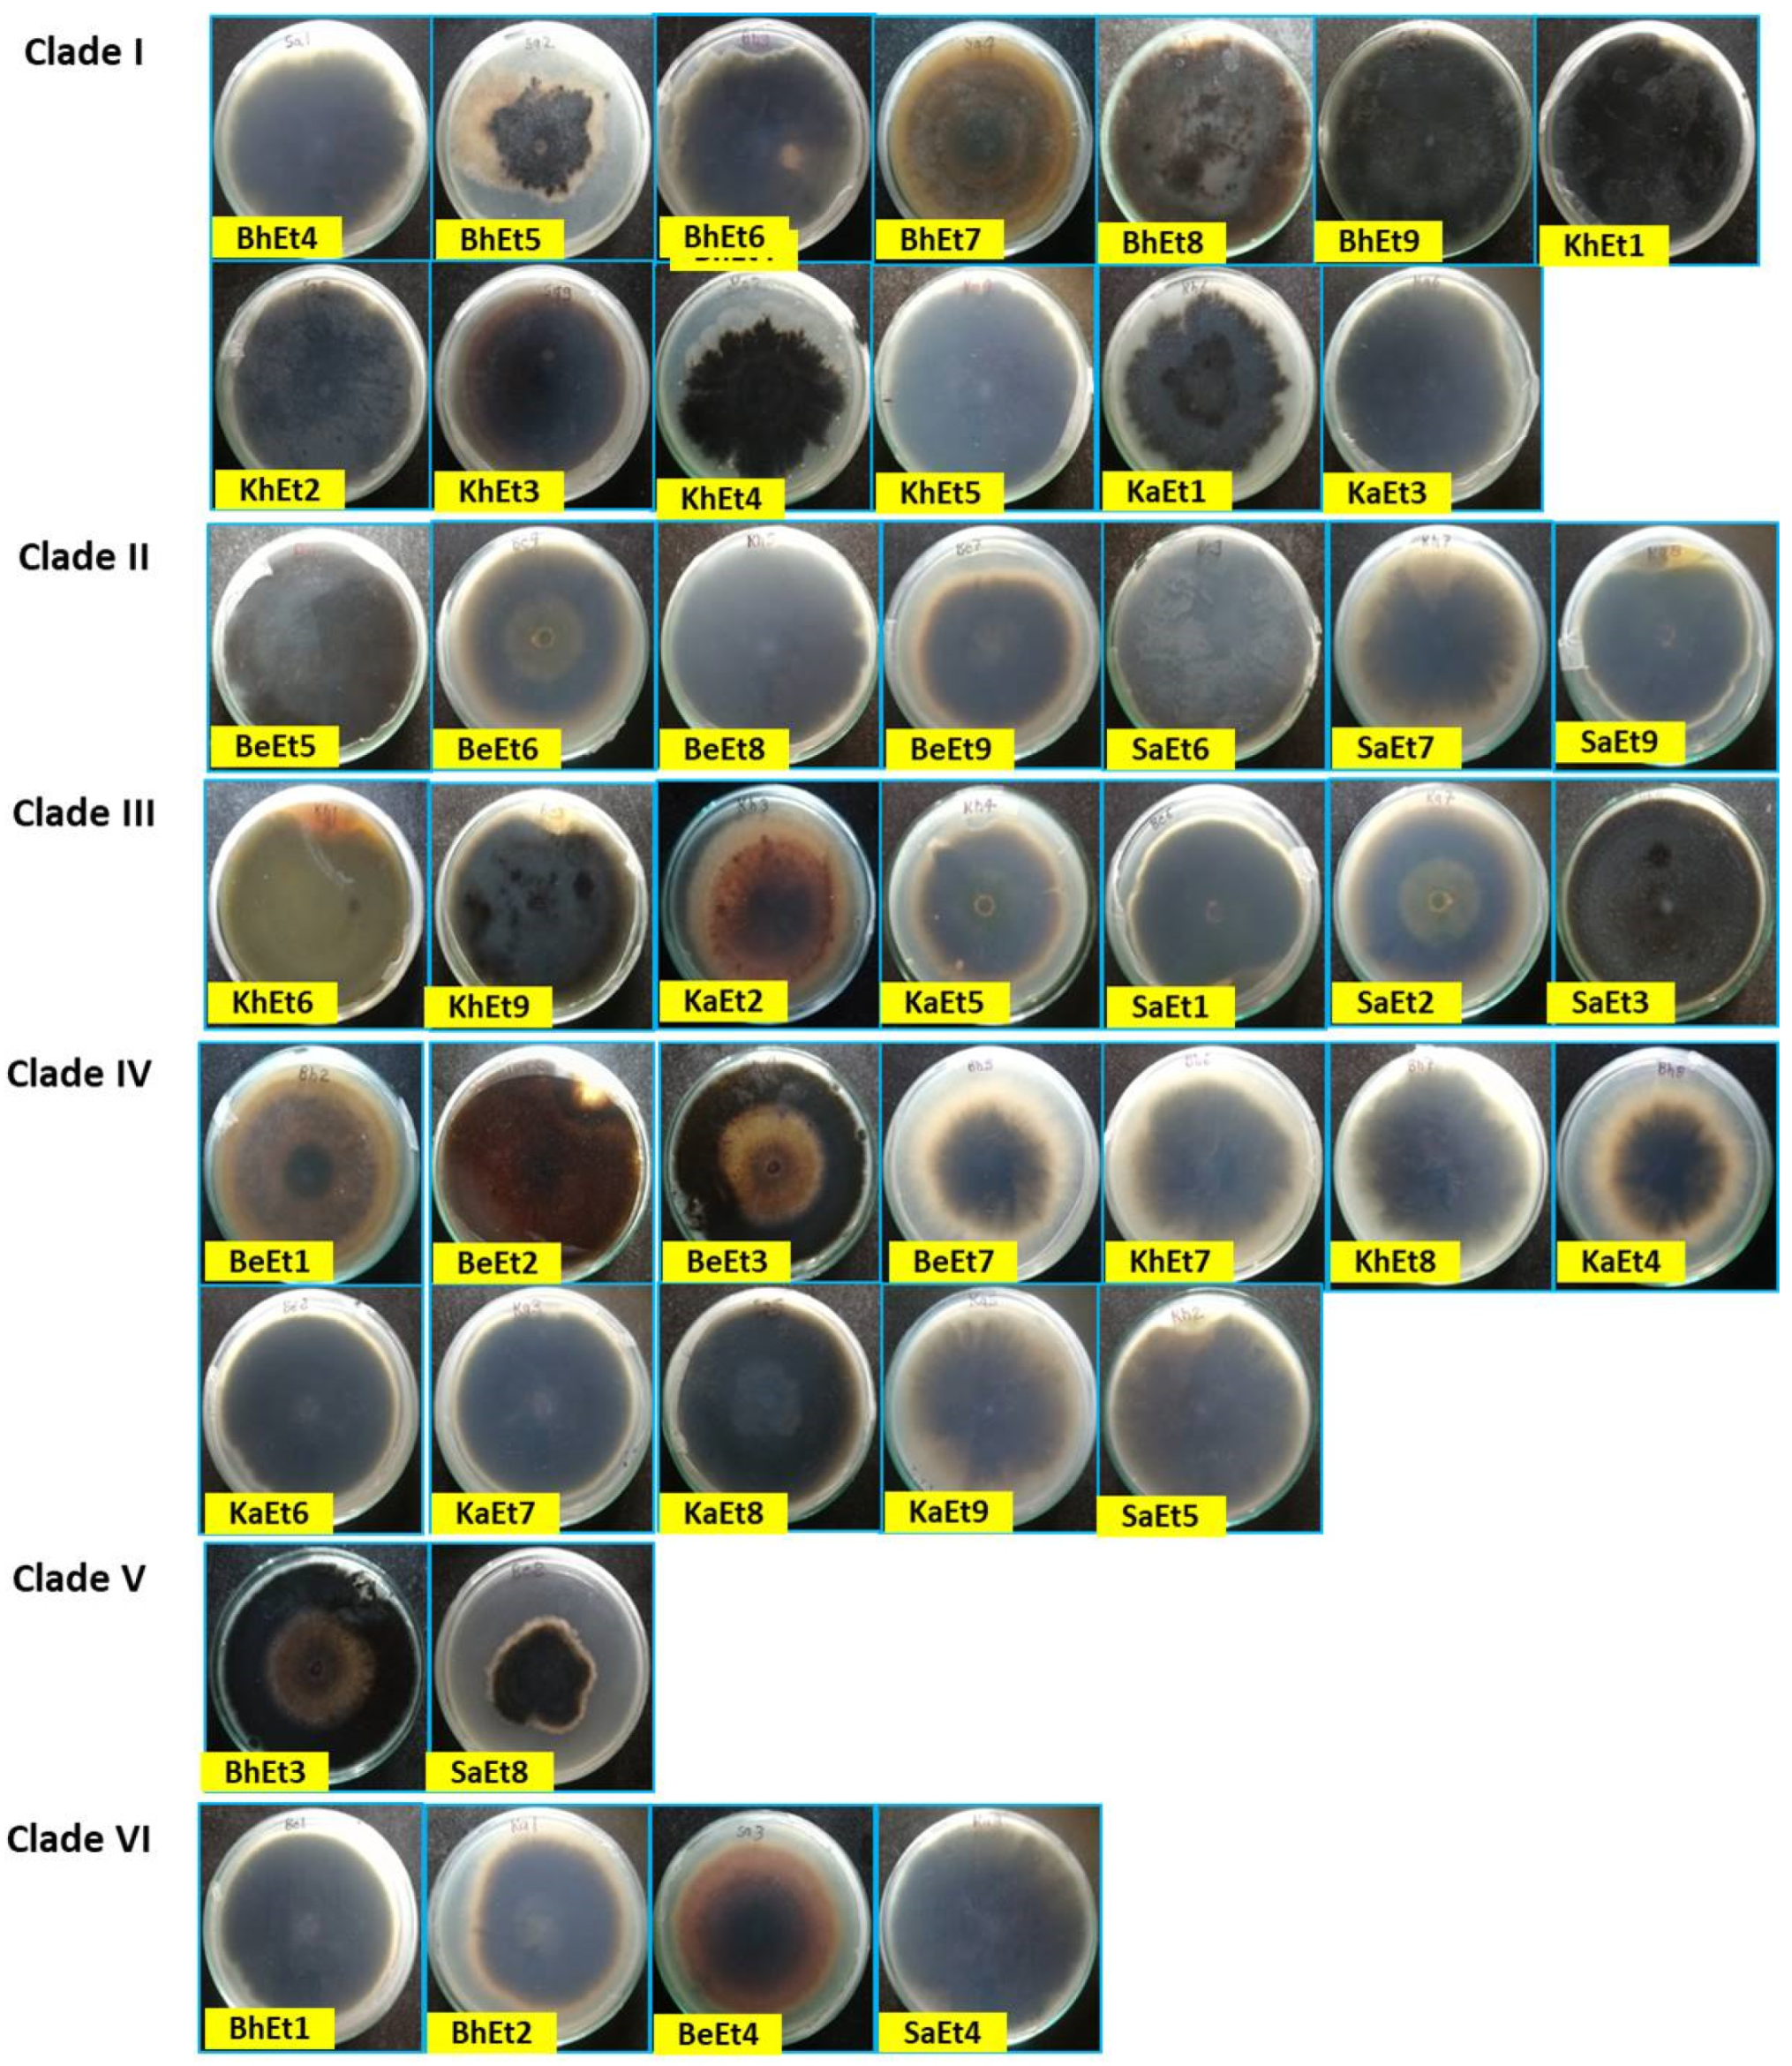
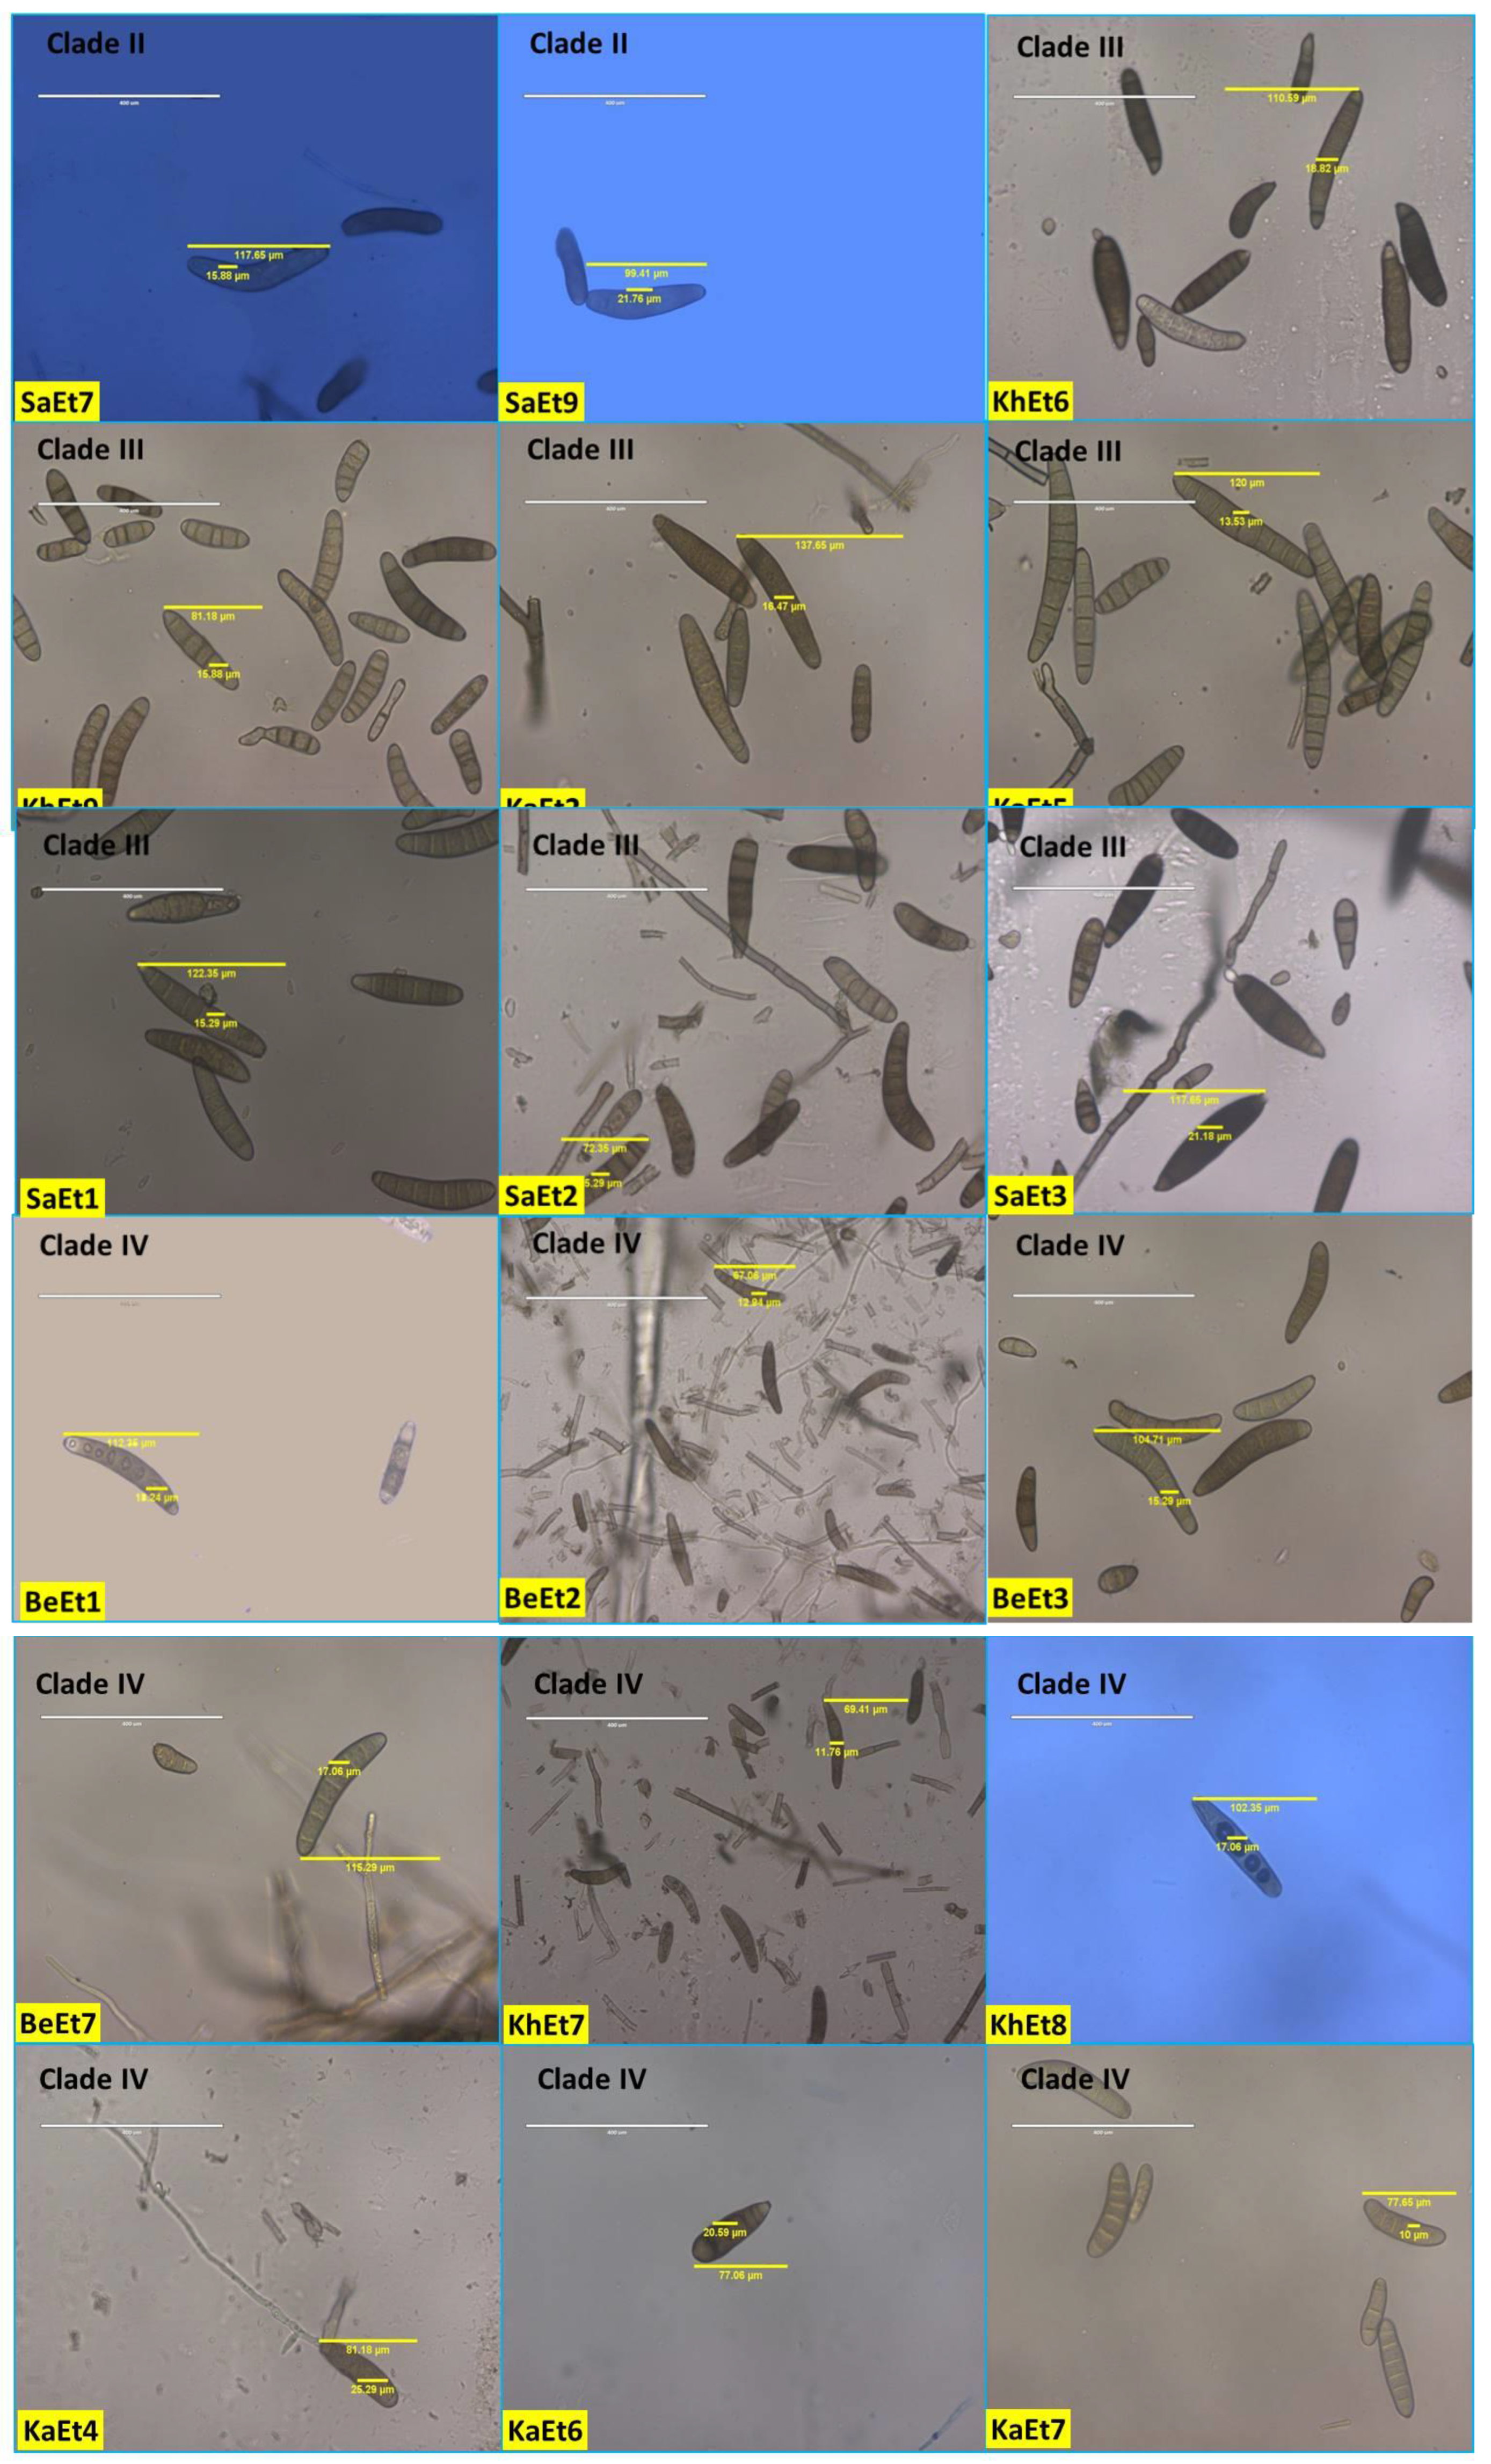
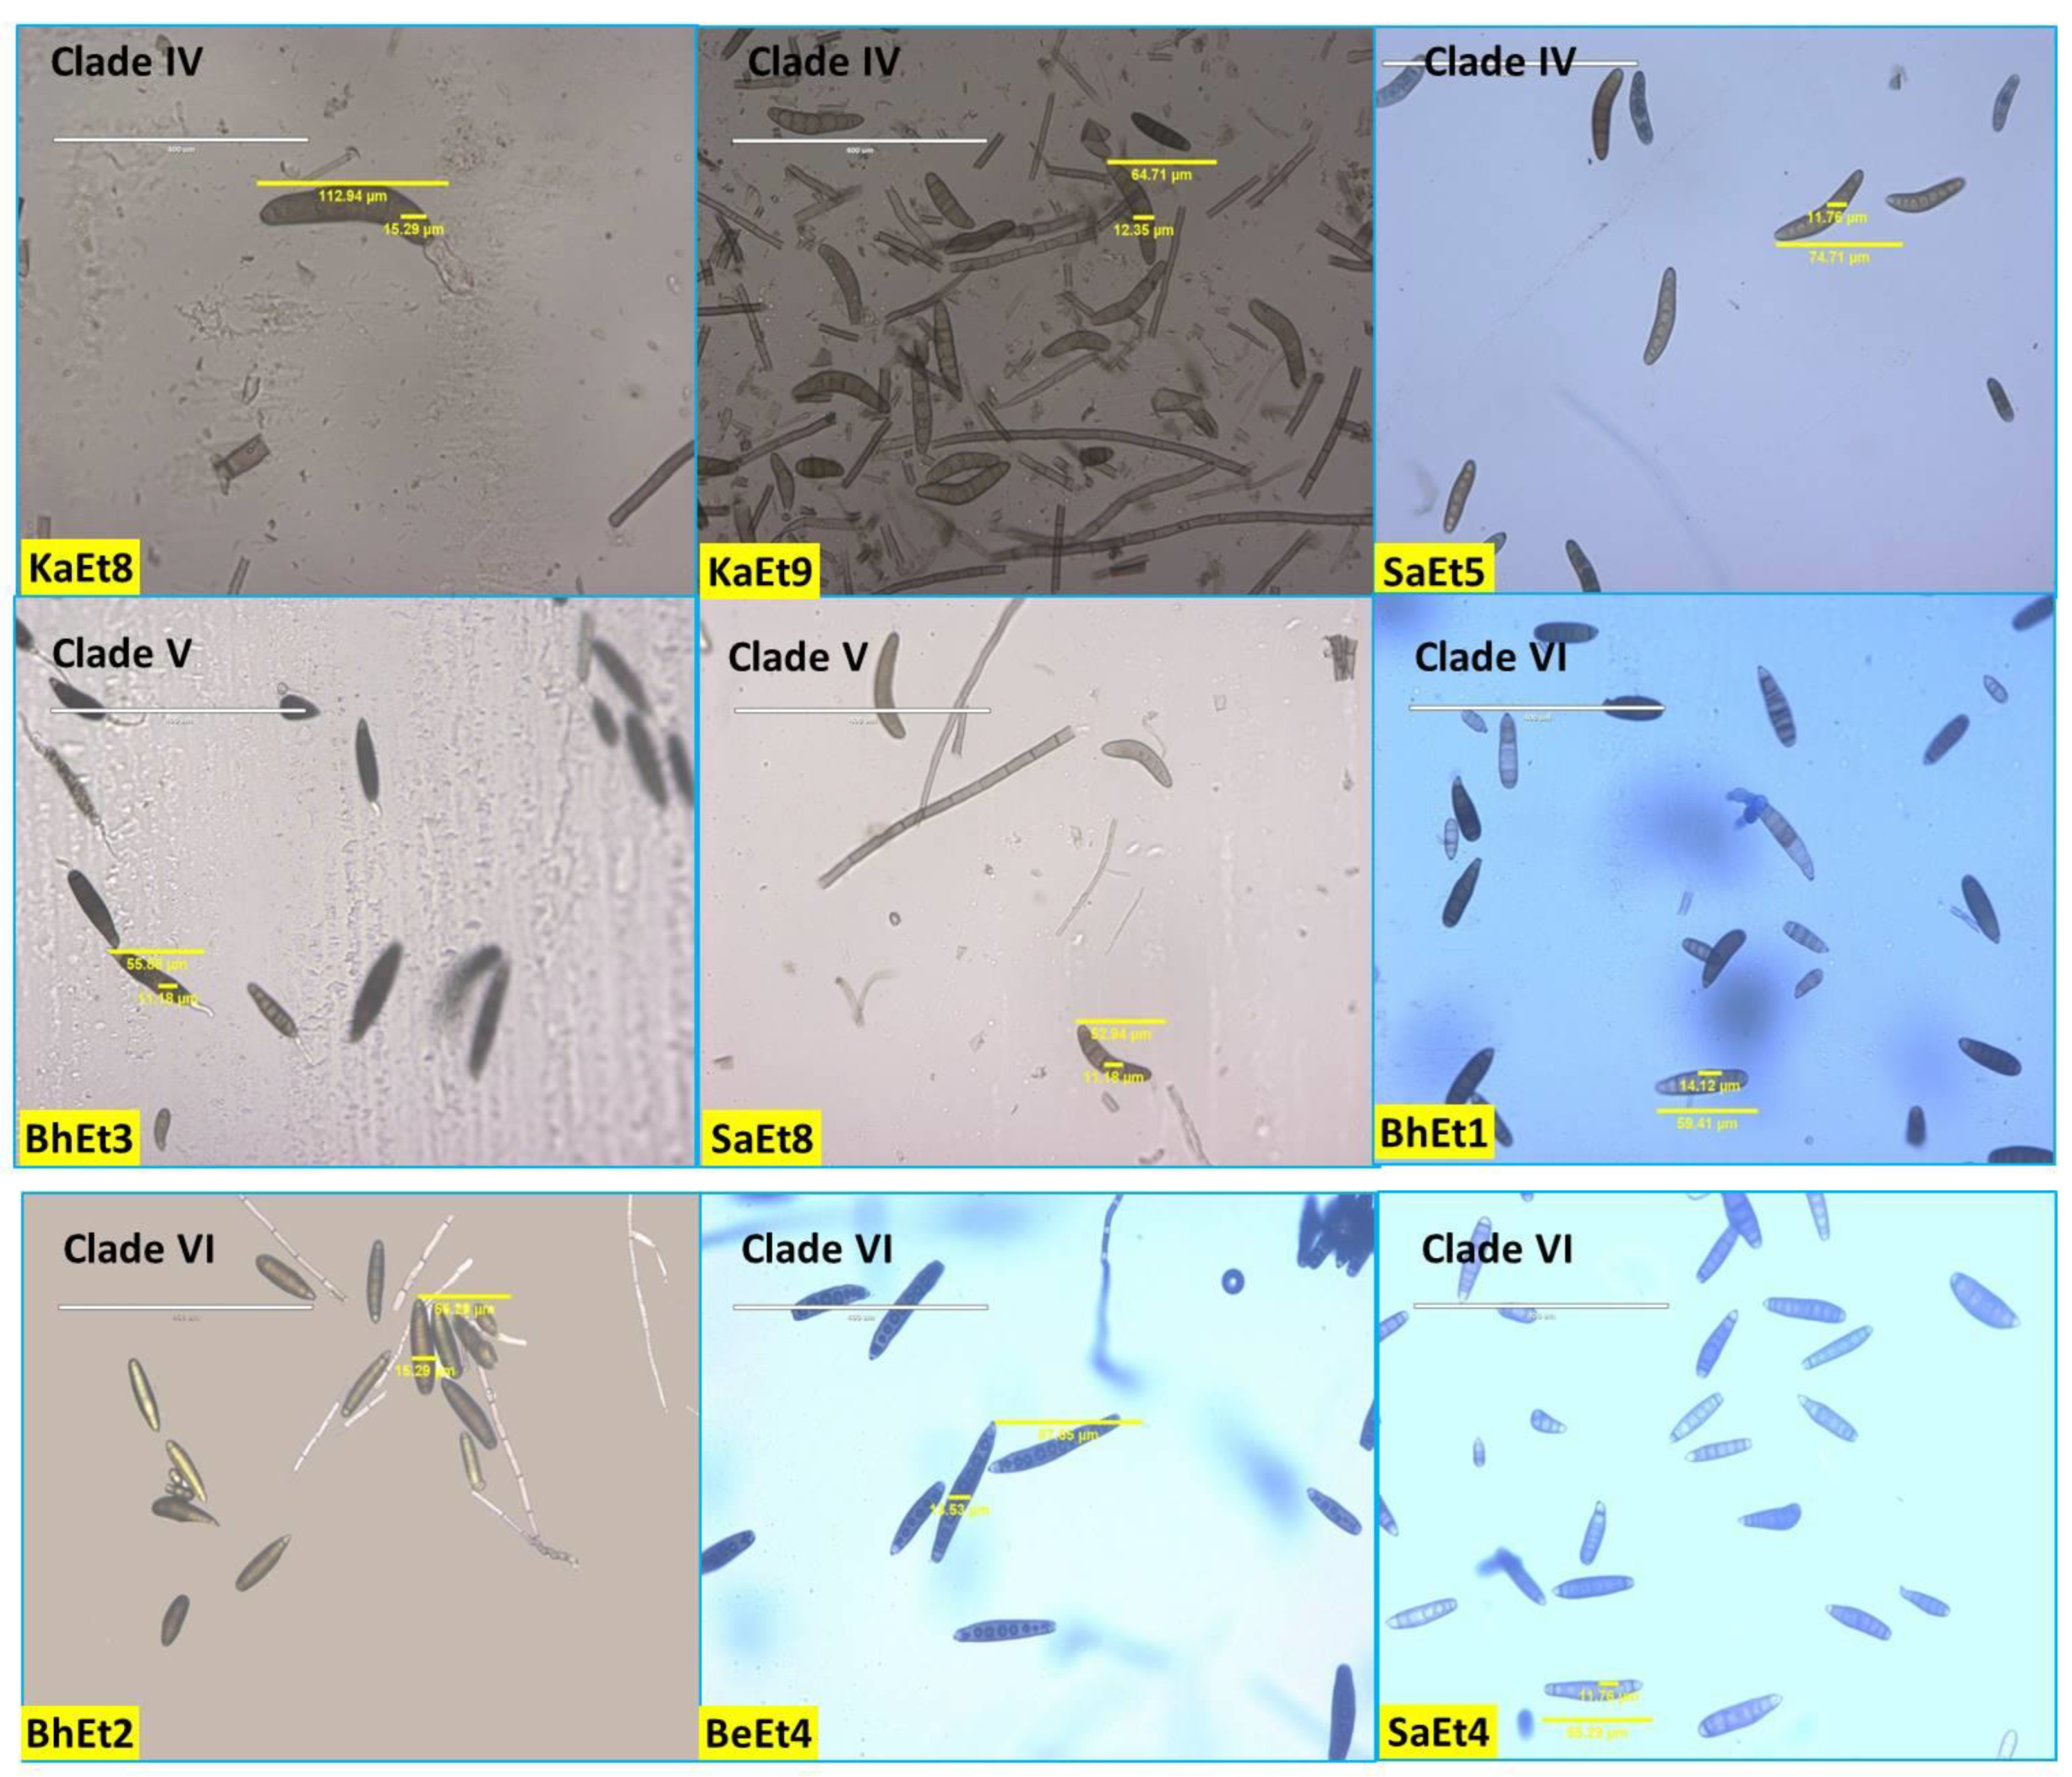
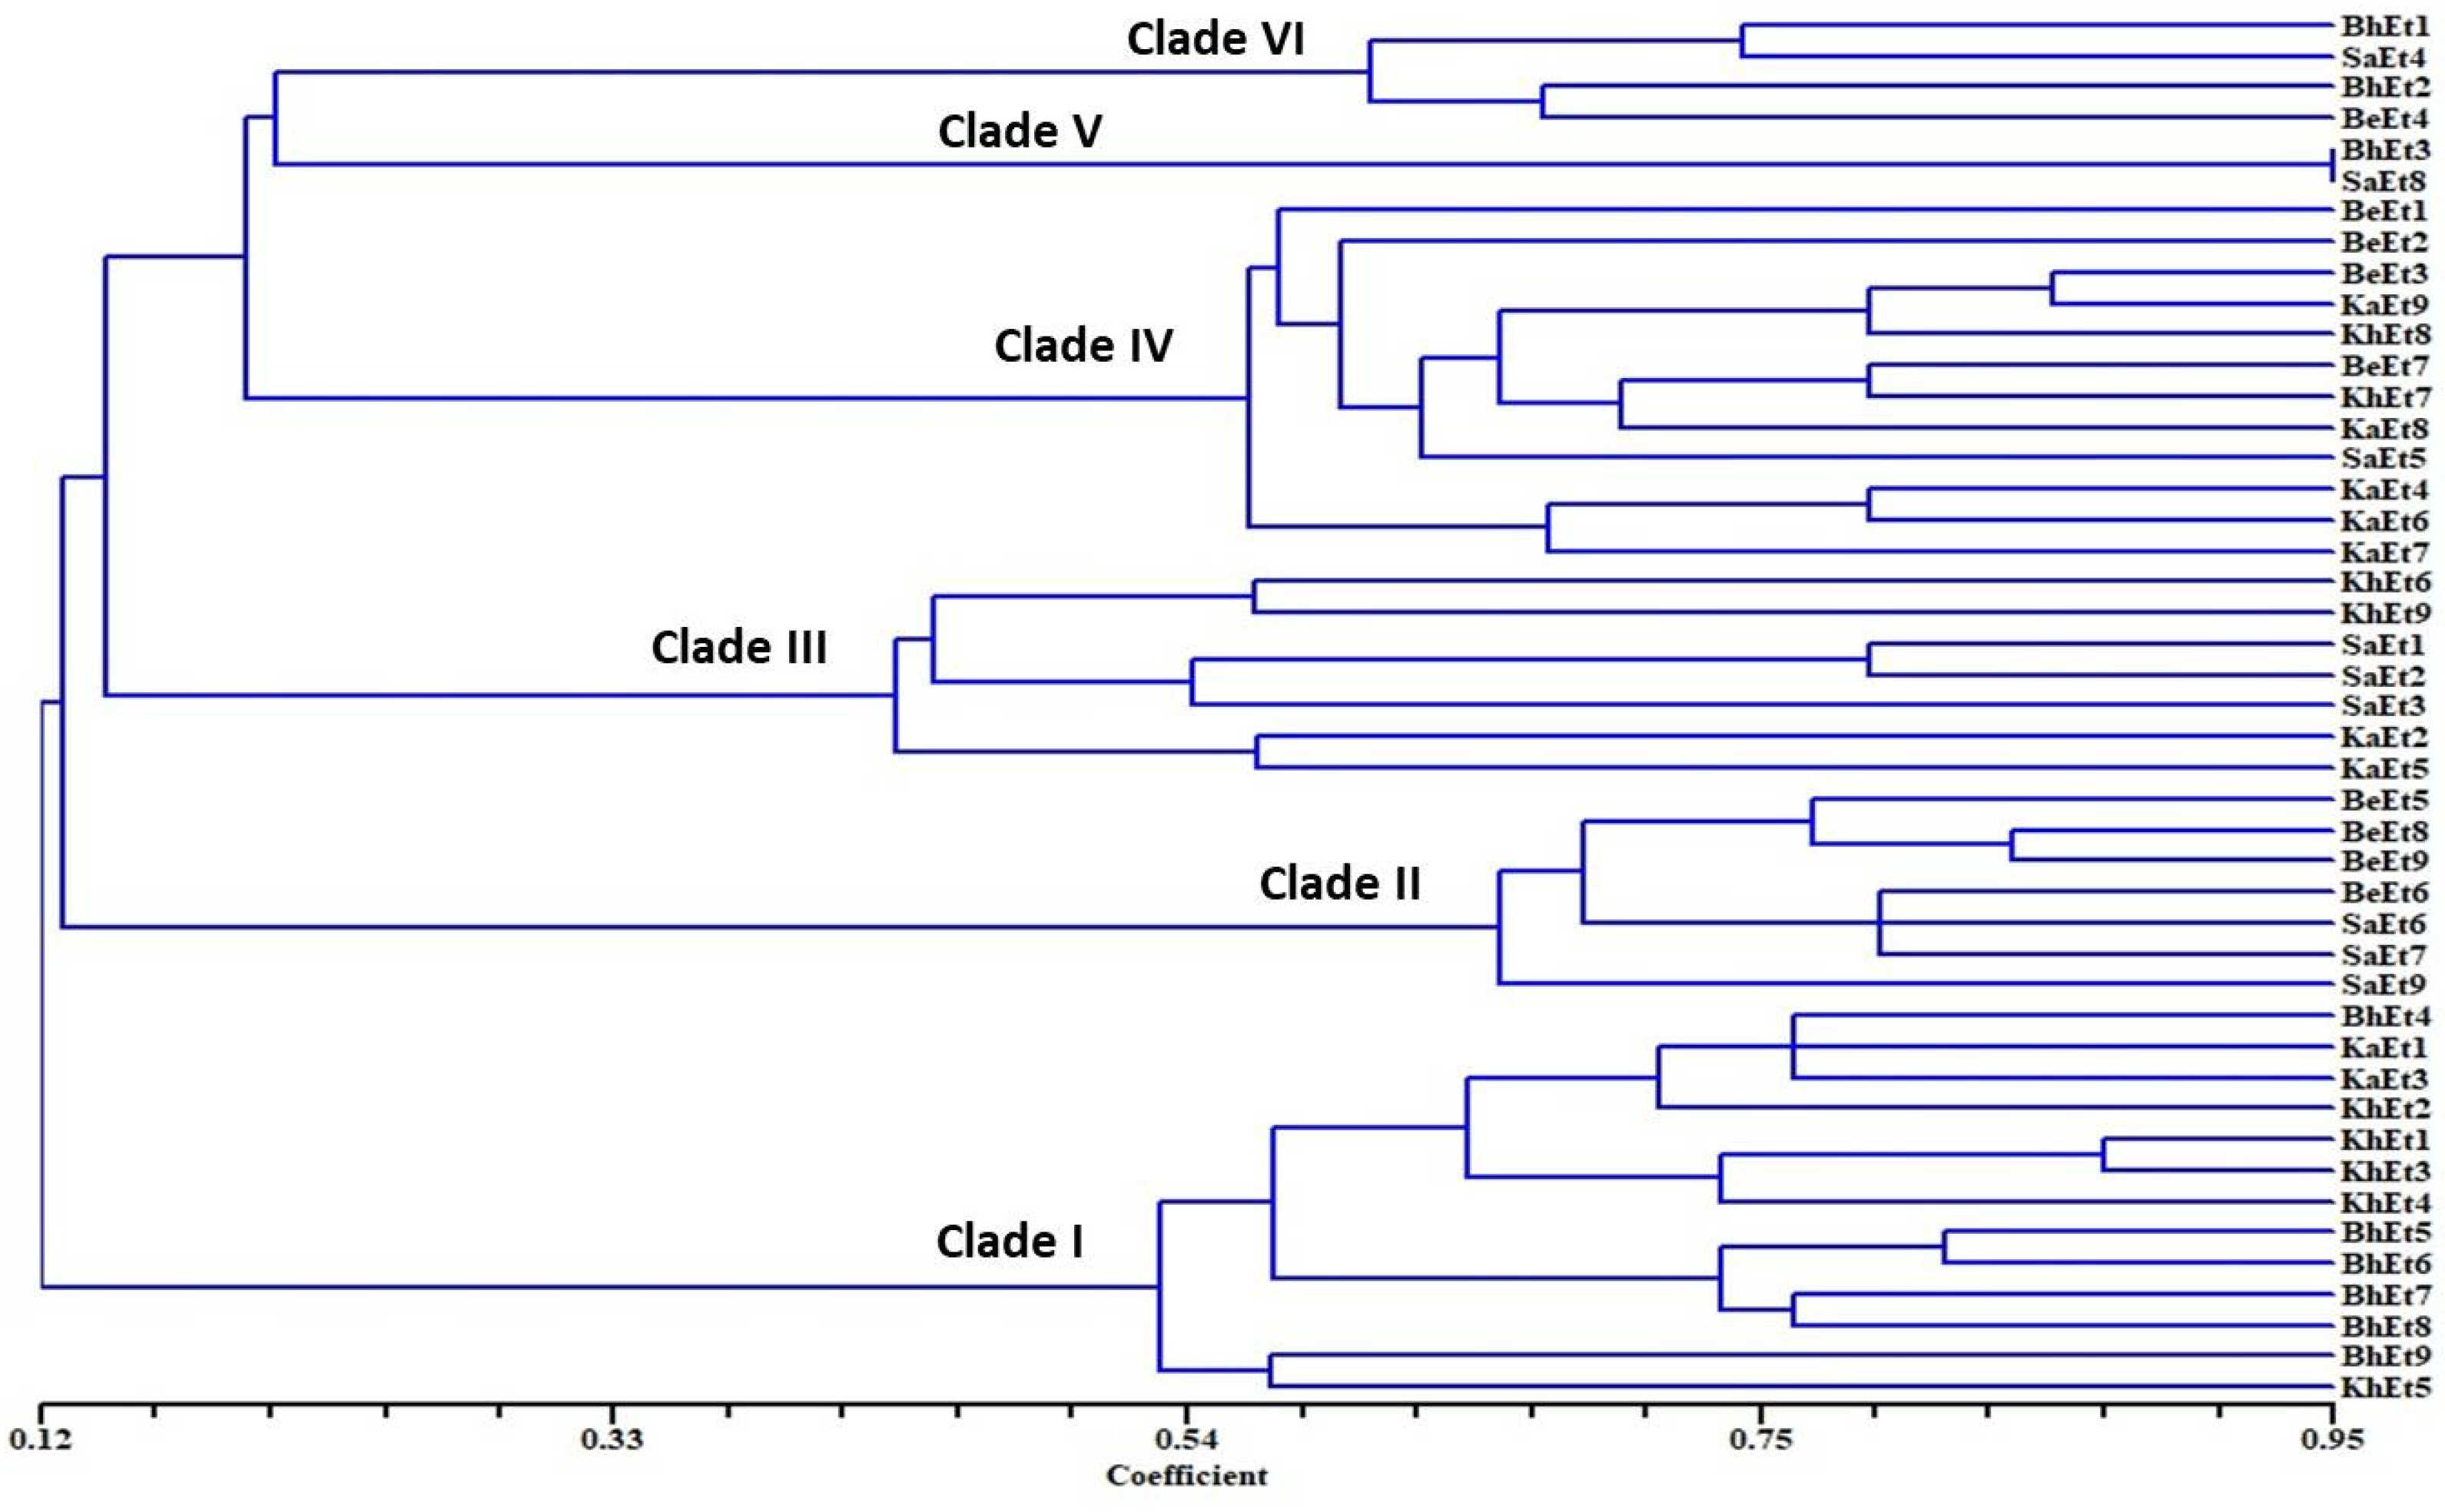
3.1. Cultural and Morphological Characterization

The colony colors varied from olivaceous brown to a whitish black color. Based on the colony color, all 45 isolates were grouped into four categories, i.e., (i) olivaceous brown (BhEt2, BhEt4, BeEt2, BeEt4, BeEt5, BeEt8, KhEt2, KhEt5, KhEt7, KhEt8, KaEt1, KaEt3, KaEt8, KaEt9, SaEt3, and SaEt9), (ii) blackish brown (BhEt1, BeEt3, SaEt4, and SaEt5), (iii) whitish black (BhEt3, BhEt5, BhEt6, BhEt7, BhEt8, BeEt1, KhEt6, KaEt2, and KaEt5), and (iv) grayish (BhEt9, BeEt6, BeEt7, BeEt9, KhEt1, KhEt3, KhEt4, KhEt9, KaEt4, KaEt6, KaEt7, SaEt1, SaEt2, SaEt6, SaEt7, and SaEt8) (Figure 1 and Figure 2, Table 1).
Based on the colony type, all 45 isolates were grouped into four categories, i.e., (i) flattened (BhEt1, BhEt2, BhEt4, BeEt2, BeEt6, BeEt7, KhEt1, KhEt3, KhEt7, KhEt8, KhEt9, SaEt3, SaEt5, SaEt8, and SaEt9), (ii) raised cottony (BhEt5, BhEt6, BhEt7, and BhEt8), (iii) slightly raised fluffy (BeEt1, BeEt3, BeEt4, BeEt5, BeEt8, BeEt9, KhEt5, KaEt1, KaEt2, KaEt9, and SaEt4), and (iv) fluffy raised cottony (BhEt3, BhEt9, KhEt2, KhEt4, KhEt6, KaEt3, KaEt4, KaEt5, KaEt6, KaEt7, KaEt8, SaEt1, SaEt2, SaEt6, and SaEt7).
The highest (90.0 mm) growth was observed in the BhEt1, BeEt3, BeEt6, BeEt7, BeEt9, KhEt1, KhEt2, KhEt3, KhEt8, KhEt9, KaEt4, KaEt6, KaEt8, SaEt1, SaEt2, SaEt5, SaEt6, and SaEt7 isolates followed by the SaEt4 isolate (89.9 mm), whereas the lowest (64.6 mm) growth was observed in BeEt5 followed by the isolate KaEt5 (64.7 mm) on 10 days after inoculation (Figure 1 and Figure 2, Table 1).
Based on colony margin, all the E. turcicum isolates were classified into two groups, i.e., regular margin and irregular margin. The isolates BhEt1, BhEt2, BhEt3, BhEt4, BhEt5, BhEt6, BhEt7, BhEt8, BeEt2, BeEt3, BeEt4, BeEt6, BeEt7, BeEt9, KhEt1, KhEt2, KhEt3, KhEt4, KhEt7, KhEt8, KhEt9, KaEt1, KaEt3, KaEt4, KaEt5, KaEt6, KaEt7, KaEt8, KaEt9, SaEt1, SaEt2, SaEt3, SaEt4, SaEt5, SaEt6, SaEt7, SaEt8, and SaEt9 came under the group of colonies with regular margins, while irregular margins were observed in the isolates BhEt9, BeEt1, BeEt5, BeEt8, KhEt5, KhEt6, and KaEt2 (Figure 1 and Figure 2, Table 1).
Based on margin color, all the E. turcicum isolates were categorized into four groups, i.e., gray, brown, white, and black color. The isolates BhEt9, KhEt1, KhEt3, KhEt4, KhEt7, KhEt9, KaEt4, KaEt6, KaEt7, KaEt8, SaEt1, SaEt2, SaEt6, SaEt7, and SaEt8 came under the group of colonies with a gray color margin; isolates BhEt1, BhEt2, BhEt4, BeEt2, BeEt3, BeEt4, KhEt5, KhEt8, KaEt9, SaEt3, SaEt4, SaEt5, and SaEt9 came under the group of colonies with a brown color margin; isolates BhEt3, BhEt5, BhEt6, BhEt7, BhEt8, BeEt5, KhEt2, KaEt1, KaEt3, and KaEt5 came under the group of colonies with a white color margin; and isolates BeEt1, BeEt6, BeEt7, BeEt8, BeEt9, KhEt6, and KaEt2 came under the group of colonies with a black color margin (Figure 1 and Figure 2, Table 1).
Based on pigmentation, E. turcicum isolates were grouped into three groups, i.e., (i) brownish (BhEt1, BhEt2, BhEt4, BeEt2, BeEt4, BeEt9, KhEt2, KhEt5, KhEt8, KaEt1, KaEt3, KaEt9, SaEt3, and SaEt9), (ii) grayish black (BhEt3, BhEt9, BeEt3, BeEt6, BeEt7, KhEt1, KhEt3, KhEt4, KhEt9, KaEt4, KaEt6, KaEt7, SaEt1, SaEt2, SaEt4, SaEt5, SaEt6, SaEt7, and SaEt8), and (iii) whitish black (BhEt5, BhEt6, BhEt7, BhEt8, BeEt1, BeEt5, BeEt8, KhEt6, KhEt7, KaEt2, KaEt5, and KaEt8) (Figure 1 and Figure 2, Table 1).
The conidial septa varied from 2–12, with the maximum number observed for isolates KhEt1, KhEt5, KaEt4, SaEt2, and SaEt3 (3–12), followed by BeEt7 (3–11), BeEt9, KhEt4, KhEt6, KhEt8 KaEt6, SaEt4, SaEt7, and SaEt9 (3–10), and the minimum in BhEt9, BeEt2, and KaEt1 (2–5) followed by KhEt9 (2–6). Most isolates (approximately 20) with conidial septa ranged from 3 to 6, 3 to 7, 3 to 8, or 3 to 9 (Figure 3, Table 1).
Conidial length also varied from 52.94–144.12 µm and conidial width from 10.0–25.88 µm. The largest conidial length and width was recorded in SaEt4 (144.12 × 25.88 µm) followed by BhEt6 (137.65 × 16.47 µm and KhEt2 (130.5 × 24.12 µm), and the smallest conidial length was recorded in SaEt9 (52.94 × 11.18 µm) followed by SaEt1 (55.29 × 15.29 µm) and BhEt3 (55.88 × 11.18 µm) (Figure 3, Table 1).
Based on conidial shape, all the E. turcicum isolates were classified into two groups, i.e., elongated, ellipsoidal, obclavate to fusiform, slightly curved, spindle-shaped with protruding hilum (BhEt1, BhEt2, BhEt4, BhEt5, BhEt6, BeEt1, BeEt2, BeEt3, BeEt5, BeEt6, BeEt7, BeEt8, BeEt9, KhEt1, KhEt2, KhEt3, KhEt4, KhEt5, KhEt6, KhEt7, KhEt8, KhEt9, KaEt1, KaEt2, KaEt3, SaEt3, SaEt4, SaEt6, SaEt7, SaEt8, and SaEt9) or elongated, ellipsoidal, obclavate to fusiform, spindle-shaped with protruding hilum (BhEt3, BhEt7, BhEt8, BhEt9, BeEt4, KaEt4, KaEt5, KaEt6, KaEt7, KaEt8, KaEt9, SaEt1, SaEt2, and SaEt5) (Figure 3, Table 1).
Based on the conidial color, all the E. turcicum isolates were classified into three groups, i.e., brown, dark brown, and olivaceous brown. The isolates BhEt1, BhEt4, BhEt6, BeEt6, KhEt1, KhEt5, KhEt6, KhEt9, KaEt1, KaEt3, KaEt4, KaEt5, SaEt3, SaEt4, SaEt8, and SaEt9 came under the group of conidia with brown color; the isolates BhEt2, BhEt3, BhEt7, BhEt8, BhEt9, BeEt2, BeEt4, BeEt7, KhEt2, KhEt3, KhEt4, KhEt7, KaEt6, SaEt1, SaEt2, SaEt5, and SaEt7 came under the group of conidia with dark brown color; and the isolates BhEt5, BeEt1, BeEt3, BeEt5, BeEt8, BeEt9, KhEt8, KaEt2, KaEt7, KaEt8, KaEt9, and SaEt6 came under the group of conidia with olivaceous brown color (Figure 3, Table 1).
The number of conidia/microscopic field varied from 8–26. The maximum number of conidia was recorded in KhEt5 and SaEt8 (26.0), followed by KaEt4 (25.0), whereas the minimum number of conidia was recorded in BhEt7, BeEt1, BeEt4, BeEt9, KaEt1, and KaEt2 (8.0), followed by BhEt4, BeEt8, and KhEt3 (9.0) (Figure 3, Table 1).
The number of conidia/mL varied from 3.08–9.88 × 10⁵. The maximum number of conidia was recorded in BeEt6 and SaEt1 (9.88 × 10⁵), followed by SaEt2 (9.84 × 10⁵) and KhEt8 (9.78), whereas the minimum number of conidia was recorded in KaEt5 (3.08 × 10⁵), followed by KaEt2 (3.12 × 10⁵) (Figure 3, Table 1).
On the basis of morphological and cultural characterization, all the E. turcicum isolates were classified into six clades using their similarity coefficients (Figure 4). The isolates BhEt4, BhEt5, BhEt6, BhEt7, BhEt8, BhEt9, KhEt1, KhEt2, KhEt3, KhEt4, KhEt5, KaEt1, and KaEt3 came under clade I; the isolates BeEt5, BeEt6, BeEt8, BeEt9 SaEt6, SaEt7, and SaEt9 came under clade II; the isolates KhEt6, KhEt9, KaEt2, KaEt5, SaEt1, SaEt2, and SaEt3 came under clade III; the isolates BeEt1, BeEt2, BeEt3, BeEt7, KhEt7, KhEt8, KaEt4, KaEt6, KaEt7, KaEt8, KaEt9, and SaEt5 came under clade IV; the isolates BhEt3 and SaEt8 came under clade V; and the isolates BhEt1, BhEt2, BeEt4, and SaEt4 came under clade VI (Figure 4).

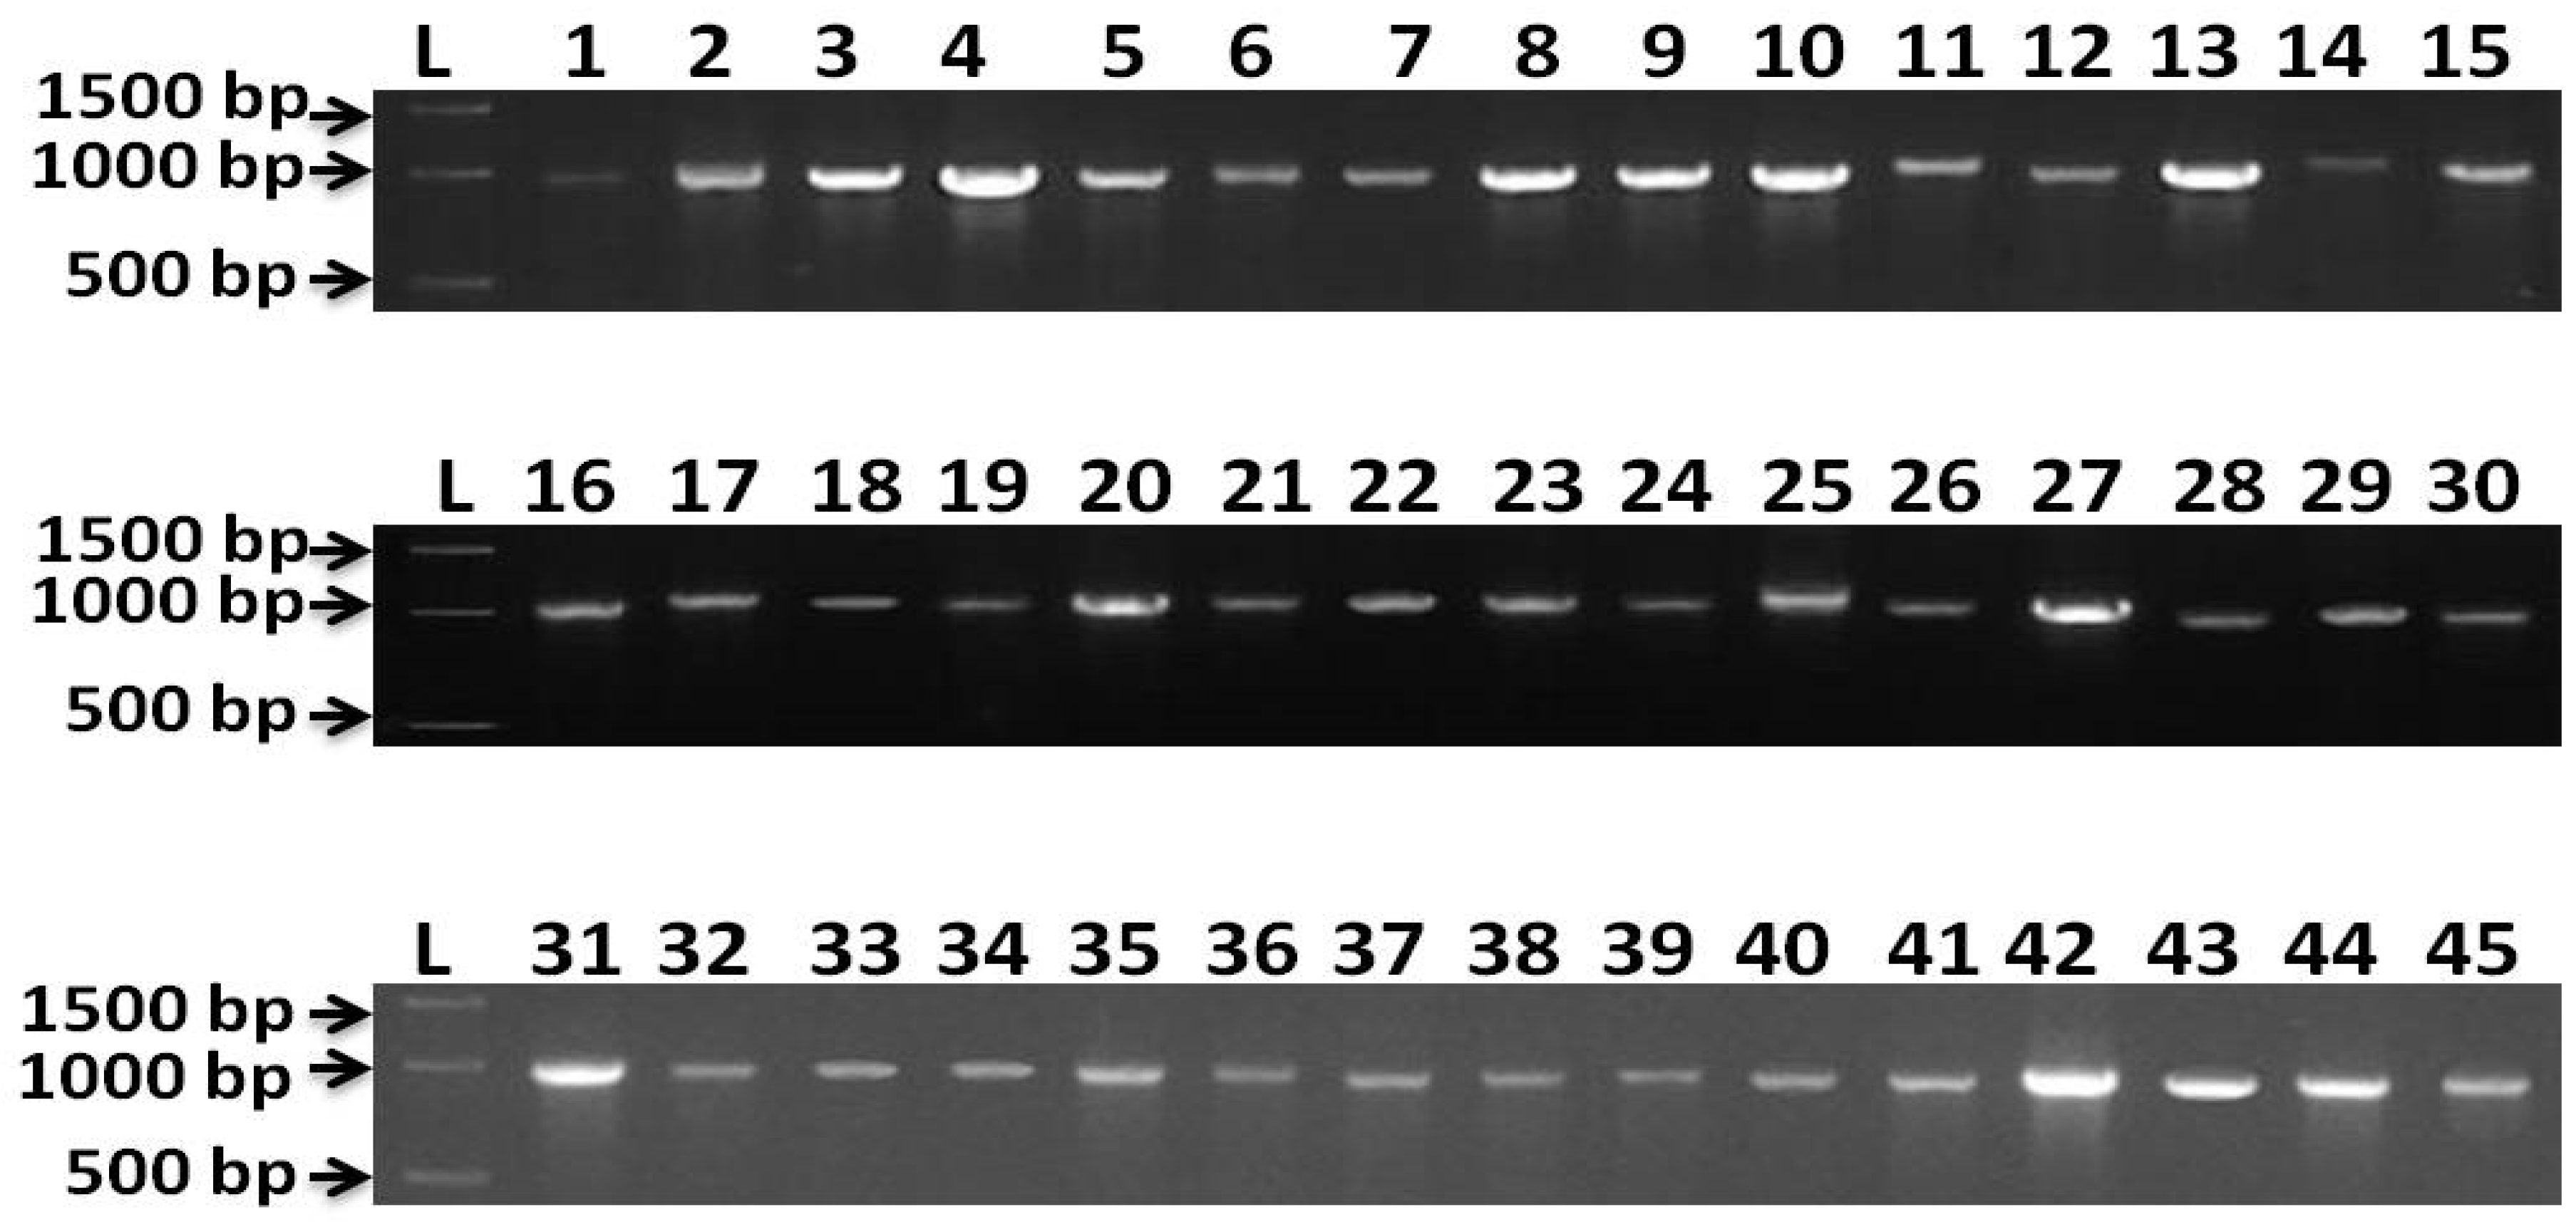
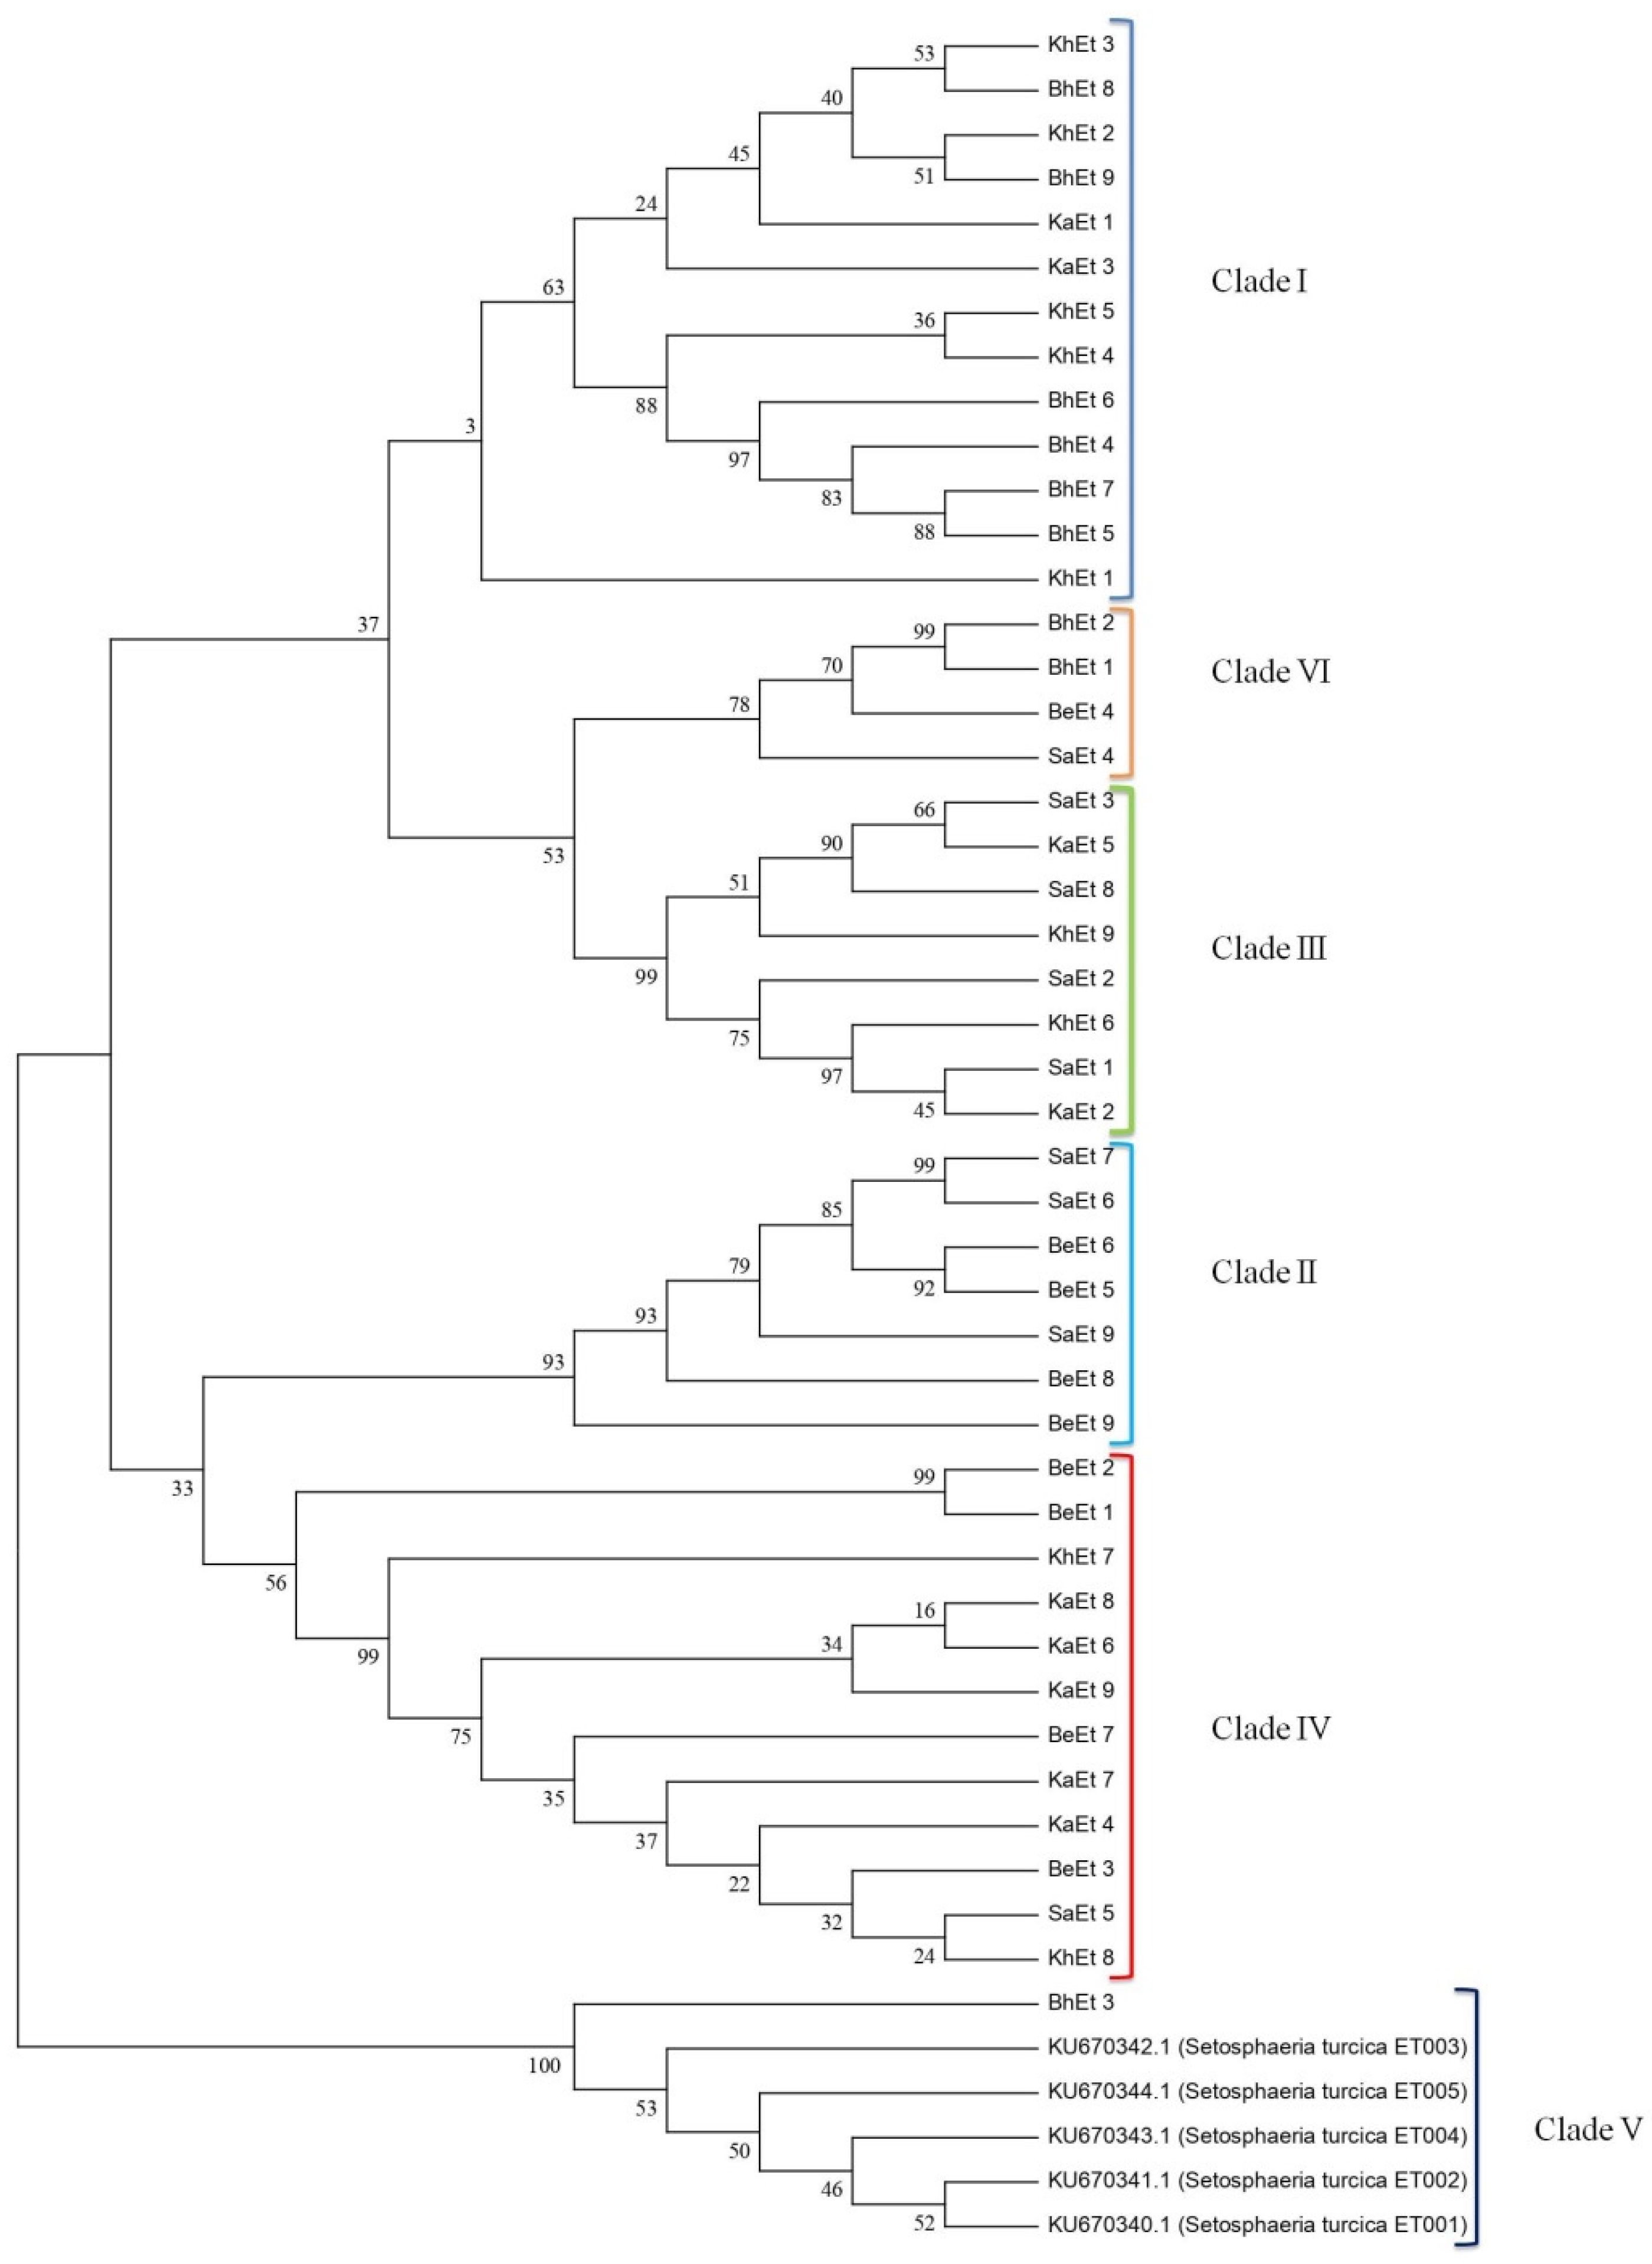
3.2. Molecular Characterization

Results from molecular identification indicated that 45 of the isolates were identified as E. turcicum (Setosphaeria turcica). Representative bands of PCR products were viewed using a gel documentation system (Figure 5). β-tubulin gene sequences analysis makes it possible to verify the identities of fungal strains. However, up to now there have been limited numbers of β-tubulin rDNA sequences in the public databases. In this study, it was therefore not possible to resolve the taxonomic affiliation. Figure 6 represents the phylogenetic relationships of all 45 isolates; all the isolates were clustered in the same clade. The β-tubulin gene sequences of BhEt1, BhEt2, BhEt3, BhEt4, BhEt5, BhEt6, BhEt7, BhEt8, BhEt9, BeEt1, BeEt2, BeEt3, BeEt4, BeEt5, BeEt6, BeEt7, BeEt8, BeEt9, KhEt1, KhEt2, KhEt3, KhEt4, KhEt5, KhEt6, KhEt7, KhEt8, KhEt9, KaEt1, KaEt2, KaEt3, KaEt4, KaEt5, KaEt6, KaEt7, KaEt8, KaEt9, SaEt1, SaEt2, SaEt3, SaEt4, SaEt5, SaEt6, SaEt7, SaEt8, and SaEt9 showed a high level of similarity (100% identity) with the reference isolates from GenBank (accession number KU670342.1, KU670344.1, KU670343.1, KU670341.1, KU670340.1).

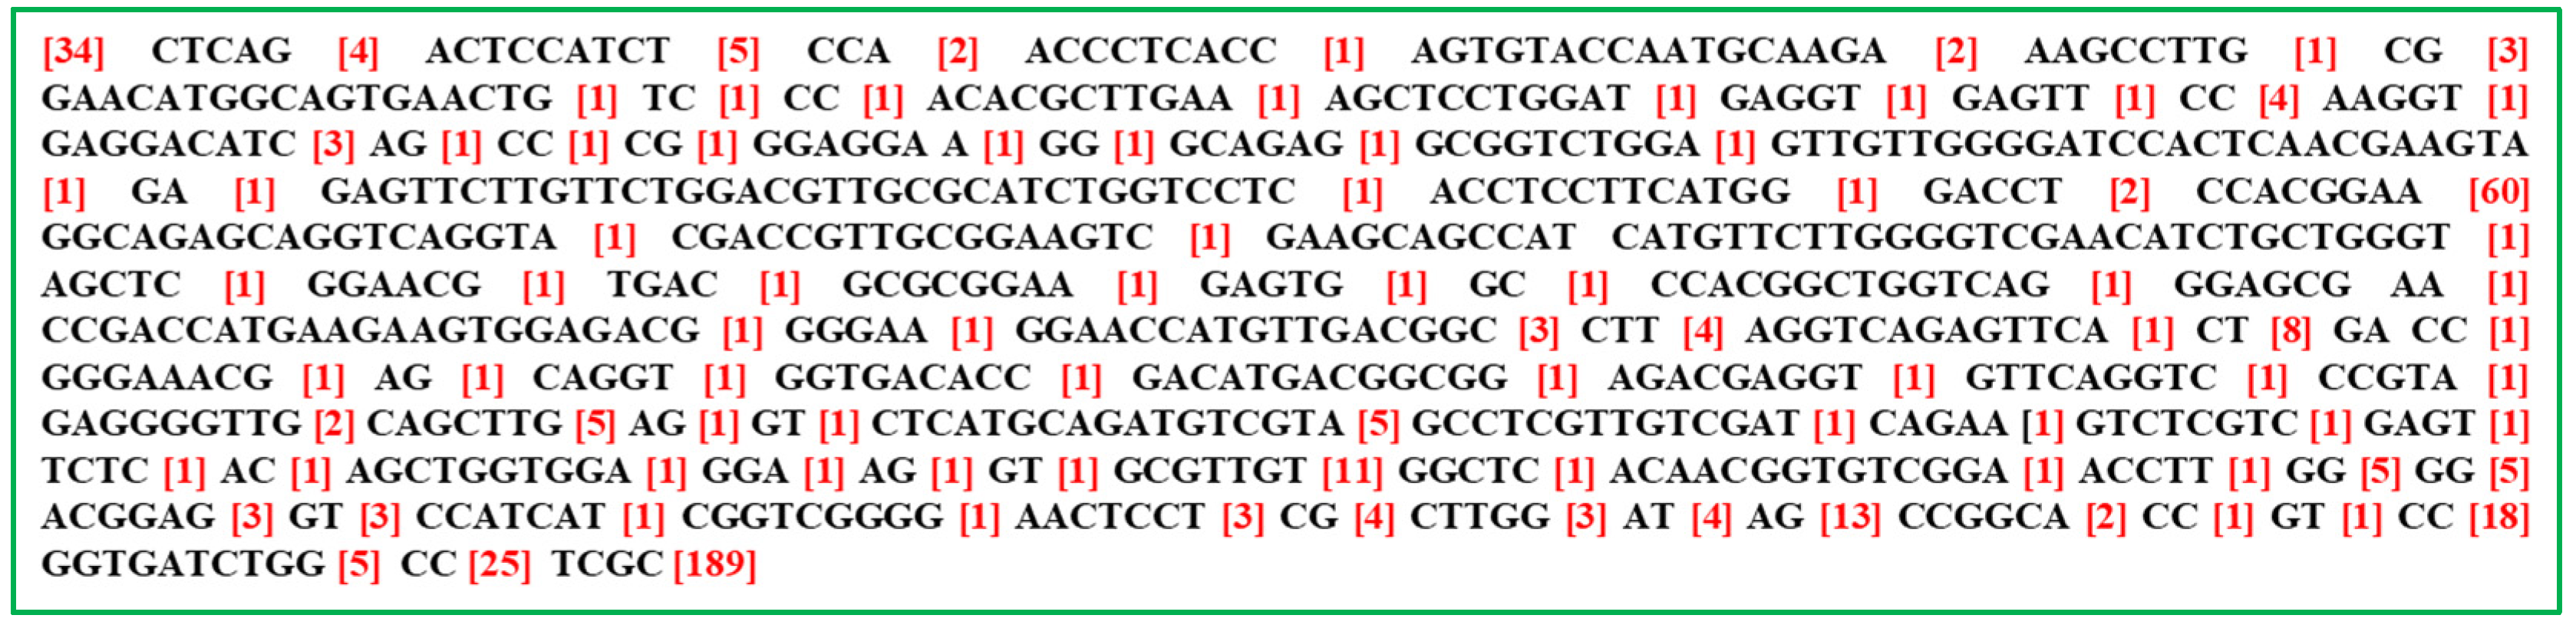
3.3. Sequence Analysis and Nucleotide Data Submission in GenBank

The sequence data were assembled and analyzed using Mega11 software. A sequence similarity Basic local alignment search tool (BLAST) was performed by comparing the sequence to other E. turcicum sequences using the tool’s website (http://www.ncbi.nlm.nih.gov/BLAST/) accessed on 11 August 2022. The data were subjected to multiple sequence alignments and a phylogenetic tree was constructed using Clustal Omega (http://www.ebi.ac.uk/Tools/msa/clustalo/) accessed on 11 August 2022 and Mega11 software. The sequence data of E. turcicum were submitted to the GenBank under the accession numbers ON813160 (SaEt9), ON813161 (SaEt8), ON813162 (SaEt7), ON813163 (SaEt6), ON813164 (SaEt5), ON813165 (SaEt4), ON813166 (SaEt3), ON813167 (SaEt2), ON813168 (SaEt1), ON813169 (KaEt9), ON813170 (KaEt8), ON813171 (KaEt7), ON813172 (KaEt6), ON813173 (KaEt5), ON813174 (KaEt4), ON813175 (KaEt3), ON813176 (KaEt2), ON813177 (KaEt1), ON813178 (KhEt9), ON813179 (KhEt8), ON813180 (KhEt7), ON813181 (KhEt6), ON813182 (KhEt5), ON813183 (KhEt4), ON813184 (KhEt3), ON813185 (KhEt2), ON813186 (KhEt1), ON813187 (BeEt9), ON813188 (BeEt8), ON813189 (BeEt7), ON813190 (BeEt6), ON813191 (BeEt5), ON813192 (BeEt4), ON813193 (BeEt3), ON813194 (BeEt2), ON813195 (BeEt1), ON813196 (BhEt9), ON813197 (BhEt8), ON813198 (BhEt7), ON813199 (BhEt6), ON813200 (BhEt5), ON813201 (BhEt4), ON813202 (BhEt3), ON813203 (BhEt2), and ON813204 (BhEt1).
Multiple sequence alignment of all 45 E. turcicum isolates indicated the presence of highly conserved regions (highlighted in black) throughout the β tubulin gene (Figure 7). Intriguingly, variable regions were also found in these isolates (highlighted in red). This suggests the divergence of different isolates of E. turcicum during the course of its evolution due to insertion or deletion events. The complete alignment file along with the details of consensus and variable regions is also depicted in Supplementary Figure S1.

4. Discussion

All 45 isolates of E. turcicum did differ in various aspects such as incubation period in days for maximum growth, colony color, pigmentation, sporulation, colony texture, color of conidia, number of conidia/microscopic field, and number of conidia/mL. Gowda reported similar variations [29,30]. Conidia measured 52.94–144.12 µm; were fusoid, smooth, straight, or curved; generally 2–12 septate; and had a small, protruding basal hilum. These observations of morphological variation among various isolates are consistent with those made by Misra and his coworker [31,32,33,34,35]. Despite these changes, the conidial size (50–144 µm) and septa of 4–9 of E. turcicum were within the usual described range of conidial size [36]. The morphological variations between the isolates of E. turcicum (Setosphaeria turcica) isolated from maize have been compared by many researchers [33,37,38,39,40]. In this study, conidia size, radial growth, and pigmentation are the PCA factors that contributed highest for clustering. It was noted that the conidial forms were elongated and spindle-shaped. Cultural traits demonstrated that there were differences in colony development and color among the isolates. Based on the color of the colony, the isolates were divided into three groups: light gray, gray, and dark gray. Based on growth, the isolates were categorized into two groups: those with moderate growth and those with profuse growth. The isolates ET002 and ET003 presented septa with a range of 5–7 to 7–10, respectively. Similarly, isolates ET002 and ET003 had conidial lengths that ranged from 56.7 m to 89.44 µm, related to this study [41]. The variability among isolates of E. turcicum may be due to ability of the pathogen to adapt, with variations developed in particular conditions and due to the long-term influence of the weather in a particular location [42]. Thus, it clearly indicates the existence of different strains/virulence within E. turcicum [43]. Thus, it has been made abundantly evident that there are many strains and levels of variation within E. turcicum [44,45,46]. In general, recombination and mutations are the primary causes of fungal genetic variation [47,48]. Low mutation rates result from the rarity of avirulence to virulence mutations [49]. The variation of the E. turcicum population in the tropics may be the result of sexual recombination as well [50]. Somatic recombination, particularly in temperate locations, may also be a source of genetic variation in E. turcicum populations [47]. Another ascomycete, Magnaporthe grisea, which infects grasses and causes blast disease in rice, has been characterized in the literature as having parasexual characteristics [51]. However, more research is required to establish the existence of parasexuality in E. turcicum and to determine how mixed reproduction contributes to the race variability of this pathogen.
Results from molecular identification indicate that 45 isolates were identified as Setosphaeria turcica-telomorph (E. turcicum—anamorph). A gel documentation system was used to observe representative PCR product bands. Analysis of the β-tubulin gene sequences allowed the identification of different fungal strains. In this study, the β-tubulin genes of all 45 isolates were closely related to the β-tubulin gene sequences of reference isolates from Gen Bank (accession numbers KU670342.1, KU670344.1, KU670343.1, KU670341.1, KU670340.1). Similar findings were reported for Alternaria infectoria, which acted as an outgroup in this study because it belonged to neither of the two clades [41]. Phylogenetic analysis and DNA-based molecular methods have changed how this fungal group is classified, among other things. For example, molecular analysis employing the internal transcribed spacer (ITS) region of nuclear ribosomal DNA has augmented the conventional means of categorization by offering an accurate and quick means of species identification from distinctive hosts [52,53]. Burdon and Silk suggest that mutation and recombination are the primary sources of genetic variation in plant pathogenic fungi [54]. When studying the ecology and biology of fungi, RAPD and SSR markers are useful for determining genetic similarity and identifying variation within and among populations of E. turcicum [11,13]. These mechanisms are supplemented within a species by gene flow across populations as propagules move from one region to another. Gene flow and other evolutionary factors can cause the spread of certain genes or DNA sequences as well as the formation of entire populations in various geographical areas. This variation is supported by pressures of selection and genetic drift, further increasing the evolutionary divergence [55]. In their initial study of the sexual stage of E. turcicum in Thailand, Bunkoed hypothesized that sexual reproduction in Setosphaeria turcica had contributed to genetic variation in the fungal pathogen [56]. This hypothesis was confirmed by earlier research using inter simple sequence repeat markers. Due to host–pathogen interactions and environmental constraints, the cultivation of several maize types may have resulted in greater selection pressure, which in turn improved diversity in the pathogen population structure.

5. Conclusions

At the end of this study, the variability of the E. turcicum pathogen responsible for causing NCLB disease in Bihar was studied; the pathogen was identified as E. turcicum using both morphological and molecular methods. E. turcicum was found to be capable of growing in a wide range of agroclimatic areas of Bihar. Moreover, the 45 isolates were categorized into six groups on the basis of cultural and morphological variability. This pathogen also showed molecular variability among the species of Setosphaeria turcica. However, variation in the β-tubulin gene sequence among the isolates did not show any relationship with the morphological and cultural variations. Therefore, this study will help plant pathologists in the future to understand more about the variability of this pathogen, and might be helpful in understanding this fungus which could help in its control. The present study also compiled both morphological and molecular data of E. turcicum together for the first time. The study will also serve as the baseline for in vitro and in vivo research into NCLB disease of maize in the future.

Supplementary Materials

The following supporting information can be downloaded at: https://www.mdpi.com/2306-5354/9/8/403/s1, Figure S1: Multiple sequence alignment of β-tubulin gene of all 45 E. turcicum isolates using Clustal Omega.

Author Contributions

Conceptualization, M.A.A.; methodology, R.N., T.R., J.K., K.J., N.K. and A.B.; software, M.A.A., R.N. and T.R.; validation, M.A.A.; formal analysis, M.A.A. and R.N.; investigation, M.A.A.; data curation, R.N.; writing—original draft preparation, R.N.; writing—review and editing, M.A.A., R.N., S.S.M., M.A. and J.N.S.; visualization, M.A.A. and T.R.; supervision, M.A.A.; project administration, M.A.A.; funding acquisition, M.A.A. All authors have read and agreed to the published version of the manuscript.

Funding

This research received no external funding.

Institutional Review Board Statement

Not applicable.

Informed Consent Statement

Not applicable.

Data Availability Statement

The original data were available from the corresponding author upon an appropriate request.

Acknowledgments

All authors acknowledge the Directorate of Research, Bihar Agricultural University, Sabour, Bihar for financial support of the research work and also for providing the BAU communication No. 1224/220727.

Conflicts of Interest

The authors declare no conflict of interest.

References

  1. Passerini, G. Cladosporium paeoniae. In Just’s Botanische Jahresberichte; Gebruder Borntraeger: Leipzig, Germany, 1876; Volume 4, p. 235. [Google Scholar]
  2. Butler, E.J. Some diseases of cereals caused by Sclerospora graminicola. In Botanical Survey; Department of Agriculture: New Delhi, India, 1907; Volume 2, pp. 1–24. [Google Scholar]
  3. Blandino, M.; Galeazzi, M.; Savoia, W.; Reyneri, A. Timing of azoxystrobin + propiconazole application on maize to control northern corn leaf blight and maximize grain yield. Field Crop. Res. 2012, 139, 20–29. [Google Scholar] [CrossRef]
  4. Rajeshwar, R.P.; Narayan, R.; Ranga, P.; Sokka, S.R. Cultural and morphological variability among Exserohilum turcicum isolates. Int. J. Sci. Res. Publ. 2014, 3, 54–59. [Google Scholar]
  5. Singh, N.P. Maize in India: Production systems, constraints, and research priorities. Indian Res. J. Ext. Educ. 2005, 42, 821–833. [Google Scholar]
  6. Raymundo, A.D.; Hooker, A.L. Measuring the relationship between northern corn leaf blight and yield losses. Plant Dis. 1981, 65, 325–327. [Google Scholar] [CrossRef]
  7. Tefferi, A.; Bartholmai, B.J.; Witzig, T.E.; Li, C.Y.; Hanson, C.A.; Phyliky, R.L. Heterogeneity and clinical relevance of the intensity of CD20 and immunoglobulin light-chain expression in B-cell chronic lymphocytic leukemia. Am. J. Clin. Pathol. 1996, 106, 457–461. [Google Scholar] [CrossRef]
  8. Bigirwa, G.; Julian, A.M.; Adiala, E. Characterization of ugandian races of Exserohilum turcicum from Maize. Afr. Crop Sci. J. 1993, 1, 69–72. [Google Scholar]
  9. Mathur, K.; Thakur, R.P.; Rao, V.P.; Jadone, K.; Rathore, S.; Velazhahan, R. Pathogenic variability in Exserohilum turcicum and resistance to leaf blight in sorghum. Indian Phytopathol. 2011, 64, 32–36. [Google Scholar]
  10. Boora, K.S.; Frederiksen, R.A.; Magill, C.W. A molecular marker that segregates with sorghum leaf blight resistance in one cross is maternally inherited in another. Mol. Genet. Genom. 2003, 261, 317–322. [Google Scholar] [CrossRef]
  11. Abadi, R.; Perl-Treves, R.; Levy, Y. Molecular variability among Exserohilum turcicum isolates using RAPD (random amplified polymorphic DNA). Can. J. Plant Pathol. 1996, 18, 29–34. [Google Scholar] [CrossRef]
  12. Mathur, K.; Thakur, R.P.; Reddy, B.V.S. Leaf blight. In Screening Techniques for Sorghum Diseases; Information Bulletin No. 76.; Thakur, R.P., Reddy, B.V.S., Mathur, K., Eds.; International Crops Research Institute for the Semi-Arid Tropics: Patancheru, India, 2007; p. 92. [Google Scholar]
  13. Jones, M.J.; Dunkle, L.D. Analysis of Cochliobolus carbonum races by PCR amplification with arbitrary and gene-specific primers. Phytopathology 1993, 83, 366–370. [Google Scholar] [CrossRef]
  14. Khan, M.R.; Anwer, M.A. DNA and some laboratory tests of nematode suppressing efficient soil isolates of Aspergillus niger. Indian Phytopathol. 2008, 61, 212–225. [Google Scholar]
  15. Khan, M.R.; Anwer, M.A. Molecular and biochemical characterization of soil isolates of Aspergillus niger aggregate and an assessment of their antagonism against Rhizoctonia solani. Phytopathol. Mediterr. 2008, 46, 304–315. [Google Scholar]
  16. Navarro, B.L.; Ramos Romero, L.; Kistner, M.B. Assessment of physiological races of Exserohilum turcicum isolates from maize in Argentina and Brazil. Trop. Plant Pathol. 2021, 46, 371–380. [Google Scholar] [CrossRef]
  17. Manamgoda, D.S.; Cai, L.; McKenzie, E.H.C. A phylogenetic and taxonomic re-evaluation of the Bipolaris, Cochliobolus, Curvularia complex. Fungal Divers. 2012, 56, 131–144. [Google Scholar] [CrossRef]
  18. Ferdinandez, H.S.; Manamgoda, D.S.; Udayanga, D.; Deshappriya, N.; Munasinghe, M.L.A.M.S. Morphological and molecular characterization of two graminicolous Exserohilum species associated with cultivated rice and early barnyard grass from Sri Lanka. Ceylon J. Sci. 2020, 49, 381–387. [Google Scholar] [CrossRef]
  19. Tomioka, K.; Asami, H.; Chiba, M. Leaf spot of barnyardgrass caused by Exserohilum oryzicola in Japan and the fungal influence on rice, barley, bread wheat, durum wheat, and soybean. J. Gen. Plant Pathol. 2021, 87, 281–286. [Google Scholar] [CrossRef]
  20. Rasband, W.S. ImageJ OS Version U.S.; version ImageJ bundled with 64-bit Java 1.8.0_172; National Institutes of Health: Bethesda, MD, USA, 2018. Available online: https://imagej.nih.gov/ij/ (accessed on 12 April 2022).
  21. Saghai-Maroof, M.A.; Soliman, K.M.; Jordensen, R.A.; Allard, R.W. Ribosomal DNA spacer-length polymorphism in barley: Mendelian inheritance, chromosomal location, and population dynamics. Proc. Natl. Acad. Sci. USA 1984, 81, 8014–8018. [Google Scholar] [CrossRef]
  22. Dai, Y.; Gan, L.; Lan, C.; Lu, X.; Yang, X.; Gao, Z. Genetic Differentiation and Mixed Reproductive Strategies in the Northern Corn Leaf Blight Pathogen Setosphaeria turcica from Sweet Corn in Fujian Province, China. Front. Microbiol. 2021, 12, 632575. [Google Scholar] [CrossRef]
  23. Singh, P.; Huang, S.Y.; Hernandez, A.G.; Adhikari, P.; Tiffany, M.J.; Mideros, S.X. Genomic regions associated with virulence in Setosphaeria turcica identified by linkage mapping in a biparental population. Fungal Genet. Biol. 2022, 159, 103655. [Google Scholar] [CrossRef]
  24. Kroon, L.P.; Bakker, F.T.; Van den Bosch, G.B.; Bonants, P.J.; Flier, W.G. Phylogenetic analysis of Phytophthora species based on mitochondrial and nuclear DNA sequences. Fungal Genet. Biol. 2004, 41, 766–782. [Google Scholar] [CrossRef]
  25. Snager, F.; Coulson, A.R. A rapid method for determining sequences in DNA by primed synthesis with DNA polymerase. J. Mol. Biol. 1975, 94, 441–448. [Google Scholar] [CrossRef]
  26. Sievers, F.; Higgins, D.G.; Russell, D.J. (Eds.) Multiple Sequence Alignment Methods. In Methods in Molecular Biology; Humana Press: Totowa, NJ, USA, 2014; Volume 1079, pp. 105–116. [Google Scholar] [CrossRef]
  27. Altschul, S.F.; Madden, T.L.; Schaffer, A.A.; Zhang, J.; Zhang, Z.; Miller, W.; Lipman, D.J. Gapped BLAST and PSI-BLAST: A new generation of protein database search programs. Nucleic Acids Res. 1997, 25, 3389–3402. [Google Scholar] [CrossRef] [PubMed]
  28. Tamura, K.; Stecher, G.; Kumar, S. MEGA11: Molecular Evolutionary Genetics Analysis Version 11. Mol. Biol. Evol. 2021, 38, 3022–3027. [Google Scholar] [CrossRef] [PubMed]
  29. Gowda, K.T.P.; Mallikarjuna, N.; Kumar, G.B.S.; Manjunath, B.; Kumar, B.R. Cultural and morphological variation in the isolates of Exserohilum turcicum the incitant of turcicum leaf blight in maize. Environ. Ecol. 2010, 28, 1826–1830. [Google Scholar]
  30. Sivanesan, A. New species of Exserohilum. Trans. Br. Mycol. Soc. 1986, 83, 319–329. [Google Scholar] [CrossRef]
  31. Misra, A.P.; Mishra, P. Variations in four different isolates of Helminthosporiurn turcicum from Sorghum vulgare. Indian Phytopathol. 1971, 24, 514–521. [Google Scholar]
  32. Bergquist, R.R.; Masias, O.R. Physiologic specialization in Trichometasphaeria turcica f. sp. zeae and T. turcica f. sp. sorghi in Hawaii. Phytopathology 1974, 64, 645–649. [Google Scholar] [CrossRef]
  33. Abebe, D.; Singburaudom, N. Morphological, Cultural and Pathogenicity variation of Exserohilum turcicum (Pass.) Leonard and Suggs. Isolates in Maize (Zea Mays L.). Kasetsart J. (Nat. Sci.) 2006, 40, 341–352. [Google Scholar]
  34. Varma, P.K.; Hegde, Y.R.; Kulkarni, S.; Kalappanavar, I.K. Variability in Helminthosporium sativum with respect to morphology and symptomatology. Ann. Biol. 2005, 21, 209–212. [Google Scholar]
  35. Bunker, R.N.; Mathur, K. Pathogenic and morphological variability of Exserohilum turcicum isolates causing leaf blight in sorghum (Sorghum bicolor). Indian J. Agric. Sci. 2010, 80, 888–892. [Google Scholar]
  36. CMI. Trichometaspaeria  turcica. In Descriptions of Pathogenic Fungi and Bacteria; Centre for Agriculture and Bioscience International (CABI): Wallingford, UK, 1971; p. 304. [Google Scholar]
  37. Kimati, H.; Bach, E.E. Morphological and pathogenic comparisons of Exserohilum turcicum isolated from maize, sorghum and jhonsons grass. Summa Phytopathol. 1995, 21, 134–139. [Google Scholar]
  38. Merle, T.J.; Robert, L.A. Reaction of inbred lines of corn to Helminthosporium turcicum pass in different seasons. Agron. J. 1957, 49, 481–483. [Google Scholar]
  39. Jenkins, M.T.; Robert, A.L.; Findely, W.R. Genetic studies of resistance to Helminthosporium turcicum. Agron. J. 1957, 49, 197–201. [Google Scholar] [CrossRef]
  40. Adiopla, E.; Lipps, P.E.; Madden, L.V. Reaction of maize cultivars from Uganda to Exserhilum turcicum. Phytopathology 1993, 83, 217–223. [Google Scholar] [CrossRef]
  41. Kutawa, A.B.; Sijam, K.; Ahmad, K.; Seman, Z.A.; Razak, M.S.F.A.; Abdullah, N. Characterisation and pathological variability of Exserohilum turcicum responsible for causing northern corn leaf blight (NCLB) disease in Malaysia. Malays. J. Microbiol. 2017, 13, 41–49. [Google Scholar]
  42. Kumar, S.; Verma, S. Variability in Plant Pathogens and Tools for its Characterization. Int. J. Curr. Microbiol. Appl. Sci. 2019, 8, 2887–2902. [Google Scholar] [CrossRef]
  43. Rajeshwar, R.T.; Reddy, P.N.; Reddy, R.R. Pathogenic Variability of Isolates of Exserohilum turcicum, Incitant of Leaf Blight of Maize. Indian J. Plant Prot. 2013, 41, 72–75. [Google Scholar]
  44. Robert, A.L.; Sprague, G.F. Adaption of the corn leaf blight fungus to a resistant and susceptible corn host. Phytopathology 1960, 50, 261–263. [Google Scholar]
  45. Sisterna, M.N. Study on the pathogenicity of Exserohilum turcicum in Argentina. Rev. Fac. Agron. Univ. Nac. Plata 1985, 61/62, 169–174. [Google Scholar]
  46. Adipala, E. Reactions of maize genotypes to Exserohilum turcicum in different agro-climatic zones of Uganda. East Afr. Agric. For. J. 1994, 59, 213–218. [Google Scholar] [CrossRef]
  47. Taylor, J.W.; Jacobson, D.J.; Fisher, M.C. The evolution of asexual fungi: Reproduction, speciation and classification. Annu. Rev. Phytopathol. 1999, 37, 197–246. [Google Scholar] [CrossRef] [PubMed]
  48. Taylor, J.W.; Branco, S.; Gao, C.; Hann-Soden, C.; Montoya, L.; Sylvain, I.; Gladieux, P. Sources of fungal genetic variation and associating it with phenotypic diversity. Microbiol. Spectr. 2017, 5, 5. [Google Scholar] [CrossRef] [PubMed]
  49. McDonald, B.A.; Linde, C. Pathogen population genetics, evolutionary potential, and durable resistance. Annu. Rev. Phytopathol. 2002, 40, 349–379. [Google Scholar] [CrossRef] [PubMed]
  50. Borchardt, D.S.; Welz, H.G.; Geiger, H.H. Genetic structure of Setosphaeria turcica populations in tropical and temperate climates. Phytopathology 1998, 88, 322–329. [Google Scholar] [CrossRef]
  51. Zeigler, R.S.; Scott, R.P.; Leung, H. Evidence of parasexual exchange of DNA in the rice blast fungus challenges its exclusive clonality. Phytopathology 1997, 87, 284–294. [Google Scholar] [CrossRef]
  52. Begoude, B.A.; Slippers, B.; Wingfield, M.J.; Roux, J. Botryosphaeriaceae associated with Terminalia catappa in Cameroon, South Africa and Madagascar. Mycol. Prog. 2010, 9, 101–123. [Google Scholar] [CrossRef]
  53. Mohali, S.; Slippers, B.; Wingfield, M.J. Two new Fusicoccum species from Acacia and Eucalyptus in Venezuela based on morphology and DNA sequence data. J. Mycol. Res. 2010, 110, 405–413. [Google Scholar] [CrossRef]
  54. Burdon, J.J.; Silk, J. Sources and patterns of diversity in plant pathogenic fungi. Phytopathology 1997, 87, 664–669. [Google Scholar] [CrossRef]
  55. Zeigler, R.S.; Cuoc, L.X.; Scott, R.P.; Bernado, M.A.; Chen, D.H.; Valent, B.; Nelson, R.J. The relationship between lineage and virulence in Pyricularia grisea in the Philippines. Phytopathology 1995, 85, 443–451. [Google Scholar] [CrossRef]
  56. Bunkoed, W.; Kasam, S.; Chaijuckam, P.; Yhamsoongnern, J.; Prathuangwong, S. Sexual reproduction of Setosphaeria turcica in natural corn fields in Thailand. Agric. Nat. Resour. 2014, 48, 175–182. [Google Scholar]
Figure 1. Cultural and morphological variability of different isolates of E. turcicum on PDA (front view) 10 days after inoculation.
Bioengineering 09 00403 g001
Figure 2. Cultural and morphological variability of different isolates of E. turcicum on PDA (inverted view) 10 days after inoculation.
Bioengineering 09 00403 g002
Figure 3. Conidial variability of different isolates of E. turcicum causing NCLB.
Bioengineering 09 00403 g003aBioengineering 09 00403 g003bBioengineering 09 00403 g003c
Figure 4. Dendrogram on the basis of morphological and cultural variability of 45 E. turcicum isolates causing NCLB disease.
Bioengineering 09 00403 g004
Figure 5. Representative bands of PCR product from β-tubulin gene. Amplification fragment size 1000 base pairs (bp). L = 1kb ladder, 1 = BhEt1, 2 = BhEt2, 3 = BhEt3, 4 = BhEt4, 5 = BhEt5, 6 = BhEt6, 7 = BhEt7, 8 = BhEt8, 9 = BhEt9, 10 = BeEt1, 11 = BeEt2, 12 = BeEt3, 13 = BeEt4, 14 = BeEt5, 15 = BeEt6, 16 = BeEt7, 17 = BeEt8, 18 = BeEt9, 19 = KhEt1, 20 = KhEt2, 21 = KhEt3, 22 = KhEt4, 23 = KhEt5, 24 = KhEt6, 25 = KhEt7, 26 = KhEt8, 27 = KhEt9, 28 = KaEt1, 29 = KaEt2, 30 = KaEt3, 31 = KaEt4, 32 = KaEt5, 33 = KaEt6, 34 = KaEt7, 35 = KaEt8, 36 = KaEt9, 37 = SaEt1, 38 = SaEt2, 39 = SaEt3, 40 = SaEt4, 41 = SaEt5, 42 = SaEt6, 43 = SaEt7, 44 = SaEt8, 45 = SaEt9.
Bioengineering 09 00403 g005
Figure 6. Phylogenetic relationships of 45 E. turcicum isolates compared with accession numbers of other species. Phylogenetic tree inferred by maximum likelihood analysis based on rDNA sequences. Numbers below the branches represent the percentage for each branch in 1000 bootstrap replications.
Bioengineering 09 00403 g006
Figure 7. Consensus sequence (highlighted in black) present in the β-tubulin gene of all 45 E. turcicum isolates with variable regions in brackets (highlighted in red), fetched after multiple sequence alignment using Clustal Omega. Details of alignment are also given in Supplementary Figure S1.
Bioengineering 09 00403 g007
Table 1. Cultural and morphological variability among 45 isolates of E. turcicum causing NCLB disease of maize in Bihar.
IsolatesColonyConidiaSporulation
/Microscopic Field
Conidia/mL
Type Color Radial Growth (mm)Margin Pigmentation Margin ColorColor No. of Septa Length (µm)Width (µm)Shape
BhEt1FlattenedBlackish brown90.0RegularBrownishBrownBrown3–6101.7620Elongated, ellipsoidal, slightly curved fusiform with protruding hilum129.75 × 105
BhEt2FlattenedOlivaceous brown88.1RegularBrownishBrownDark Brown3–972.3515.29Slightly curved189.22 × 105
BhEt3Fluffy Raised cottonyWhitish black67.3RegularGrayish Black Dark Brown3–855.8811.18Elongated, ellipsoidal, obclavate to fusiform, spindle with protruding hilum225.45 × 105
BhEt4FlattenedOlivaceous brown85.4RegularBrownishBrownBrown3–771.7617.06Slightly curved98.12 × 105
BhEt5Raised CottonyWhitish black70.3RegularWhitish BlackWhiteOlivaceous brown3–1012013.53Slightly curved155.55 × 105
BhEt6Raised CottonyWhitish black75.6RegularWhitish BlackWhiteBrown3–7137.6516.47Slightly curved126.8 × 105
BhEt7Raised CottonyWhitish black85.8RegularWhitish BlackWhiteDark Brown3–7121.1815.29Obclavate88.65 × 105
BhEt8Raised CottonyWhitish black77.5RegularWhitish BlackWhiteDark Brown3–8117.6521.18Obclavate166.82 × 105
BhEt9Fluffy Raised cottonyGrayish79.6IrregularGrayish BlackGrayDark Brown2–571.1810Obclavate107.98 × 105
BeEt1Slightly Raised FluffyWhitish black85.8IrregularWhitish BlackBlackOlivaceous brown3–788.2417.65Slightly curved88.85 × 105
BeEt2FlattenedOlivaceous brown88.1RegularBrownishBrownDark brown2–574.7111.76Slightly curved139.65 × 105
BeEt3Slightly Raised FluffyBlackish brown90.0RegularGrayish BlackBrownOlivaceous brown3–9104.7115.29Slightly curved109.53 × 105
BeEt4Slightly Raised FluffyOlivaceous brown89.2RegularBrownishBrownDark brown3–8102.3517.06Obclavate89.44 × 105
BeEt5Slightly Raised FluffyOlivaceous brown64.6IrregularWhitish blackWhiteOlivaceous brown4–10122.3515.29Slightly curved103.23 × 105
BeEt6FlattenedGrayish90.0RegularGrayish BlackGrayBrown3–8105.2910Slightly curved109.88 × 105
BeEt7FlattenedGrayish90.0RegularGrayish BlackGrayDark brown3–11116.4716.47Slightly curved129.55 × 105
BeEt8Slightly Raised FluffyOlivaceous brown87.1IrregularWhitish blackGrayOlivaceous brown3–7120.9420.06Slightly curved98.95 × 105
BeEt9Slightly Raised FluffyGrayish90.0RegularBrownishGrayOlivaceous brown3–10117.6515.88Slightly curved89.65 × 105
KhEt1FlattenedGrayish90.0RegularGrayish BlackGrayBrown3–12120.5921.76Slightly curved129.54 × 105
KhEt2Fluffy Raised CottonyOlivaceous brown90.0RegularBrownishWhiteDark Brown2–9130.5924.12Slightly curved189.48 × 105
KhEt3FlattenedGrayish90.0RegularGrayish BlackGrayDark Brown3–9112.3518.24Slightly curved99.68 × 105
KhEt4Fluffy Raised CottonyGrayish86.4RegularGrayish BlackGrayDark Brown3–1067.0612.94Slightly curved228.86 × 105
KhEt5Slightly Raised FluffyOlivaceous brown75.5IrregularBrownishBrownBrown3–1264.7112.35Slightly curved267.12 × 105
KhEt6Fluffy Raised CottonyWhitish black80.6IrregularWhitish blackBlackBrown3–1069.4111.76Slightly curved207.85 × 105
KhEt7FlattenedOlivaceous brown80.9RegularWhitish blackGrayDark Brown3–7112.9415.29Slightly curved107.89 × 105
KhEt8FlattenedOlivaceous brown90.0RegularBrownishBrownOlivaceous brown3–10121.7620Slightly curved169.78 × 105
KhEt9FlattenedGrayish90.0RegularGrayish blackGrayBrown2–681.1825.29Slightly curved129.75 × 105
KaEt1Slightly Raised FluffyOlivaceous brown80.8RegularBrownishWhiteBrown2–599.4121.76Slightly curved88.45 × 105
KaEt2Slightly Raised FluffyWhitish black65.5IrregularWhitish blackBlackOlivaceous brown3–8116.4720.59Slightly curved103.12 × 105
KaEt3Fluffy Raised CottonyOlivaceous brown85.6RegularBrownishWhiteBrown3–7102.9410.59Slightly curved88.92 × 105
KaEt4Fluffy Raised CottonyGrayish90.0RegularGrayish BlackGrayBrown3–1265.2911.76Obclavate259.6 × 105
KaEt5Fluffy Raised CottonyWhitish black64.7RegularWhitish blackWhiteBrown3–777.0620.59Obclavate203.08 × 105
KaEt6Fluffy Raised CottonyGrayish90.0RegularGrayish BlackGrayDark Brown3–1059.4114.12Obclavate249.72 × 105
KaEt7Fluffy Raised CottonyGrayish86.4RegularGrayish BlackGrayOlivaceous brown2–877.6510Obclavate139.42 × 105
KaEt8Fluffy Raised CottonyOlivaceous brown90.0RegularWhitish blackGrayOlivaceous brown3–610018.82Obclavate159.66 × 105
KaEt9Slightly Raised FluffyOlivaceous brown86.5RegularBrownishBrownOlivaceous brown2–7115.2917.06Obclavate128.96 × 105
SaEt1Fluffy Raised CottonyGrayish90.0RegularGrayish BlackGrayDark Brown3–855.2915.29Obclavate249.88 × 105
SaEt2Fluffy Raised CottonyGrayish90.0RegularGrayish BlackGrayDark Brown3–1287.6513.53Obclavate209.84 × 105
SaEt3FlattenedOlivaceous brown80.1RegularBrownishBrownBrown3–1259.4116.47Slightly curved168.75 × 105
SaEt4Slightly Raised FluffyBlackish brown89.9RegularGrayish BlackBrownBrown3–10144.1225.88Slightly curved139.35 × 105
SaEt5FlattenedBlackish brown90.0RegularGrayish BlackBrownDark Brown3–883.5319.41Obclavate169.76 × 105
SaEt6Fluffy Raised CottonyGrayish90.0RegularGrayish BlackGrayOlivaceous brown2–9102.3511.18Slightly curved229.32 × 105
SaEt7Fluffy Raised CottonyGrayish90.0RegularGrayish BlackGrayDark Brown3–10110.5918.82Slightly curved209.47 × 105
SaEt8FlattenedGrayish89.8RegularGrayish BlackGrayBrown4–981.1815.88Slightly curved269.12 × 105
SaEt9FlattenedOlivaceous brown86.8RegularBrownishBrownBrown3–1052.9411.18Slightly curved159.44 × 105
Publisher’s Note: MDPI stays neutral with regard to jurisdictional claims in published maps and institutional affiliations.

