
New Insight into Taxonomy of European Mountain Pines, Pinus mugo Complex, Based on Complete Chloroplast Genomes Sequencing


1
Department of Genetics, Institute of Experimental Biology, Faculty of Biology, School of Natural Sciences, Adam Mickiewicz University, Poznań, Uniwersytetu Poznańskiego 6, 61-614 Poznań, Poland
2
Institute of Dendrology, Polish Academy of Sciences, Parkowa 5, 62-035 Kórnik, Poland
*
Author to whom correspondence should be addressed.
Plants 2021, 10(7), 1331; https://doi.org/10.3390/plants10071331
Submission received: 3 June 2021
/
Revised: 26 June 2021
/
Accepted: 27 June 2021
/
Published: 29 June 2021
(This article belongs to the Special Issue Plant Evolution, Systematics, and Chloroplast Genome)
Abstract
:The Pinus mugo complex is a large group of closely related mountain pines, which are an important component of the ecosystems of the most important mountain ranges, such as the Alps, Carpathians and Pyrenees. The phylogenetic relationships between taxa in this complex have been under discussion for many years. Despite the use of many different approaches, they still need to be clarified and supplemented with new data, especially those obtained with high-throughput methods. Therefore, in this study, the complete sequences of the chloroplast genomes of the three most recognized members of the Pinus mugo complex, i.e., Pinus mugo, Pinus rotundata and Pinus uncinata, were sequenced and analyzed to gain new insight into their phylogenetic relationships. Comparative analysis of their complete chloroplast genome sequences revealed several mutational hotspots potentially useful for the genetic identification of taxa from the Pinus mugo complex. Phylogenetic inference based on sixteen complete chloroplast genomes of different coniferous representatives showed that pines from the Pinus mugo complex form one distinct monophyletic group. The results obtained in this study provide new and valuable omics data for further research within the European mountain pine complex. They also indicate which regions may be useful in the search for diagnostic DNA markers for the members of Pinus mugo complex and set the baseline in the conservation of genetic resources of its endangered taxa.
1. Introduction
The Pinus mugo complex is a large and polymorphic complex of closely related pines native to the main mountains of Europe, including the Pyrenees, the Alps and the Carpathians [1,2]. Some researchers indicate that in this group there may be even more than a hundred endemic forms classified into various taxonomic ranks, i.e., species, subspecies or varieties [1]. However, among them only three taxa, i.e., Pinus mugo subsp. mugo, Pinus mugo subsp. rotundata and Pinus mugo subsp. uncinata, are more widely known and thoroughly studied. These taxa differ in some phenotypic features, geographical distribution or preferred habitat. Pinus mugo subsp. mugo, also known as Pinus mugo Turra (dwarf mountain pine) or Pinus mugo sensu stricto, is a shrub with long, curved branches, reaching up to 3.5 m in height. The taxa has a wide geographical range, including the Alps, Pyrenees, Carpathians and Balkans [3], but most often occur in the higher parts of the mountains at an altitude of 1600–2200 m.a.s.l. [4]. Pinus mugo subsp. rotundata, identified by some researchers as a synonym for Pinus uliginosa Neumann (peat-bog pine), is usually a tree-shaped form, with a geographical range limited to peat bog areas of Poland, the Czech Republic and Germany [5]. Pinus mugo subsp. uncinata known as Pinus uncinata Rammond (mountain pine) is a tree with a height of 12–20 m, occurring in the Pyrenees and the western Alps, as well as the Central Massif and the Iberian System [1,2].
These three taxa are considered to be independent species or subspecies inside Pinus mugo complex known also Pinus mugo Turra sensu lato [1,2,6]. The International Union for Conservation of Nature (IUCN) has defined the status of Pinus mugo subsp. mugo and Pinus mugo subsp. uncinata as least concern (LC), while Pinus mugo subsp. rotundata is identified as endangered (EN) [7]. However, conservation of these taxa can be difficult for a number of reasons. One of them is the problematic identification and classification of atypical individuals to specific taxa, especially in sympatric populations. In such populations, natural and uncontrolled gene flow is observed, as well as the formation of hybrid individuals with a phenotype intermediate between those of parent taxa [8,9,10,11]. Another serious problem is the functioning of synonyms in the scientific literature, which probably (but not for sure) refer to the same taxon, e.g., Pinus mugo subsp. rotundata also appears in the literature as Pinus uliginosa but can also be understood as Pinus × rhaetica (as a hybrid of Pinus sylvestris × Pinus mugo) [2]. The relations between these synonyms require urgent and detailed analyses, especially since Pinus uliginosa is the most endangered pine in Poland, as the number of individuals is gradually declining [12,13].
Until now, representatives of the Pinus mugo complex have been the subject of many different studies, including needle biometric analyses [14,15,16], characteristics of allozyme variability [17,18], patterns of genetic diversity distribution in the geographical aspect [19,20,21], gene flow and hybridization [22,23,24], molecular cytogenetics or flow cytometric analyses [25,26]. Some of the most important aspects so far undertaken by researchers were also attempts to establish relations between taxa in this complex [27,28] or searching for diagnostic features or additional determinants allowing for their unambiguous and simple differentiation [29,30,31]. However, based on the results obtained so far, it is extremely difficult to draw consistent and unambiguous conclusions, especially far-reaching ones. On the one hand, numerous studies indicate differences in gene expression products such as volatiles [32], essential oils [33] or seed protein patterns [31] between P. mugo, P. uliginosa and P. uncinata. On the other hand, other studies indicate that taxa from the Pinus mugo complex share common chloro- and mitotypes [20,34], have a complex genetic background and are generally characterized by a conservative organization of genomes [25,26].
Despite many studies on P. mugo, P. rotundata and P. uncinata, their origin, species distinctiveness and taxonomic status within the Pinus mugo complex as well as the identification of additional diagnostic determinants for them require further analysis.
The use of complete chloroplast genome sequences obtained by high throughput techniques could greatly help in this regard, by significantly increasing the phylogenetic resolution and providing new insight into the taxonomic relationships within this complex. This approach is particularly recommended in the case of closely related taxa, where the use of whole chloroplast genomes as one super-barcode should bring better resolution effects than the use of one or even several universal or specific DNA barcodes, which may be too little variable in a given group of plants [35]. This approach seems to be particularly relevant in the case of the Pinus mugo complex, where the analysis of several core, supplementary and candidate barcode regions failed to distinguish these taxa at the DNA level [30]. A detailed comparative analysis of the complete sequences of chloroplast genomes was successfully used in the research, among others, in Pseudolarix and Tsuga [36], Corylus [37], Magnolia [38] or Quercus [39] as well as many others plant taxa.
Therefore, the main objectives of our research were: (1) sequencing, analysis and characterization of the entire genomes of P. mugo, P. rotundata and P. uncinata chloroplasts; (2) comparative analysis of the obtained complete chloroplast genome sequences with previously published data for other members of the Pinus genus, especially those for P. sylvestris; (3) identifying and selecting mutation regions (hot spots) in chloroplast genomes potentially useful in identifying Pinus mugo taxa; and (4) performing a phylogenetic inference about the relatedness of three closely related taxa of the Pinus mugo complex based on the complete sequences of the chloroplast genomes as well as selected regions.
Our results gain new insight into the taxonomy of this highly polymorphic group of closely related taxa, significantly increasing phylogenetic resolution and providing new genomic resources for further taxonomic research and as a baseline to take conservation measures for this ecologically important group of European mountain pines.
2. Results and Discussion
2.1. General Features of P. mugo, P. rotundata and P. uncinata Chloroplast Genomes
Chloroplast genomes are typically about 150 kb in length and have a fairly distinctive quadripartite structure consisting of a large single copy (LSC), a small single copy (SSC) regions and two inverted repeats (IR) that separate them. Usually these repeats (IRa and IRb) are about 20-30 kb long, although in the case of the Pinaceae they are extremely reduced-to fragments sometimes even within 400 bp. The number of genes annotated in chloroplast genomes is variable, ranging from 63 to even 209 genes, although usually it does not exceed the range of 110 and 130 [39,40,41].
The length of complete chloroplast genomes of three closely related P. mugo, P. rotundata and P. uncinata analyzed in this study is comparable and amounts to 119,765 bp, 119,759 bp and 119,780 bp, respectively for these taxa (Figure 1 and Table 1). Chloroplast genomes of representatives of the Pinus mugo complex are circular molecules with a typical quadripartite structure consisting of a large single copy (LSC), a small single copy (SSC) and two very short inverted repeated IRs (IRa and IRb). The length of the LSC region ranges from 65,879 bp for P. rotundata to 65,899 bp for P. uncinata and P. mugo while the length of the SSC region ranges from 53,164 bp for P. mugo, 53,168 bp for P. rotundata to 53,169 bp for P. uncinata. The IR regions, on the other hand, are strongly reduced and, in the case of the representatives of the Pinus mugo complex, they are only 365 bp, which is one of the shortest so far described in the Pinaceae family. For comparison, the IR length in Pinus taeda (KC427273) is 485 bp, and for Pinus sylvestris (KR476379), Pinus densiflora (MK285358) or Pinus yunnanensis (MK007968) is exactly 495 bp [42,43]. For other species, differences in IR lengths are also observed, and several studies report that contraction and expansion of IR regions are quite common phenomena in plants [44]. Moreover, it happens that in some species these regions are completely lost [45,46,47]. It is postulated that the contraction and expansion of the IR regions play a major role in evolution and are responsible for altering the length of genomic sequences.
The plastomes of P. mugo, P. rotundata and P. uncinata contain 121 genes, including 115 unique genes (excluding duplicate ones), 73 protein-coding genes, 36 transfer RNA genes, and four ribosomal RNA genes (Figure 1, Table 1). Five genes are duplicated, i.e., psaM (x2), trnH-GUG (x2), trnM-CAU (x3), trnS-GCU (x2) and trnV-GAC (x2). The functional classification of these genes is presented in Supplementary Table S1. The total content of GC is 38.5% and there are no differences in this parameter between the analyzed taxa. Likewise, there are no significant differences in the length of the protein coding sequences (60,339 bp), the total and unique number of genes (121 and 115, respectively) or the number of rRNA and tRNA genes (4 and 36, respectively). Due to the uniform gene number, order and their names, annotated chloroplast genomes of these three taxa from the Pinus mugo complex are presented on one circular map (Figure 1).
Our results obtained in this study are fully consistent with those previously published for other Pinus representatives, i.e., P. sylvestris (KR476379) or P. densiflora (MK285358) [42] in terms of genome size, total coding length, and protein coding length, as well as number of predicted genes or GC content (Table 1). There are only slight differences in genomic features between Pinus taxa and Larix or Abies taxa. They mainly concern the size of the genome and the number of genes. Taxa of the genera Larix and Abies have slightly longer genomes and fewer genes than representatives of the genus Pinus.
2.2. Genome Comparative Analysis and Identification of Divergent Hotspots
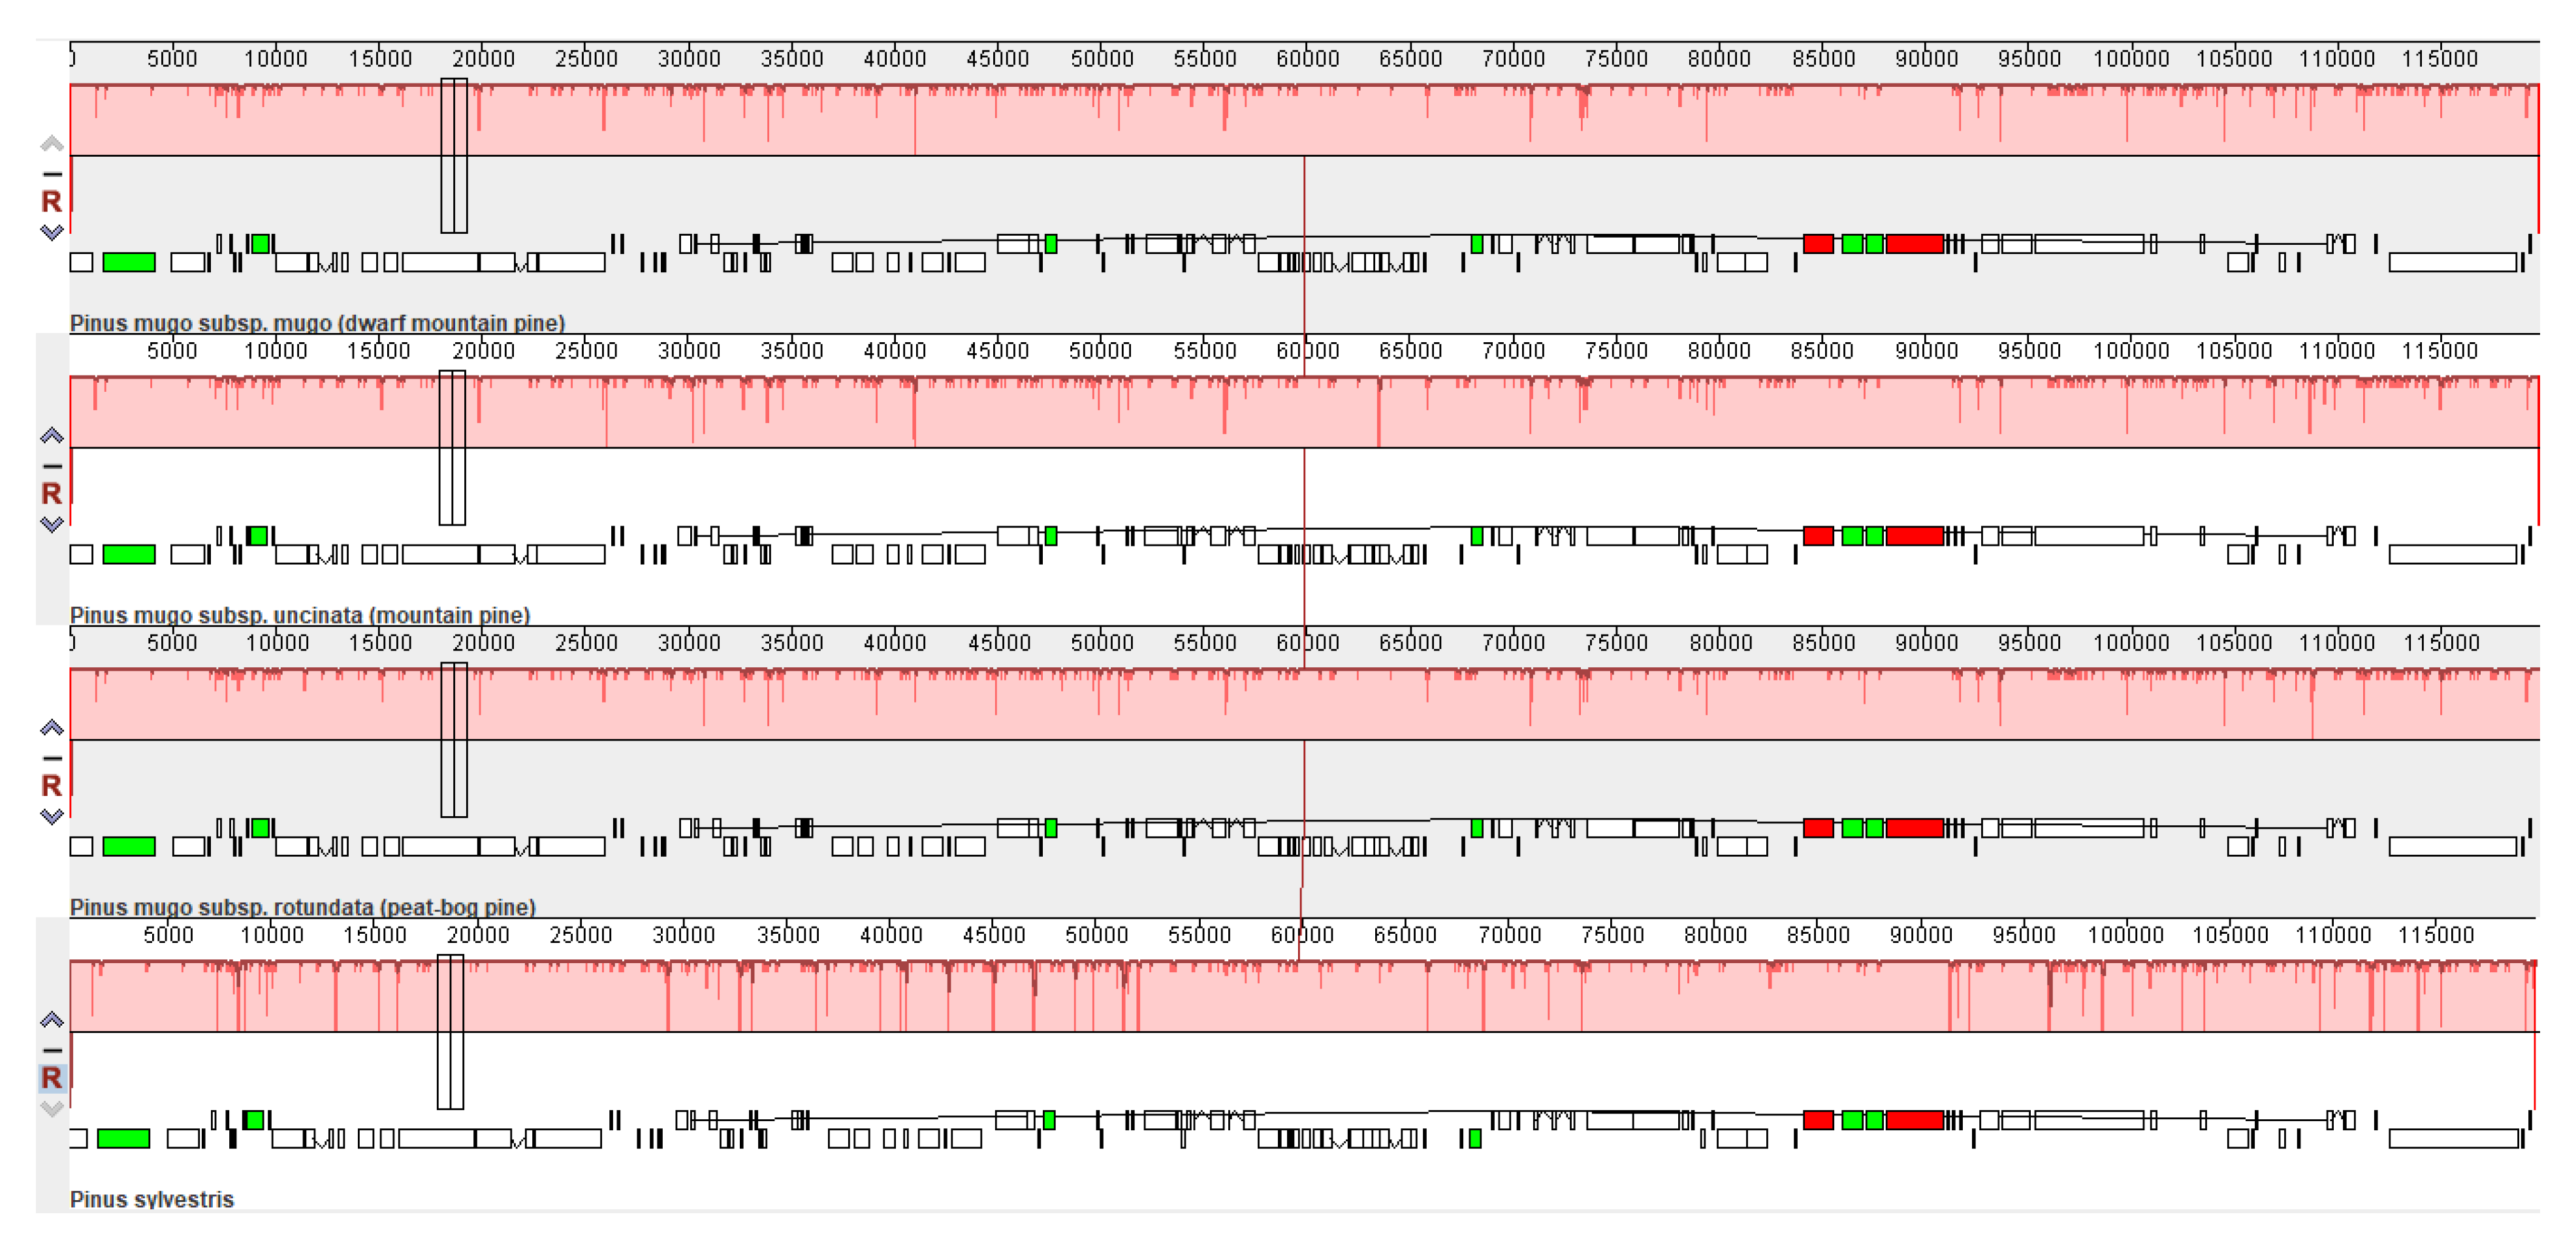
The complete sequences of the P. mugo, P. rotundata and P. uncinata chloroplast genomes were aligned with the complete P. sylvestris chloroplast genome (KR476379) to compare the organization of their genomes (Figure 2). Pinus sylvestris was chosen as the reference taxon closest to this complex but not belonging to it. Figure 2 shows only one locally collinear block (LCB) between all analyzed chloroplast genomes, which suggests a high level of similarity in genome organization between the analyzed Pinus taxa.
In summary, whole-genome alignment of the chloroplast sequences did not reveal any rearrangement or inversion events among Pinus chloroplast genomes, and confirmed the close evolutionary relationships between all analyzed taxa (both those belonging to the Pinus mugo complex and not). Our results are fully consistent with earlier studies on Pinus species [42], in which the gene content and order of the P. densiflora chloroplast genome were similar to four other pines, i.e., P. sylvestris, P. thunbergii, P. tabuliformis and P. taeda [42].
The K2p distance values calculated as an estimator of evolutionary divergence (Table 2) differ between Pinus taxa from 0.000259 in a pair of P. mugo and P. uncinata to 0.00318 in a pair of P. uncinata and P. sylvestris, with an average of 0.001741 for all four analyzed Pinus taxa.
DnaSP was used to perform two sliding window analyses in order to identify mutational regions. One analysis concerned only three taxa from the Pinus mugo complex (Figure 3A), while the other, apart from P. mugo, P. rotundata and P. uncinata, also included P. sylvestris (Figure 3B).
The results in Figure 3A clearly show that for the Pinus mugo complex taxa there were five divergent hotspots with a high Pi value (>0.00238), i.e., trnG, atpI-rps2, trnE-clpP, clpP-rps12, and rrn4.5-rrn5. For the second combination, taxa from the Pinus mugo complex and P. sylvestris, a total of nine unique mutational regions with a high Pi value (>0.00589) were detected, i.e., trnS-psaM, trnE-clpP, psaJ-trnP, psaM-trnS, petB-petD, ycf3-psaA, rrn4.5-rrn5, ycf1 and ycf2 (Figure 3B). The average value of nucleotide diversity (Pi) was 0.00036 and 0.00174 for the Pinus mugo complex taxa and for the Pinus mugo taxa together with P. sylvestris, respectively. This result is in line with expectations because the second combination included more distant pines, not just three closely related taxa. A similar relationship was found also in the case of other species [49].
Pairwise distance analysis for the highly variable regions (Figure 4A,B) showed that the highest K2p distance between taxa from the Pinus mugo complex is between P. mugo and P. rotundata (0.01239) in the trnE-clpP region (Figure 4A). In turn, the highest K2p distance between P. sylvestris and any taxon from the Pinus mugo complex (Figure 4B) is 0.03298 and concerns the trnS-psaM region and the P. sylvestris vs. P. rotundata. Overall, a detailed pairwise distance analysis revealed what values of discrepancy and in which regions of the chloroplast genome sequence can be expected between the analyzed taxa pairs.
Chloroplast DNA regions selected in this study can be preferentially used as specific barcodes for further studies of Pinus mugo taxonomy. A species-specific barcode is defined as a fragment of a DNA sequence with a sufficiently high mutation rate to enable the species to be identified within a given taxonomic group [35]. The ycf1 and ycf2 regions seem of particular interest in this regard for the genus Pinus. Several studies show that the ycf1 region in particular has extremely high discriminatory power in some genera and much greater potential than the commonly used universal core barcodes [30,50,51].
2.3. Simple Sequence Repeats Analysis
Simple sequence repeats (SSRs or microsatellites) are very often used in population, ecological and conservation genetics as effective molecular markers. Their most important advantages are the high level of genetic polymorphism detected by them and wide distribution throughout the genome of chloroplasts, as well as trouble-free amplification, fast electrophoretic separation or objective and simple statistical analysis [52,53,54,55].
In this study, a total of fifty-nine SSRs with a length of at least 10 bp were detected in the chloroplast genomes of three members of the Pinus mugo complex. The number of detected SSR loci ranged slightly from nineteen in P. uncinata to twenty in P. mugo and P. rotundata and was similar to P. sylvestris (22 microsatellites) but much lower than that found recently with another pine, Pinus taeda (151) [56].
Interestingly, the identified differences in the number of SSRs between the four analyzed taxa hypothetically allow these taxa to be distinguished using microsatellite loci. A detailed analysis of the number and distribution of SSRs brings very interesting results. For P. mugo and P. uncinata, we found a microsatellite between 54,429 and 54,438 bp and between 54,428 and 54,437 bp, respectively, which was not observed in the genomes of P. rotundata or P. sylvestris. Similarly, in the case of P. mugo and P. rotundata, we found the presence of a microsatellite repeat between 44,949 and 44,961 bp and 44,940 and 44,954 bp, respectively, which is not present in the chloroplast genome of P. uncinata. A comparison of the 100,883-100,892 bp region in P. rotundata with the 100,844-100,853 region in P. sylvestris reveals that these taxa differ in the repeat motif; P. sylvestris has an A repeat, and P. rotundata has a T repeat. Moreover, to a similar extent, no microsatellite repetitions were found in the other two taxa, i.e., P. mugo and P. uncinata. Most of the SSRs identified in this study (47/59) were located in the intergenic distance region (IGS) (Table 3). The most common microsatellite repeat motif was mononucleotide (84.75%), followed by dinucleotide (10.17%) and compound (5.08%). Our results are fully consistent with the observations from other previously conducted studies in which SSRs in chloroplast genomes have a motif composed mainly of short polyadenine (polyA) or polythymine (polyT) repeats and much less often contain guanidine (G) or cytosine (C) tandem repeats [38,56].
The SSRs identified in this study can be used for further research on the representatives of the Pinus mugo complex, i.e., P. mugo, P. rotundata and P. uncinata, and to characterize their genetic resources. The SSRs described in this study can potentially be used to distinguish taxa in the Pinus mugo complex and also complement other microsatellite loci used so far for this purpose [57,58].
2.4. Phylogenetic Inference
The phylogenesis of many different groups of plants was determined by analyzing the sequences of both the complete genome of chloroplasts and selected regions [59,60,61,62]. In this study, we were particularly interested in the relationships within the Pinus mugo complex between three closely related taxa, as the phylogeny of the genus Pinus is well known. Therefore, phylogenetic trees were constructed using the ML and Bayes algorithms using the nucleotide sequences of the chloroplast genomes of sixteen taxa representing the two main conifer families, Pinaceae and Podocarpaceae (Table 4). We used two datasets. The first involved alignment of entire chloroplast genome sequences, while the second was based on alignment of the highly variable ycf1 gene only. In many previous studies, researchers indicate its very high level of genetic diversity, useful in phylogenic analyses [30,51,63].
As shown in Figure 5, both obtained ML and Bayesian phylogenetic trees clearly indicated that P. mugo, P. rotundata and P. uncinata belonging to the Pinus mugo complex formed a separate cluster within the Pinus genus. Although phylogenetic reconstruction was not the main focus of this work, the overall topology of the trees obtained here (regardless of the data set and analysis methods used) was not surprising, and is consistent with the well-known and widely accepted division of the Pinaceae family into basic genera, i.e., Picea, Larix, Abies and Pinus. Additionally, in the genus Pinus, the analyzed pine taxa formed two separate clades. One clade consisted of Pinus strobus and Pinus cembra belonging to the subgenus Strobus, while the other clade consisted of taxa included in the subgenus Pinus, i.e., Pinus taeda, Pinus pinea, Pinus densiflora, P. sylvestris as well as three closely related taxa from of the Pinus mugo complex; P. mugo, P. rotundata and P. uncinata. It is worth noting that in the ML and BI trees, most of the nodes had 100% bootstrap support and 1.0 Bayesian posterior probability (Figure 5). Podocarpus latifolius from the Podocarpaceae family, as predicted, was outside the main group of taxa from the Pinaceae family.
3. Materials and Methods
3.1. Sampling, DNA Extraction and Genomic Library Preparation
Fresh and healthy needles of the three most recognized members of the Pinus mugo complex were collected as follows: Pinus mugo subsp. uncinata (hereinafter referred to for short as Pinus uncinata) (collection number 1347) from the Dendrological Garden of University of Life Sciences, Poznań, Poland (52°25′37′′ N, 16°53′48′′ E); Pinus mugo subsp. rotundata (hereinafter referred to for short as Pinus rotundata) from the Great Peat Bog of Batorów located in Stołowe Mountains National Park, Poland (50°15′ 42.48′′ N, 16°8′31.92′′ E) and finally Pinus mugo subsp. mugo (hereinafter referred to for short as Pinus mugo) from the Tatra National Park (UNESCO Biosphere Reserve), Poland (49°10′0″ N, 19°55′0″ E). The collected needles were stored at 4 °C, until DNA extraction. Genomic DNA was isolated using the CTAB method [64]. The quality and integrity of isolated DNA were determined using agarose gel electrophoresis and measurement on a NanoDrop spectrophotometer (Thermo Fisher Scientific, Carlsbad, CA, USA). The genomic library was prepared according to the manufacturer’s recommendations with protocol: Ion Xpress™ Plus gDNA Fragment Library Preparation, using Ion Xpress Plus Fragment Library Kit (Pub. No. MAN0009847) (ThermoFisher Scientific, Waltham, MA, USA). The 100 ng of total genomic DNA was fragmented using Ion Shear Plus Reagents with 8 min incubation time at 37 °C, targeting fragments length of 200–300 bp. Then, the fragmented DNA was purified using 1.8× sample volume of Agencourt™ AMPure™ XP Reagent. The fragment size was checked by 2200 Tapestation Bioanalyzer and Agilent™ High Sensitivity DNA Kit (Agilent Technologies, Waldbronn, Germany), according to protocol: Agilent HS D1000 ScreenTape System Quick Guide. For Pinus uncinata, the adapters ligation was conducted for reaction setup for non-barcoded libraries using Ion Plus Fragment Library Kit Adapters. For P. mugo and P. rotundata, the adapters ligation was conducted for reaction setup for barcoded libraries using the Ion Xpress™ Barcode Adapters Kit. AMPure purification was performed after ligation using a 1.2× sample volume of Agencourt™ AMPure™ XP Reagent (ThermoFisher Scientific, Waltham, MA, USA) for 200–300-base-read library size. The size selection procedure was performed on the E-Gel™ SizeSelect™ 2% Agarose Gel, then the libraries were amplified and purified using a 1.2x sample volume of Agencourt™ AMPure™ XP Reagent (ThermoFisher Scientific, Waltham, MA). Quality and length analysis was conducted using 2200 Tapestation Bioanalyzer (Agilent Technologies Waldbronn, Germany). Chloroplast genomes are typically about 150 kb in length and have a fairly distinctive quadripartite
3.2. Next Generation Sequencing
The genomic library was diluted to 100 pM. The concentration was measured on the Qubit™ 2.0 Fluorometer using Qubit™ dsDNA HS Assay Kit (Pub. No. MAN0002326 Revision: B.0) (Life Technologies). The P. uncinata template preparation was performed according to protocol: Ion PGM™ Hi-Q™ View OT2 Kit (Cat. No. A29900, Pub. No. MAN0014580 Rev. C.0). P. mugo and P. rotundata templates preparation were performed according to protocol: Ion 540™ Kit – OT2 (Cat. No A27753 Pub. No. MAN0010852 Rev. E.0). Evaluation of the templated Ion Sphere™ Particles (ISPs) was conducted using Ion Sphere™ Quality Control Kit (Cat.No. 4468656), according to protocol Ion Sphere™ Assay on the Qubit ™ 2.0 Fluorometer (Pub. No. MAN0016387 Revision A.0) (ThermoFisher Scientific, Waltham, MA, USA). P. uncinata genome sequencing was conducted on Ion 318™ Chip v2 BC by Ion Personal Genome Machine™ (PGM™) System (Thermo Fisher Scientific, Waltham, MA, USA) according to manufacturer’s recommendations using protocol: Ion PGM™ Hi-Q™ View Sequencing Kit user guide (Cat. No. A30044, Pub. No. MAN0014583). Then, P. mugo and P. rotundata genome sequencing was conducted on Ion 540™ Chip by GeneStudio™ S5 System (Thermo Fisher Scientific, Waltham, USA) according to manufacturer’s recommendations using protocol: Ion 540™ Kit – OT2 User Guide (Cat. No A27753, Pub. No MAN0010850, Rev. D).
3.3. Chloroplast Genomes Assembly and Gene Annotation
BBDuk Adapter/Quality Trimming V. 35.82 available in Geneious Prime 2020.2.5 [65] was used to filter low quality reads and trim low quality ends and adapters. The filtered reads were de novo assembled into contigs using Geneious Assembler on default options with merging homopolymer variants. Contigs were mapped to the reference genome Pinus sylvestris (NC_035069.1) using Geneious Mapper with minimum mapping quality: 30. Reads, which mapped to the reference genome, were used to assemble de novo the complete chloroplast genome sequences of P. mugo, P. rotundata and P. uncinata. Assembled genomes were initially annotated using CPGAVAS2, an integrated plastome sequence annotator [66], and GeSeq [67] and compared to the Pinus sylvestris (RefSeq: NC_035069.1) reference sequence. Location of large single copy region (LSC) and small single copy region (SSC) as well as calculation of GC content was carried out in Geneious Prime 2020.2.5 [65] by comparison with homologous sequences available to other Pinus representatives. Transfer RNAs were also checked with tRNAscan-RE v2.0.3. [68] incorporated in GeSeq [67] using default settings. OrganellarGenomeDRAW (OGDRAW) version 1.3.1 [69] was used to draw a circular map chloroplast genome of P. mugo, P. rotundata and P. uncinata. The complete sequences of the chloroplast genomes of these three taxa mentioned above have been deposited in GenBank under the following accession numbers: MZ333466 for Pinus mugo subsp. mugo; MZ333465 for Pinus mugo subsp. rotundata and MZ333464 for Pinus mugo subsp. uncinata.
3.4. Genome Comparative Analysis and Identification of Divergent Hotspots
In order to study genome-wide evolutionary dynamics among P. mugo, P. rotundata and P. uncinata from the Pinus mugo complex and to search evolutionary events such as gene loss, duplication, rearrangements and translocations, multiple alignments were made using progressive MAUVE algorithm with default settings via MAUVE [70] plugin v1.1.1 available in Geneious Prime 2020.2.5 [65]. The complete sequences of the P. mugo, P. rotundata and P. uncinata chloroplast genomes were compared with this previously published sequence for Pinus sylvestris (KR476379), which is the nearest taxa to the Pinus mugo complex, but does not belong to it (Table 1). Evolutionary divergence between the three representatives of the Pinus mugo complex and P. sylvestris was estimated by calculating genetic distances using the Kimura 2-parameters (K2p) evolution model [46,71] implemented in MEGA X [48].
Identification of divergent hotspots was performed separately only for the representatives of the Pinus mugo complex and for those representatives and P. sylvestris on the basis of three and four complete sequences of chloroplast genomes, respectively. The relevant chloroplast genomes were aligned using MAFFT v7.450 with default options [72], and then nucleotide diversity (Pi) was calculated through sliding window analysis using DnaSP version 6 [73]. The window length was set to 600 bp, with a step size 200 bp. The diversity thresholds for the Pinus mugo complex (0.00238) and for the Pinus mugo complex and together with P. sylvestris (0.00589) were calculated by sum of the average and double the standard deviation [74]. Regions with levels of nucleotide diversity higher than these thresholds were recommended as highly variable regions. Pairwise distance was also determined for these regions using the Kimura 2-parameters (K2p) evolution model [46,71] implemented in MEGA X [48].
3.5. Identification of Simple Sequence Repeats
Simple sequence repeats (SSRs) in chloroplast genomes of Pinus mugo complex representatives and Pinus sylvestris were detected by MIcroSAtellite (MISA) [75], with the following parameters set at ≥10 for mononucleotides, 6≥ for dinucleotides and ≥5 for tri-, tetra-, penta- and hexanucleotides, respectively.
3.6. Phylogenetic Inference
Phylogenetic inferences were constructed by maximum likelihood (ML) and Bayesian inference (BI) were constructed by maximum likelihood (ML) analysis using sixteen complete sequences of chloroplast genomes of various conifers representatives (including data obtained in this study for P. mugo, P. rotundata and P. uncinata). The list of taxa included in the study, along with GenBank accession numbers, is given in Table 4. In order to better explain the topology of the tree, both closely related taxa from the Pinaceae family, such as Pinus, and more distant taxa from the genus Abies, Larix and Picea, were selected. The outgroup was Podocarpus latifolius from the Podocarpaceae family.
Complete chloroplast genomes were aligned with MAFFT v7.450 using default settings [51]. A General Time Reversible + Gamma nucleotide substitution model (GTR + G) was selected according to Akaike’s information criterion (AIC) [76] with MEGA X [48], as the best substitution model for the ML and BI analyses. The ML analyses were conducted in RaxML v8.2.11 [77], with 1000 rapid bootstrap replicates along with a search for the best-scoring ML tree in every run and parsimony random seed set to 10.
BI analyses were conducted using MrBayes v 3.2.6 [78,79]. The Markov Chain Monte Carlo (MCMC) algorithm was run for 100,000 generations and the trees were sampled every 100 generations. The first 25% of the trees were discarded as a burn-in, and remaining trees were used to generate the consensus tree, including clade posterior probability (PP). Convergence was determined by examining the average standard deviation of the split frequencies (<0.01).
4. Conclusions
In this study, we aimed to increase the phylogenetic resolution within the European mountain pine complex using, for the first time, a detailed comprehensive comparative analysis of the complete chloroplast genome sequences of the three main representatives of this complex, i.e., Pinus mugo, P. rotundata and P. uncinata. The obtained results revealed a high conservation of their chloroplast genomes in terms of length, structure and number of genes. We confirmed very close relationships between these three taxa using inference and phylogenetic trees topology in which P. mugo, P. rotundata and P. uncinata form one distinct clade within the genus Pinus with strong support. Highly variable regions and distinct microsatellite loci patterns have been identified in the genomes of chloroplast members of the Pinus mugo complex that could potentially be used in the future to discriminate and identify these taxa. Our analyses increase the knowledge of the Pinus mugo complex phylogeny and provide a valuable genomic baseline for future research into the evolutionary history and conservation of this highly polymorphic and enigmatic group, as well as the Pinaceae family in general.
Supplementary Materials
The following are available online at https://www.mdpi.com/article/10.3390/plants10071331/s1, Table S1: List of genes annotated in the chloroplast genomes of P. mugo, P. rotundata and P. uncinata sequenced in this study.
Author Contributions
J.S. and K.C. conceived of and designed the research framework; J.S. performed most of the experiments and data analysis; K.C. participated in the data analysis; J.S. and K.C. wrote the original draft manuscript as well as reviewing and editing the final manuscript; J.S. and H.F. assembled and annotated the genome; J.S. and K.C. collected the samples; K.C. supervised the project. All authors have read and agreed to the published version of the manuscript.
Funding
Praca naukowa finansowana ze środków budżetowych na naukę w latach 2018-2020, jako projekt badawczy w ramach programu “Diamentowy Grant” Nr DI2017003147. Research paper financed from the budget for science in 2018-2020, as a research project under the “Diamond Grant” program No. DI2017003147.
Data Availability Statement
Data is contained within the article.
Conflicts of Interest
The authors declare no conflict of interest. The funders had no role in the design of the study; in the collection, analyses, or interpretation of data; in the writing of the manuscript, or in the decision to publish the results.
References
- Christensen, K.L. Taxonomic revision of the Pinus mugo complex and P. rhaetica (P. mugo sylvestris) (Pinaceae). Nord. J. Bot. 1987, 7, 383–408. [Google Scholar] [CrossRef]
- Hamernik, J.; Musil, I. The Pinus mugo complex−its structuring and general overview of the used nomenclature. J. For. Sci. 2008, 53, 253–266. [Google Scholar] [CrossRef] [Green Version]
- Critchfield, W.B.; Little, E.L. Geographic Distribution of the Pines of the World; Departament of Agriculture, Forest Service: Washington, DC, USA, 1966. [CrossRef] [Green Version]
- Ballian, D.; Ravazzi, C.; de Rigo, D.C. Pinus mugo in Europe: Distribution, Habitat, Usage and Threats. In European Atlas of Forest Tree Species; San-Miguel-Ayanz, J., De Rigo, D., Caudullo, G., Houston Durrant, T., Mauri, A., Eds.; Publication Office of the European Union: Luxembourg, 2016; pp. 124–125. [Google Scholar]
- Jalas, J.; Suominen, J. Atlas Florae Europaeae: Distribution of Vascular Plants in Europe. Gymnospermae, Volume 2; The Commitee for Mapping the Flora of Europe and Society Biology Fenn: Helsinki, Finland, 1973; p. 40. [Google Scholar]
- Businský, R.; Kirschner, J. Nomenclatural Notes on the Pinus mugo Complex in Central Europe. Phyt. Ann. Rei Bot. 2006, 46, 129–139. [Google Scholar]
- IUCN. The IUCN Red List of Threatened Species. Version 2020-3. Available online: https://www.iucnredlist.org (accessed on 12 January 2021).
- Lewandowski, A.; Wiśniewska, M. Short Note: Crossability between Pinus Uliginosa and Its Putative Parental Species Pinus sylvestris and Pinus mugo. Silvae Genet. 2006, 55, 52–54. [Google Scholar] [CrossRef] [Green Version]
- Wachowiak, W.; Celiński, K.; Prus-Głowacki, W. Evidence of Natural Reciprocal Hybridisation between Pinus Uliginosa and P. sylvestris in the Sympatric Population of the Species. Flora Morphol. Distrib. Funct. Ecol. Plants 2005, 200, 563–568. [Google Scholar] [CrossRef]
- Wachowiak, W.; Prus-Głowacki, W. Hybridisation Processes in Sympatric Populations of Pines Pinus sylvestris L., P. mugo Turra and P. uliginosa Neumann. Plant Syst. Evol. 2008, 271, 29–40. [Google Scholar] [CrossRef]
- Wachowiak, W.; Żukowska, W.B.; Wójkiewicz, B.; Cavers, S.; Litkowiec, M. Hybridization in Contact Zone between Temperate European Pine Species. Tree Genet. Genomes 2016, 12. [Google Scholar] [CrossRef] [Green Version]
- Danielewicz, W.Z.J. Ochrona Sosny Błotnej Pinus Uliginosa A. Neumann Na Terenie Borów Dolnośląskich. Przegląd Przyr. 2000, 11, 113–124. [Google Scholar]
- Gołąb, Z. Sosna Błotna (Pinus Uliginosa Neumann) Na Wielkim Torfowisku Batorowskim w Górach Stołowych. Szczeliniec 1999, 3, 41–48. [Google Scholar]
- Boratyńska, K.; Boratyński, A. Taxonomic Differences among Closely Related Pines Pinus sylvestris, P. mugo, P. uncinata, P. rotundata and P. uliginosa as Revealed in Needle Sclerenchyma Cells. Flora Morphol. Distrib. Funct. Ecol. Plants 2007, 202, 555–569. [Google Scholar] [CrossRef]
- Boratyńska, K.M. Pinus Uncinata Ramond Taxonomy Basedon Needle Characters. Plant Syst. Evol. 2001, 227, 183–194. [Google Scholar]
- Boratyńska, K.; Boratyński, A.; Lewandowski, A. Morphology of Pinus Uliginosa (Pinaceae) Needles from Populations Exposed to and Isolated from the Direct Influence of Pinus sylvestris. Bot. J. Linn. Soc. 2003, 124, 83–91. [Google Scholar] [CrossRef] [Green Version]
- Siedlewska, A.; Prus-Głowacki, W. Genetic Structure and Taxonomic Position of Pinus Uliginosa Neumann Population from Wielkie Torfowisko Batorowskie in Stołowe Mts. Locus Classicus. Acta Soc. Bot. Pol. 1995, 64, 51–58. [Google Scholar] [CrossRef]
- Lewandowski, A.; Burczyk, J.; Wachowiak, W.; Boratyński, A.; Prus-Głowacki, W. Genetic Evaluation of Seeds of Highly Endangered Pinus Uliginosa Neumann from Wȩgliniec Reserve for Ex-Situ Conservation Program. Acta Soc. Bot. Pol. 2005, 74, 237–242. [Google Scholar] [CrossRef] [Green Version]
- Celiński, K.; Pawlaczyk, E.M.; Wojnicka-Półtorak, A.; Chudzińska, E.; Prus-Głowacki, W. Cross-Species Amplification and Characterization of Microsatellite Loci in Pinus mugo Turra. Biology 2013, 68, 621–626. [Google Scholar] [CrossRef] [Green Version]
- Heuertz, M.; Teufel, J.; González-Martínez, S.C.; Soto, A.; Fady, B.; Alía, R.; Vendramin, G.G. Geography Determines Genetic Relationships between Species of Mountain Pine (Pinus mugo Complex) in Western Europe. J. Biogeogr. 2010, 37, 541–556. [Google Scholar] [CrossRef] [Green Version]
- Celiński, K.; Zbránková, V.; Wojnicka-Półtorak, A.; Chudzińska, E. Biogeography and evolutionary factors determine genetic differentiation of Pinus mugo (Turra) in the Tatra Mountains (Central Europe). J. Mt. Sci. 2015, 12, 549–557. [Google Scholar] [CrossRef]
- Danusevičius, D.; Marozas, V.; Brazaitis, G.; Petrokas, R.; Christensen, K.I. Spontaneous Hybridization between Pinus mugo and Pinus sylvestris at the Lithuanian Seaside: A Morphological Survey. Sci. World J. 2012, 2012, 1–11. [Google Scholar] [CrossRef] [PubMed] [Green Version]
- Kormutak, A.; Demankova, B.; Gömöry, D. Spontaneous Hybridization between Pinus sylvestris L. and P. mugo Turra in Slovakia. Silvae Genet. 2008, 57, 76–82. [Google Scholar] [CrossRef] [Green Version]
- Kormutak, A.; Galgoci, M.; Bolecek, P.; Gőmőry, D.; Libantova, J. Reinforced evidence on partial compatibility between Pinus sylvestris and Pinus mugo and on maternal inheritance of chloroplast DNA in the Pinus mugo × Pinus sylvestris cross. Silvae Genet. 2020, 69, 108–115. [Google Scholar] [CrossRef]
- Bogunić, F.; Siljak-Yakovlev, S.; Muratovic, E.; Pustahija, F.; Medjedović, S. Molecular cytogenetics and flow cytometry reveal conserved genome organization in Pinus mugo and P. uncinata. Ann. For. Sci. 2011, 68, 179–187. [Google Scholar] [CrossRef] [Green Version]
- Celiński, K.; Chudzińska, E.; Gmur, A.; Piosik, Ł.; Wojnicka-Półtorak, A. Cytological characterization of three closely related pines-Pinus mugo, P. uliginosa and P. × rhaetica from the Pinus mugo complex (Pinaceae). Biology 2019, 74, 751–756. [Google Scholar] [CrossRef] [Green Version]
- Lewandowski, A.; Boratyński, A.; Mejnartowicz, L. Allozyme Investigations on the Genetic Differentiation between Closely Related Pines—Pinus sylvestris, P. mugo, P. uncinata, and P. uliginosa (Pinaceae). Plant Syst. Evol. 2000, 221, 15–24. [Google Scholar] [CrossRef]
- Prus-Głowacki, W.; Bujas, E.; Ratyńska, H. Taxonomic Position of Pinus Uliginosa Neumann as Related to Other Taxa of Pinus mugo Complex. Acta Soc. Bot. Pol. 1998, 67, 269–274. [Google Scholar] [CrossRef] [Green Version]
- Celiński, K.; Kijak, H.; Barylski, J.; Grabsztunowicz, M.; Wojnicka-Półtorak, A.; Chudzińska, E. Characterization of the complete chloroplast genome of Pinus uliginosa (Neumann) from the Pinus mugo complex. Conserv. Genet. Resour. 2016, 9, 209–212. [Google Scholar] [CrossRef] [Green Version]
- Celiński, K.; Kijak, H.; Wojnicka-Półtorak, A.; Buczkowska-Chmielewska, K.; Sokołowska, J.; Chudzińska, E. Effectiveness of the DNA barcoding approach for closely related conifers discrimination: A case study of the Pinus mugo complex. Comptes Rendus Biol. 2017, 340, 339–348. [Google Scholar] [CrossRef]
- Celiński, K.; Sokołowska, J.; Zemleduch-Barylska, A.; Kuna, R.; Kijak, H.; Staszak, A.M.; Wojnicka-Półtorak, A.; Chudzińska, E. Seed Total Protein Profiling in Discrimination of Closely Related Pines: Evidence from the Pinus mugo Complex. Plants 2020, 9, 872. [Google Scholar] [CrossRef]
- Celiński, K.; Bonikowski, R.; Wojnicka-Półtorak, A.; Chudzińska, E.; Maliński, T. Volatiles as Chemosystematic Markers for Distinguishing Closely Related Species within the Pinus mugo Complex. Chem. Biodivers. 2015, 12, 1208–1213. [Google Scholar] [CrossRef]
- Bonikowski, R.; Celinski, K.; Wojnicka-Półtorak, A.; Maliński, T. Composition of Essential Oils Isolated from the Needles of Pinus uncinata and P. uliginosa Grown in Poland. Nat. Prod. Commun. 2015, 10, 371–373. [Google Scholar] [CrossRef] [Green Version]
- Cavers, S.; Wachowiak, W.; Boratyńska, K. Geographical Patterns of Nucleotide Diversity and Population Differentiation in Three Closely Related European Pine Species in the Pinus mugo Complex. Bot. J. Linn. Soc. 2013, 172, 225–238. [Google Scholar]
- Li, X.; Yang, Y.; Henry, R.; Rossetto, M.; Wang, Y.; Chen, S. Plant DNA barcoding: From gene to genome. Biol. Rev. 2015, 90, 157–166. [Google Scholar] [CrossRef] [PubMed]
- Sudianto, E.; Wu, C.-S.; Lin, C.-P.; Chaw, S.-M. Revisiting the Plastid Phylogenomics of Pinaceae with Two Complete Plastomes of Pseudolarix and Tsuga. Genome Biol. Evol. 2016, 8, 1804–1811. [Google Scholar] [CrossRef] [Green Version]
- Yang, Z.; Zhao, T.; Ma, Q.; Liang, L.; Wang, G. Comparative Genomics and Phylogenetic Analysis Revealed the Chloroplast Genome Variation and Interspecific Relationships of Corylus (Betulaceae) Species. Front. Plant Sci. 2018, 9, 927. [Google Scholar] [CrossRef] [PubMed]
- Li, Y.; Sylvester, S.P.; Li, M.; Zhang, C.; Li, X.; Duan, Y.; Wang, X. The Complete Plastid Genome of Magnolia zenii and Genetic Comparison to Magnoliaceae species. Molecules 2019, 24, 261. [Google Scholar] [CrossRef] [PubMed] [Green Version]
- Li, X.; Li, Y.; Zang, M.; Li, M.; Fang, Y. Complete Chloroplast Genome Sequence and Phylogenetic Analysis of Quercus acutissima. Int. J. Mol. Sci. 2018, 19, 2443. [Google Scholar] [CrossRef] [Green Version]
- Jansen, R.K.; Ruhlman, T.A. Plastid Genomes of Seed Plants. In Genomics of Chloroplasts and Mitochondria. Advances in Photosynthesis and Respiration (Including Bioenergy and Related Processes); Bock, R., Knoop, V., Eds.; Springer: Dordrecht, The Netherlands, 2012; Volume 35, pp. 103–126. [Google Scholar]
- Lin, M.; Qi, X.; Chen, J.; Sun, L.; Zhong, Y.; Fang, J.; Hu, C. The complete chloroplast genome sequence of Actinidia arguta using the PacBio RS II platform. PLoS ONE 2018, 13, e0197393. [Google Scholar] [CrossRef] [PubMed]
- Kang, H.-I.; Lee, H.O.; Lee, I.H.; Kim, I.S.; Lee, S.-W.; Yang, T.J.; Shim, D. Complete Chloroplast Genome of Pinus densiflora Siebold & Zucc. and Comparative Analysis with Five Pine Trees. Forests 2019, 10, 600. [Google Scholar] [CrossRef] [Green Version]
- Qiu, J.; Chen, L.; Yi, X.; Li, M. The complete chloroplast genome of Pinus yunnanensis Franchet (Pinaceae). Mitochondrial DNA Part B 2019, 4, 2600–2601. [Google Scholar] [CrossRef]
- Kim, K.-J. Complete Chloroplast Genome Sequences from Korean Ginseng (Panax schinseng Nees) and Comparative Analysis of Sequence Evolution among 17 Vascular Plants. DNA Res. 2004, 11, 247–261. [Google Scholar] [CrossRef]
- Perry, A.; Wolfe, K.H. Nucleotide Substitution Rates in Legume Chloroplast DNA Depend on the Presence of the Inverted Repeat. J. Mol. Evol. 2002, 55, 501–508. [Google Scholar] [CrossRef] [PubMed]
- Jiang, M.; Chen, H.; He, S.; Wang, L.; Chen, A.J.; Liu, C. Sequencing, Characterization, and Comparative Analyses of the Plastome of Caragana rosea var. rosea. Int. J. Mol. Sci. 2018, 19, 1419. [Google Scholar] [CrossRef] [Green Version]
- Yi, X.; Gao, L.; Wang, B.; Su, Y.-J.; Wang, T. The Complete Chloroplast Genome Sequence of Cephalotaxus oliveri (Cephalotaxaceae): Evolutionary Comparison of Cephalotaxus Chloroplast DNAs and Insights into the Loss of Inverted Repeat Copies in Gymnosperms. Genome Biol. Evol. 2013, 5, 688–698. [Google Scholar] [CrossRef] [Green Version]
- Kumar, S.; Stecher, G.; Li, M.; Knyaz, C.; Tamura, K. MEGA X: Molecular evolutionary genetics analysis across computing platforms. Mol. Biol. Evol. 2018, 35, 1547–1549. [Google Scholar] [CrossRef]
- Celiński, K.; Kijak, H.; Wiland-Szymańska, J. Complete Chloroplast Genome Sequence and Phylogenetic Inference of the Canary Islands Dragon Tree (Dracaena draco L.). Forests 2020, 11, 309. [Google Scholar] [CrossRef] [Green Version]
- Dong, W.; Xu, C.; Li, C.; Sun, J.; Zuo, Y.; Shi, S.; Cheng, T.; Guo, J.; Zhou, S. ycf1, the most promising plastid DNA barcode of land plants. Sci. Rep. 2015, 5, 8348. [Google Scholar] [CrossRef] [Green Version]
- Olsson, S.; Grivet, D.; Cid-Vian, J. Species-diagnostic markers in the genus Pinus: Evaluation of the chloroplast regions matK and ycf. For. Syst. 2018, 27, e016. [Google Scholar] [CrossRef] [Green Version]
- Ellegren, H. Microsatellites: Simple sequences with complex evolution. Nat. Rev. Genet. 2004, 5, 435–445. [Google Scholar] [CrossRef] [PubMed]
- Urbaniak, L.; Wojnicka-Półtorak, A.; Celinski, K.; Lesiczka, P.; Pawlaczyk, E.; Aučina, A. Genetic resources of relict populations of Pinus sylvestris (L.) in Western Carpathians assessed by chloroplast microsatellites. Biologia 2019, 74, 1077–1086. [Google Scholar] [CrossRef] [Green Version]
- Oliveira, E.; Pádua, J.G.; Zucchi, M.I.; Vencovsky, R.; Vieira, M.L.C. Origin, evolution and genome distribution of microsatellites. Genet. Mol. Biol. 2006, 29, 294–307. [Google Scholar] [CrossRef]
- Gómez, A.; González-Martínez, S.C.; Collada, C.; Climent, J.; Gil, L. Complex population genetic structure in the endemic Canary Island pine revealed using chloroplast microsatellite markers. Theor. Appl. Genet. 2003, 107, 1123–1131. [Google Scholar] [CrossRef] [PubMed]
- Asaf, S.; Khan, A.L.; Khan, M.A.; Shahzad, R.; Lubna; Kang, S.M.; Al-Harrasi, A.; Al-Rawahi, A.; Lee, I.-J. Complete chloroplast genome sequence and comparative analysis of loblolly pine (Pinus taeda L.) with related species. PLoS ONE 2018, 13, e0192966. [Google Scholar] [CrossRef] [Green Version]
- Dzialuk, A.; Boratyńska, K.; Romo, A.; Boratynski, A. Taxonomic and geographic variation of the Pinus mugo complex on chloroplast microsatellite markers. Syst. Biodivers. 2016, 15, 464–479. [Google Scholar] [CrossRef] [Green Version]
- Dzialuk, A.; Muchewicz, E.; Boratyński, A.; Montserrat, J.M.; Boratyńska, K.; Burczyk, J. Genetic variation of Pinus uncinata (Pinaceae) in the Pyrenees determined with cpSSR markers. Plant Syst. Evol. 2009, 277, 197–205. [Google Scholar] [CrossRef]
- Li, D.-M.; Zhao, C.-Y.; Liu, X.-F. Complete Chloroplast Genome Sequences of Kaempferia Galanga and Kaempferia Elegans: Molecular Structures and Comparative Analysis. Molecules 2019, 24, 474. [Google Scholar] [CrossRef] [PubMed] [Green Version]
- Vu, H.-T.; Tran, N.; Nguyen, T.-D.; Vu, Q.-L.; Bui, M.-H.; Le, M.-T.; Le, L. Complete Chloroplast Genome of Paphiopedilum delenatii and Phylogenetic Relationships among Orchidaceae. Plants 2020, 9, 61. [Google Scholar] [CrossRef] [PubMed] [Green Version]
- Zhang, Z.; Zhang, Y.; Song, M.; Guan, Y.; Ma, X. Species Identification of Dracaena Using the Complete Chloroplast Genome as a Super-Barcode. Front. Pharmacol. 2019, 10, 1441. [Google Scholar] [CrossRef]
- Ge, J.; Cai, L.; Bi, G.-Q.; Chen, G.; Sun, W. Characterization of the Complete Chloroplast Genomes of Buddleja colvilei and B. sessilifolia: Implications for the Taxonomy of Buddleja L. Molecules 2018, 23, 1248. [Google Scholar] [CrossRef] [Green Version]
- Hernández-León, S.; Gernandt, D.S.; De La Rosa, J.A.P.; Barbolla, L.J. Phylogenetic Relationships and Species Delimitation in Pinus Section Trifoliae Inferrred from Plastid DNA. PLoS ONE 2013, 8, e70501. [Google Scholar] [CrossRef]
- Doyle, J.J.; Doyle, J.L. Isolation of Plants DNA from Fresh Tissue. Focus 1990, 12, 13–15. [Google Scholar]
- Kearse, M.; Moir, R.; Wilson, A.; Stones-Havas, S.; Cheung, M.; Sturrock, S.; Buxton, S.; Cooper, A.; Markowitz, S.; Duran, C.; et al. Geneious Basic: An integrated and extendable desktop software platform for the organization and analysis of sequence data. Bioinformatics 2012, 28, 1647–1649. [Google Scholar] [CrossRef] [PubMed]
- Shi, L.; Chen, H.; Jiang, M.; Wang, L.; Wu, X.; Huang, L.; Liu, C. CPGAVAS2, an integrated plastome sequence annotator and analyzer. Nucleic Acids Res. 2019, 47, W65–W73. [Google Scholar] [CrossRef] [PubMed]
- Tillich, M.; Lehwark, P.; Pellizzer, T.; Ulbricht-Jones, E.S.; Fischer, A.; Bock, R.; Greiner, S. GeSeq–versatile and accurate annotation of organelle genomes. Nucleic Acids Res. 2017, 45, W6–W11. [Google Scholar] [CrossRef]
- Chan, P.P.; Lowe, T.M. tRNAscan-SE: Searching for tRNA Genes in Genomic Sequences. Methods Mol. Biol. 2019, 1962, 1–14. [Google Scholar] [CrossRef]
- Greiner, S.; Lehwark, P.; Bock, R. OrganellarGenomeDRAW (OGDRAW) version 1.3.1: Expanded toolkit for the graphical visualization of organellar genomes. Nucleic Acids Res. 2019, 47, W59–W64. [Google Scholar] [CrossRef] [Green Version]
- Darling, A.E.; Mau, B.; Perna, N.T. progressiveMauve: Multiple Genome Alignment with Gene Gain, Loss and Rearrangement. PLoS ONE 2010, 5, e11147. [Google Scholar] [CrossRef] [Green Version]
- Kimura, M. A simple method for estimating evolutionary rates of base substitutions through comparative studies of nucleotide sequences. J. Mol. Evol. 1980, 16, 111–120. [Google Scholar] [CrossRef] [PubMed]
- Katoh, K.; Standley, D.M. MAFFT Multiple Sequence Alignment Software Version 7: Improvements in Performance and Usability. Mol. Biol. Evol. 2013, 30, 772–780. [Google Scholar] [CrossRef] [Green Version]
- Rozas, J.; Ferrer-Mata, A.; Sánchez-DelBarrio, J.C.; Guirao-Rico, S.; Librado, P.; Ramos-Onsins, S.; Sánchez-Gracia, A. DnaSP 6: DNA Sequence Polymorphism Analysis of Large Data Sets. Mol. Biol. Evol. 2017, 34, 3299–3302. [Google Scholar] [CrossRef]
- Bi, Y.; Zhang, M.-F.; Xue, J.; Dong, R.; Du, Y.-P.; Zhang, X.-H. Chloroplast genomic resources for phylogeny and DNA barcoding: A case study on Fritillaria. Sci. Rep. 2018, 8, 1–12. [Google Scholar] [CrossRef] [PubMed] [Green Version]
- Beier, S.; Thiel, T.; Münch, T.; Scholz, U.; Mascher, M. MISA-web: A web server for microsatellite prediction. Bioinformatics 2017, 33, 2583–2585. [Google Scholar] [CrossRef] [Green Version]
- Akaike, H. A new look at the statistical model identification. IEEE Trans. Autom. Control. 1974, 19, 716–723. [Google Scholar] [CrossRef]
- Stamatakis, A. RAxML version 8: A tool for phylogenetic analysis and post-analysis of large phylogenies. Bioinformatics 2014, 30, 1312–1313. [Google Scholar] [CrossRef]
- Huelsenbeck, J.P.; Ronquist, F. MRBAYES: Bayesian inference of phylogenetic trees. Bioinformatics 2001, 17, 754–755. [Google Scholar] [CrossRef] [PubMed] [Green Version]
- Ronquist, F.; Huelsenbeck, J.P. MrBayes 3: Bayesian phylogenetic inference under mixed models. Bioinformatics 2003, 19, 1572–1574. [Google Scholar] [CrossRef] [PubMed] [Green Version]
Figure 1.
Gene maps of the three Pinus chloroplast genomes. The genes inside the circle are transcribed clockwise, and those outside are transcribed counterclockwise. Genes of different functions are color coded. The darker gray in the inner circle shows the GC content, while the lighter gray shows the AT content. IRA, IRB, inverted repeats; LSC, large single copy region; SSC, small single copy region.

Figure 2.
MAUVE alignment of three Pinus mugo complex representatives; P. mugo subsp. mugo, P. mugo subsp. uncinata, P. mugo subsp. rotundata. The Pinus sylvestris chloroplast genome is shown at bottom as a reference. Within each of the alignments, local collinear blocks are represented by blocks of the same color connected by lines.

Figure 3.
Sliding window analysis of the whole chloroplast genomes. Window length: 600 bp; step size: 200 bp. X-axis: position of the midpoint of a window. Y-axis: nucleotide diversity of each window. (A) Pi between three the Pinus mugo complex representatives. (B) Pi among the Pinus mugo complex representatives and Pinus sylvestris. The horizontal line on the graph sets the threshold separately for the Pinus mugo complex representatives (0.00238) and separately for the Pinus mugo complex representatives and Pinus sylvestris (0.00589).

Figure 4.
K2p distance for selected hotspot regions separately for the Pinus mugo complex representatives (A) and taxa for the Pinus mugo complex and P. sylvestris (B). Abbreviations: M, Pinus mugo; R, Pinus rotundata; U, Pinus uncinata; S, Pinus sylvestris.
Figure 4.
K2p distance for selected hotspot regions separately for the Pinus mugo complex representatives (A) and taxa for the Pinus mugo complex and P. sylvestris (B). Abbreviations: M, Pinus mugo; R, Pinus rotundata; U, Pinus uncinata; S, Pinus sylvestris.

Figure 5.
Phylogenetic relationships between sixteen conifers taxa based on complete sequences of chloroplast genomes (A,B) inferred from ML and BI analyses, respectively, and only on ycf1 (C,D) also inferred from ML and BI analyses, respectively.
Figure 5.
Phylogenetic relationships between sixteen conifers taxa based on complete sequences of chloroplast genomes (A,B) inferred from ML and BI analyses, respectively, and only on ycf1 (C,D) also inferred from ML and BI analyses, respectively.


Table 1.
Basic features of chloroplast genomes among the seven taxa of Pinaceae.
| Genome Features | Pinus mugo | Pinus rotundata | Pinus uncinata | Pinus sylvestris | Pinus densiflora | Larix decidua | Abies alba |
|---|---|---|---|---|---|---|---|
| Genome size (bp) | 119,765 | 119,759 | 119,780 | 119,758 | 119,875 | 122,747 | 121,243 |
| Total coding length (bp) | 67,592 | 67,593 | 67,592 | 67,625 | 67,684 | 68,621 | 67,983 |
| Protein coding length (bp) | 60,339 | 60,339 | 60,339 | 60,384 | 60,444 | 61,524 | 60,810 |
| rRNA coding length (bp) | 4517 | 4518 | 4518 | 4518 | 4518 | 4520 | 4522 |
| tRNA coding length (bp) | 2736 | 2736 | 2735 | 2654 | 2723 | 2577 | 2651 |
| Total GC content (%) | 38.5 | 38.5 | 38.5 | 38.5 | 38.5 | 38.8 | 38.3 |
| Total number of genes | 121 | 121 | 121 | 116 | 118 | 110 | 113 |
| Number of protein-coding genes | 73 | 73 | 73 | 73 | 73 | 72 | 74 |
| Number of rRNA genes | 4 | 4 | 4 | 4 | 4 | 4 | 4 |
| Number of tRNA genes | 36 | 36 | 36 | 35 | 36 | 34 | 35 |
| GenBank Acc. No. | MZ333466 | MZ333465 | MZ333464 | KR476379 | MK285358 | AB501189 | NC_042410 |
Table 2.
Estimates of evolutionary divergence between four Pinus species. The number of base differences per site from between sequences are shown. Standard error estimate(s) are shown above the diagonal and were obtained by a bootstrap procedure (1000 replicates). This analysis involved four nucleotide sequences. All ambiguous positions were removed for each sequence pair (pairwise deletion option). There were a total of 120279 positions in the final dataset. Evolutionary analyses were conducted in MEGA X [48].
| P. mugo | P. rotundata | P. uncinata | P. sylvestris | |
|---|---|---|---|---|
| P. mugo | - | 0.000044 | 0.000055 | 0.000158 |
| P. rotundata | 0.000259 | - | 0.000061 | 0.000158 |
| P. uncinata | 0.000351 | 0.000409 | - | 0.000158 |
| P. sylvestris | 0.003117 | 0.003126 | 0.003184 | - |
Table 3.
Estimates Simple sequence repeats (SSRs) identified in the P. mugo, P. rotundata, P. uncinata and P. sylvestris chloroplast genomes.
Table 3.
Estimates Simple sequence repeats (SSRs) identified in the P. mugo, P. rotundata, P. uncinata and P. sylvestris chloroplast genomes.
| Taxon | ID | Type | Repeat Motif | Length (bp) | Start | End | Location | ID | Type | Repeat Motif | Length (bp) | Start | End | Location |
|---|---|---|---|---|---|---|---|---|---|---|---|---|---|---|
| P. mugo | 1 | p1 | (C)12 | 12 | 15142 | 15153 | IGS | 11 | p1 | (A)11 | 11 | 79749 | 79759 | IGS |
| 2 | p1 | (A)12 | 12 | 26050 | 26061 | IGS | 12 | p1 | (T)10 | 10 | 87077 | 87086 | IGS | |
| 3 | c | (A)10(G)10 | 20 | 30198 | 30217 | IGS | 13 | p1 | (A)10 | 10 | 100605 | 100614 | IGS | |
| 4 | p1 | (T)23 | 23 | 40994 | 41016 | IGS | 14 | p1 | (T)10 | 10 | 103575 | 103584 | IGS | |
| 5 | p1 | (T)13 | 13 | 44949 | 44961 | IGS | 15 | p1 | (G)11 | 11 | 104142 | 104152 | CDS (ndhD) | |
| 6 | p1 | (T)10 | 10 | 48132 | 48141 | IGS | 16 | p1 | (A)13 | 13 | 106928 | 106940 | IGS | |
| 7 | p1 | (A)10 | 10 | 54429 | 54438 | IGS | 17 | p1 | (T)11 | 11 | 107335 | 107345 | CDS (rpl32) | |
| 8 | p1 | (A)10 | 10 | 67826 | 67835 | IGS | 18 | p1 | (A)10 | 10 | 109379 | 109388 | IGS | |
| 9 | p1 | (T)11 | 11 | 71751 | 71761 | CDS (ycf3) | 19 | p1 | (A)10 | 10 | 109840 | 109849 | CDS (rps12) | |
| 10 | p2 | (AT)6 | 12 | 73254 | 73265 | IGS | 20 | p2 | (AT)6 | 12 | 111752 | 111763 | IGS | |
| 1 | p1 | (C)13 | 13 | 15141 | 15153 | IGS | 11 | p1 | (T)11 | 11 | 87069 | 87079 | IGS | |
| 2 | p1 | (A)12 | 12 | 26050 | 26061 | IGS | 12 | p1 | (A)10 | 10 | 100597 | 100606 | IGS | |
| P. rotundata | 3 | c | (A)11(G)10 | 21 | 30197 | 30217 | IGS | 13 | p1 | (T)10 | 10 | 100883 | 100892 | IGS |
| 4 | p1 | (T)15 | 15 | 40993 | 41007 | IGS | 14 | p1 | (T)10 | 10 | 103568 | 103577 | IGS | |
| 5 | p1 | (T)15 | 15 | 44940 | 44954 | IGS | 15 | p1 | (G)10 | 10 | 104135 | 104144 | CDS (ndhD) | |
| 6 | p1 | (T)11 | 11 | 48122 | 48132 | IGS | 16 | p1 | (A)13 | 13 | 106920 | 106932 | IGS | |
| 7 | p1 | (A)10 | 10 | 67816 | 67825 | IGS | 17 | p1 | (T)11 | 11 | 107327 | 107337 | CDS (rpl32) | |
| 8 | p1 | (T)12 | 12 | 71741 | 71752 | CDS (ycf3) | 18 | p1 | (A)10 | 10 | 109375 | 109384 | IGS | |
| 9 | p2 | (AT)6 | 12 | 73245 | 73256 | IGS | 19 | p1 | (A)10 | 10 | 109836 | 109845 | CDS (rps12) | |
| 10 | p1 | (A)11 | 11 | 79740 | 79750 | IGS | 20 | p2 | (AT)6 | 12 | 111746 | 111757 | IGS | |
| 1 | p1 | (C)13 | 13 | 15142 | 15154 | IGS | 11 | p1 | (T)11 | 11 | 87091 | 87101 | IGS | |
| 2 | p1 | (A)15 | 15 | 26051 | 26065 | IGS | 12 | p1 | (A)10 | 10 | 100620 | 100629 | IGS | |
| 3 | c | (A)11(G)10 | 21 | 30203 | 30223 | IGS | 13 | p1 | (T)10 | 10 | 103590 | 103599 | IGS | |
| 4 | p1 | (T)23 | 23 | 40998 | 41020 | IGS | 14 | p1 | (G)10 | 10 | 104157 | 104166 | CDS (ndhD) | |
| P. uncinata | 5 | p1 | (T)11 | 11 | 48131 | 48141 | IGS | 15 | p1 | (A)13 | 13 | 106942 | 106954 | IGS |
| 6 | p1 | (A)10 | 10 | 54428 | 54437 | IGS | 16 | p1 | (T)11 | 11 | 107349 | 107359 | CDS (rpl32) | |
| 7 | p1 | (A)10 | 10 | 67836 | 67845 | IGS | 17 | p1 | (A)11 | 11 | 109393 | 109403 | IGS | |
| 8 | p1 | (T)13 | 13 | 71760 | 71772 | CDS (ycf3) | 18 | p1 | (A)11 | 11 | 109855 | 109865 | CDS (rps12) | |
| 9 | p2 | (AT)6 | 12 | 73265 | 73276 | IGS | 19 | p2 | (AT)6 | 12 | 111767 | 111778 | IGS | |
| 10 | p1 | (A)12 | 12 | 79761 | 79772 | IGS | ||||||||
| 1 | p1 | (T)11 | 11 | 1376 | 1386 | IGS | 12 | p1 | (A)10 | 10 | 79947 | 79956 | IGS | |
| 2 | p1 | (A)10 | 10 | 9837 | 9846 | IGS | 13 | p1 | (T)10 | 10 | 87277 | 87286 | IGS | |
| 3 | c | (C)10(T)11 | 21 | 15195 | 15215 | IGS | 14 | p1 | (A)10 | 10 | 100844 | 100853 | IGS | |
| 4 | p1 | (A)12 | 12 | 26112 | 26123 | IGS | 15 | p1 | (T)11 | 11 | 101130 | 101140 | IGS | |
| P. sylvestris | 5 | c | (A)11(G)10 | 21 | 30269 | 30289 | IGS | 16 | p1 | (T)10 | 10 | 101833 | 101842 | CDS (ndhH) |
| 6 | p1 | (T)11 | 11 | 41059 | 41069 | IGS | 17 | p1 | (T)10 | 10 | 102658 | 102667 | IGS | |
| 7 | p1 | (T)19 | 19 | 45043 | 45061 | IGS | 18 | p1 | (G)11 | 11 | 104388 | 104398 | CDS (ndhD) | |
| 8 | p1 | (A)12 | 12 | 68030 | 68041 | IGS | 19 | p1 | (T)11 | 11 | 107567 | 107577 | CDS (rpl32) | |
| 9 | p1 | (T)14 | 14 | 71957 | 71970 | CDS (ycf3) | 20 | p1 | (A)10 | 10 | 109610 | 109619 | IGS | |
| 10 | p2 | (AT)6 | 12 | 73462 | 73473 | IGS | 21 | p1 | (A)12 | 12 | 110071 | 110082 | CDS (rps12) | |
| 11 | p2 | (AT)6 | 12 | 79134 | 79145 | IGS | 22 | p2 | (AT)7 | 14 | 111984 | 111997 | IGS |
c, compound SSR; p1, mono-nucleotide SSR; p2, di-nucleotide SSR.
Table 4.
GenBank information on complete chloroplast genomes of conifer taxa used in phylogenetic analyses in this study.
Table 4.
GenBank information on complete chloroplast genomes of conifer taxa used in phylogenetic analyses in this study.
| GenBank Accession | Taxon | Common Name | Family |
|---|---|---|---|
| NC_042410 | Abies alba | silver fir | Pinaceae |
| KP742350 | Abies koreana | Korean fir | Pinaceae |
| AB501189 | Larix decidua | common larch | Pinaceae |
| NC_036811 | Larix sibirica | Siberian larch | Pinaceae |
| NC_021456 | Picea abies | Norway spruce | Pinaceae |
| NC_032367 | Picea asperata | dragon spruce | Pinaceae |
| MN536531 | Pinus cembra | Swiss stone pine | Pinaceae |
| MK285358 | Pinus densiflora | Japanese red pine | Pinaceae |
| MZ333466 | Pinus mugo subsp. mugo | dwarf mountain pine | Pinaceae |
| MZ333465 | Pinus mugo subsp. rotundata | peat-bog pine | Pinaceae |
| MZ333464 | Pinus mugo subsp. uncinata | mountain pine | Pinaceae |
| NC_039585 | Pinus pinea | Italian stone pine | Pinaceae |
| NC_026302 | Pinus strobus | Eastern white pine | Pinaceae |
| KR476379 | Pinus sylvestris | Scots pine | Pinaceae |
| KY964286 | Pinus taeda | loblolly pine | Pinaceae |
| MH536745 | Podocarpus latifolius | broad-leaved yellowwood | Podocarpaceae |
Publisher’s Note: MDPI stays neutral with regard to jurisdictional claims in published maps and institutional affiliations. |
© 2021 by the authors. Licensee MDPI, Basel, Switzerland. This article is an open access article distributed under the terms and conditions of the Creative Commons Attribution (CC BY) license (https://creativecommons.org/licenses/by/4.0/).
Share and Cite
MDPI and ACS Style
Sokołowska, J.; Fuchs, H.; Celiński, K. New Insight into Taxonomy of European Mountain Pines, Pinus mugo Complex, Based on Complete Chloroplast Genomes Sequencing. Plants 2021, 10, 1331. https://doi.org/10.3390/plants10071331
AMA Style
Sokołowska J, Fuchs H, Celiński K. New Insight into Taxonomy of European Mountain Pines, Pinus mugo Complex, Based on Complete Chloroplast Genomes Sequencing. Plants. 2021; 10(7):1331. https://doi.org/10.3390/plants10071331
Chicago/Turabian StyleSokołowska, Joanna, Hanna Fuchs, and Konrad Celiński. 2021. "New Insight into Taxonomy of European Mountain Pines, Pinus mugo Complex, Based on Complete Chloroplast Genomes Sequencing" Plants 10, no. 7: 1331. https://doi.org/10.3390/plants10071331
Note that from the first issue of 2016, this journal uses article numbers instead of page numbers. See further details here.