Article

Characterization of the Barley Net Blotch Pathosystem at the Center of Origin of Host and Pathogen

1
Department of vegetables and field crops, Institute of Plant Science, Agricultural Research Organization, The Volcani Center, Rishon LeZion 7505101, Israel
2
The Mina & Everard Goodman Faculty of Life Sciences, Bar-Ilan University, Ramat-Gan 5290002, Israel
3
Institute for Cereal Crops Improvement, Tel Aviv University, Tel Aviv 6997801, Israel
4
Federal Research Institute for Cultivated Plants, Institute for Resistance Research and Stress Tolerance, Julius Kühn-Institut (JKI), Erwin-Baur-Str. 27, 06484 Quedlinburg, Germany
*
Authors to whom correspondence should be addressed.
Pathogens 2019, 8(4), 275; https://doi.org/10.3390/pathogens8040275
Submission received: 6 November 2019 / Revised: 23 November 2019 / Accepted: 27 November 2019 / Published: 29 November 2019

Abstract

:
Net blotch (NB) is a major disease of barley caused by the fungus Pyrenophora teres f. teres (Ptt), and P. teres f. maculata (Ptm). Ptt and Ptm infect the cultivated crop (Hordeum vulgare) and its wild relatives (H. vulgare ssp. spontaneum and H. murinum ssp. glaucum). The main goal of this research was to study the NB-causing pathogen in the crop center of origin. To address this, we have constructed a Ptt (n = 15) and Ptm (n = 12) collection isolated from three barley species across Israel. Isolates were characterized genetically and phenotypically. Aggressiveness of the isolates was determined based on necrotrophic growth rate on detached leaves of barley. In addition, isolates were genetically characterized by the mating type, followed by phylogenetic analysis, clustering them into seven groups. The analysis showed no significant differentiation of isolates based on either geographic origin, host of origin or form (Ptt vs. Ptm). Nevertheless, there was a significant difference in aggressiveness among the isolates regardless of host species, geographic location or sampling site. Moreover, it was apparent that the isolates derived from wild hosts were more variable in their necrotrophic growth rate, compared to isolates sampled from cultivated hosts, thereby suggesting that NB plays a major role in epidemiology at the center of barley origin where most of the diversity lies. Ptm has significantly higher necrotrophic and saprotrophic growth rates than Ptt, and for both a significant negative correlation was found between light intensity exposure and growth rates.

1. Introduction

Net blotch (NB) is a major disease of barley (Hordeum vulgare) caused by the necrotrophic fungus Pyrenophora teres f. teres (Ptt) and P. teres f. maculata (Ptm) with associated yield losses ranging between 10% to 40% [1]. The disease was first named after the typical netting symptom produced by Ptt on leaves of susceptible barley lines. In addition, a spot-like symptom has been observed and associated with P. teres f. maculata and was defined as Ptm a second form of P. teres. However, Ptt and Ptm are indistinguishable morphologically (for example, based on the conidia shape), so their identification can only be based on their symptoms. On a global level Ptt and Ptm have different global distribution patterns, usually with one form being predominant in a given area [2]. P. teres forms sexual pseudothecia at the end of the barley growing season. These structures over-summer on infected straw debris which enable pathogen survival between seasons and serve as the main source of inoculation [1,3]. This NB reproductive strategy combines the benefits of sexual reproduction, resulting in new allelic combinations and off-season survival mechanisms, with the advantages of rapidly multiplying individual clonal lines through asexual reproduction [4]. Since P. teres propagates very efficiently on wild plants, it forms a huge reservoir of new pathotypes of the pathogen well adapted to wild host populations. This soil-transmitted reservoir could constantly serve as a source of inoculums to initiate epidemics in the fields [1,3].
NB is the most economically important disease of barley in Israel. Here, in the center of origin of the crop, it infects not only cultivated barley but also wild barley, e.g., the wild progenitor H. vulgare ssp. spontaneum, and wild relatives such as H. murinum ssp. glaucum which are found in natural habitats and as weeds in cultivated fields across Israel. The epidemic burst of NB in 1951, due to the extensive use of NB-sensitive barley varieties and poor crop rotation [3], was the major cause for dramatic and immediate reduction of barley cultivation, formerly a leading crop, in Israel. More than half a century later, with a gradual expansion of barley fields in rain-fed regions in Israel, there is a pressing need to study this pathosystem and identify and dissect durable field resistance against this challenging pathogen [5].
Based on high virulence, high genetic variability of the pathogen and its hosts, and the availability of both reproductive structures (conidia and pseudothecia), Kenneth (1960) concluded that Israel and the surrounding region is a center of pathogen diversity. This could be implying long-term host-pathogen co-evolution in its natural habitats, including a recent phase of co-evolution under domestication. However, it has been illustrated in a few other host-pathogen systems (including barley) that the center of origin of host and pathogen are not necessarily the same [6]. Studying the dynamics of the pathogen and the host at their center of origin, where both natural and domesticated habitats co-exist, could be highly valuable. Recently, several studies have addressed cereal and legume pathosystems in their center of origin. These resulted in the identification of contrasting evolutionary patterns, from pathogen genetic differentiation [7,8,9] to non-differentiated meta-populations [10]. Little is known about the evolutionary processes affecting the NB populations in its presumed center of origin. The close proximity of the four Hordeum host species provides a unique opportunity to examine the pathogenetic host range at the host species level. As an examination tool we selected the Mating type gene which controls sexual development and production of sexual spores in P. teres [11] and was therefore a good candidate for phylogenetic analysis [12] having been already implemented in P. teres phylogenetic studies.
The influence of light intensity on the plant-pathogen interaction was studied on several pathogens, such as Colletotrichum graminicola on maize and Botrytis cinerea on tomato and strawberry. These works showed a negative correlation between light intensity and the ability of the pathogens to grow on leaf tissue and agar plates [10,11]. The barley canopy closure significantly reduces light penetration and induces leaf mortality. In the context of necrotrophic pathogens, light intensity is potentially a major factor that can affect plant-pathogen interactions and the infection process.
In the present study, we report the establishment of a unique ex-situ Israeli collection of NB isolates. We further evaluated NB isolates adaptability using both phenotypic and molecular tools in order to: (i) assign isolates to the Ptt and Ptm forms; (ii) characterize the eco-geographic range of NB isolates; (iii) characterize the diversity of virulence in the isolates collection; and (vi) test whether the identified variation among isolates could be associated with adaptation to host species, geographic region or environmental constrains such as light intensity.

2. Results

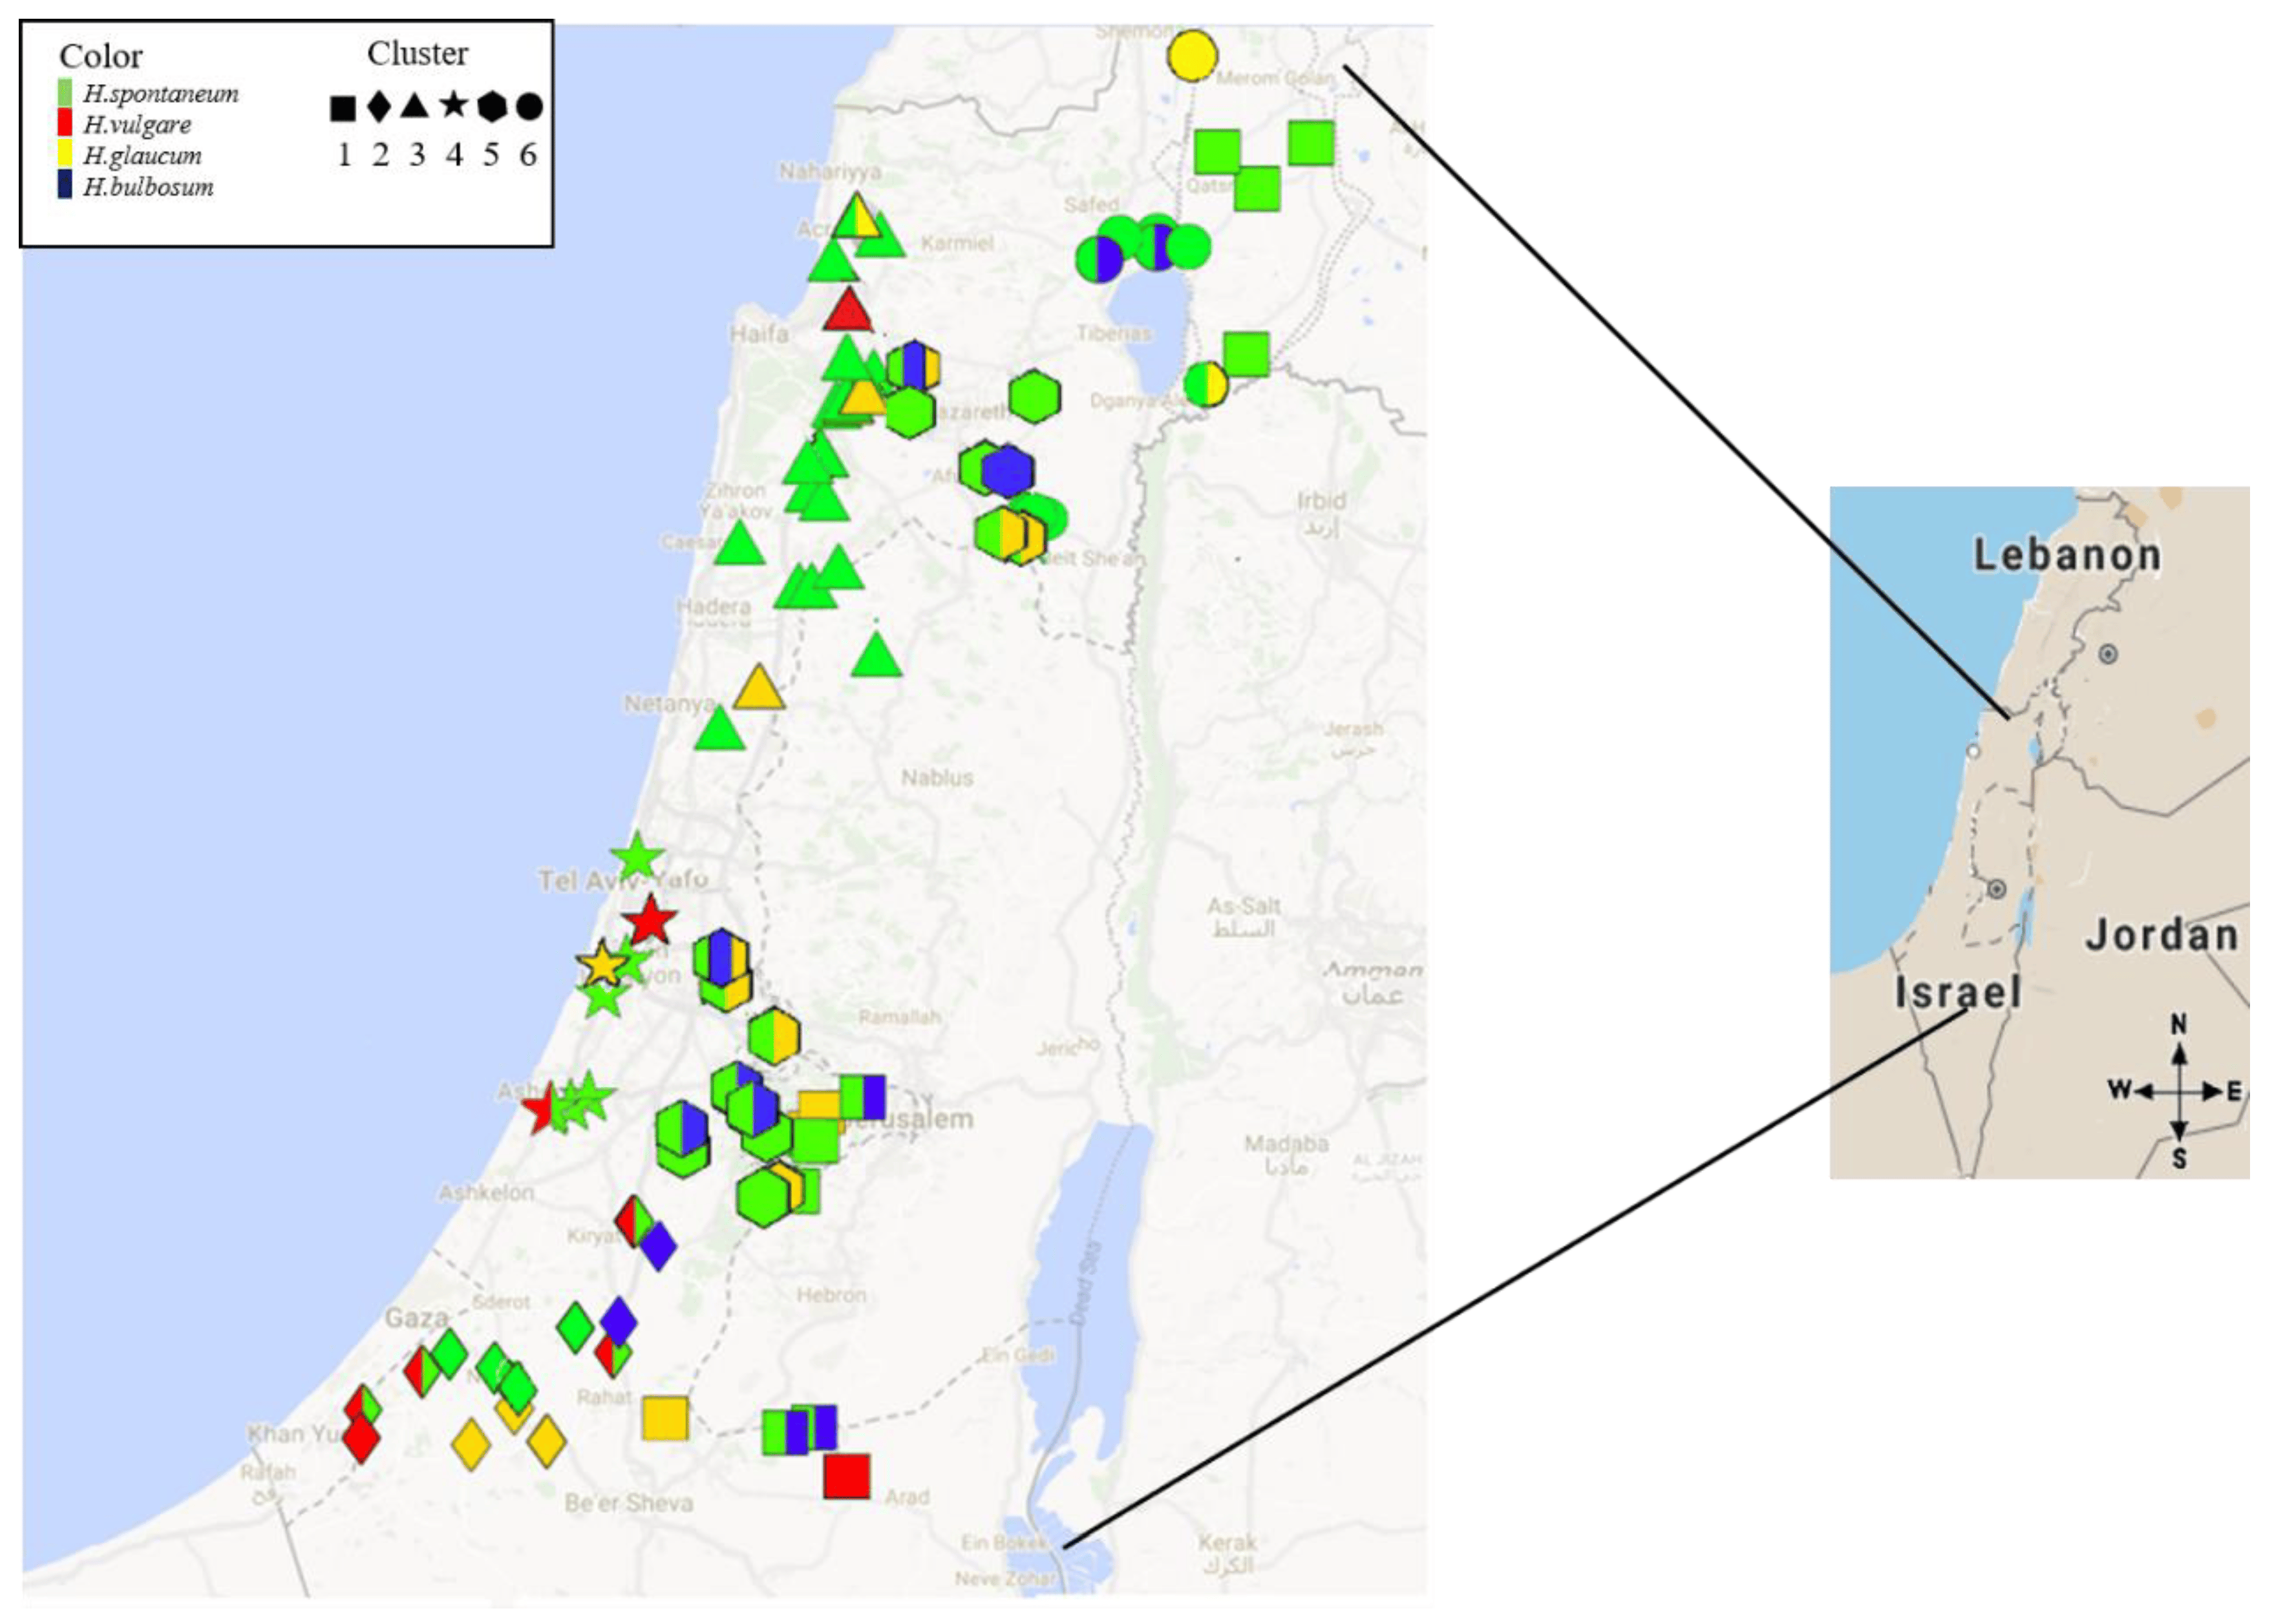
2.1. Spatial Survey Illustrated that Net Blotch is Distributed Across a Range of Hosts and Eco-Geographical Conditions

A spatial survey of the disease symptoms across Israel, included 126 samples collected from plants exhibiting net blotch (NB) symptoms [2,3] showed that NB disease is distributed across most of the eco-geographical niches of Israel, and infects three out of the four hosts surveyed (few samples of H. bulbosum showed symptom, and leaves were collected however P. teres could not be isolated). This distribution is sympatric with wild barley species H. vulgare ssp. spontaneum and H. murinum ssp. glaucum, and also covers the main area of barley cultivation in Israel (North-West Negev) but excludes H. bulbosum (Figure 1, and Supplementary Table S1). H. bulbosum showed almost no typical NB disease symptoms, and infection carried out in the laboratory (Koch’s postulates) that followed the isolation procedure failed to produce vital spores. Wild H. vulgare ssp. spontaneum and domesticated barley (H. vulgare) were the most common species with NB symptoms, and were found in majority of the sites, based on qualitative assessment (Figure 1, and Supplementary Table S1). To enable the identification of patterns in the multivariable eco-geographical data among NB collection sites, we computed clustering analysis based on selected climatic data. This clustering resulted in the classification of sampling sites into six distinguished eco-geographic-clusters, containing few variables (e.g., average solar radiation, precipitation, and temperature between January and March) showing significant differences between these six clusters (Supplementary Table S2).

2.2. High Frequency of Pyrenophora teres f. maculata among P. teres Isolates

The P. teres isolates (n = 28) obtained from leaf samples of wild and cultivated hosts from different habitats of Israel, consist a diverse collection of NB isolates (Table 1). The northern and eastern-most isolate was collected from Aloney Habashan (Lat\Long: 33.05\35.83), the southern-most isolate was collected from Gilat (Lat\Long: 31.34\34.67), and the western-most isolate from Kisufim (Lat\Long: 31.38\34.38). The longest distance between two collection sites was 225 kilometers (Table 1, and Supplementary Table S1). The NB isolates collection can be divided according to the host species into 19, seven, and two isolates from H. vulgare ssp. spontaneum (H.S); H. vulgare (H.V); and H. murinum ssp. glaucum (H.G), respectively, or into 21 wild and seven domesticated hosts, respectively. Although samples were collected from plants carrying NB symptoms [2,3], it contained high frequency of Ptm (12) and Ptt (16). Interestingly, Ptm isolates were collected from slightly but significantly warmer sites (average maximum temperature 35.7 ± 0.02 °C, 34.9 ± 0.03 °C for Ptm and Ptt, respectively, [P (|t|) < 0.05] during the off-season, July to September). All other eco-geographic variables from the isolate collection sites did not differ between the Ptt and Ptm collection sub groups.

2.3. P. teres Isolates Cluster into Several Phylogenetic Groups

To dissect the genetic relatedness of the isolates, we computed a separate Bayesian-based phylogeny [13] for the different Mating type MAT1-1-1 and MAT1-2-1 idiomorph sequences of the sampled isolates. The phylogenetic analysis resulted in identification of three major clades for MAT1-2-1, and four for MAT1-1-1 (based on posterior probability >0.67; Figure 2, and Table 1). No significant differences were found between phylogenetic groups (indicated by numbers adjacent to leaves) and the distribution of P. teres f. teres or P. teres f. maculate across the tree; likelihood ratio test [P2) < 0.184]. In addition, no association was found between phylogenetic groups and host species or eco-geographic-clusters (the latter are indicated with symbols adjacent to the leaves, Figure 2).

2.4. Substantial Variability in Saprotrophic Growth Rates

To further characterize the variation among NB isolates, we examined their saprotrophic growth rate. We observed significant differences in the growth rates of isolates on Czapek Dox agar (Supplementary Table S3). We noted that Ptm had a significantly higher growth rate (+22%), on average, compared to Ptt [0.55 ± 0.02 vs. 0.45 ± 0.04 for Ptm and Ptt, respectively, P (|t|) < 0.033, Table 2]. We did not find any effect of isolate host origin or eco-geographic variables and cluster membership on the saprotrophic growth rate [ANOVA test; P (F) < 0.762, P (F) < 0.912, respectively]. In addition, no significant differences were found between saprotrophic growth rates of the different phylogenetic groups [Figure 2, Welch’s ANOVA test P (F) < 0.45].

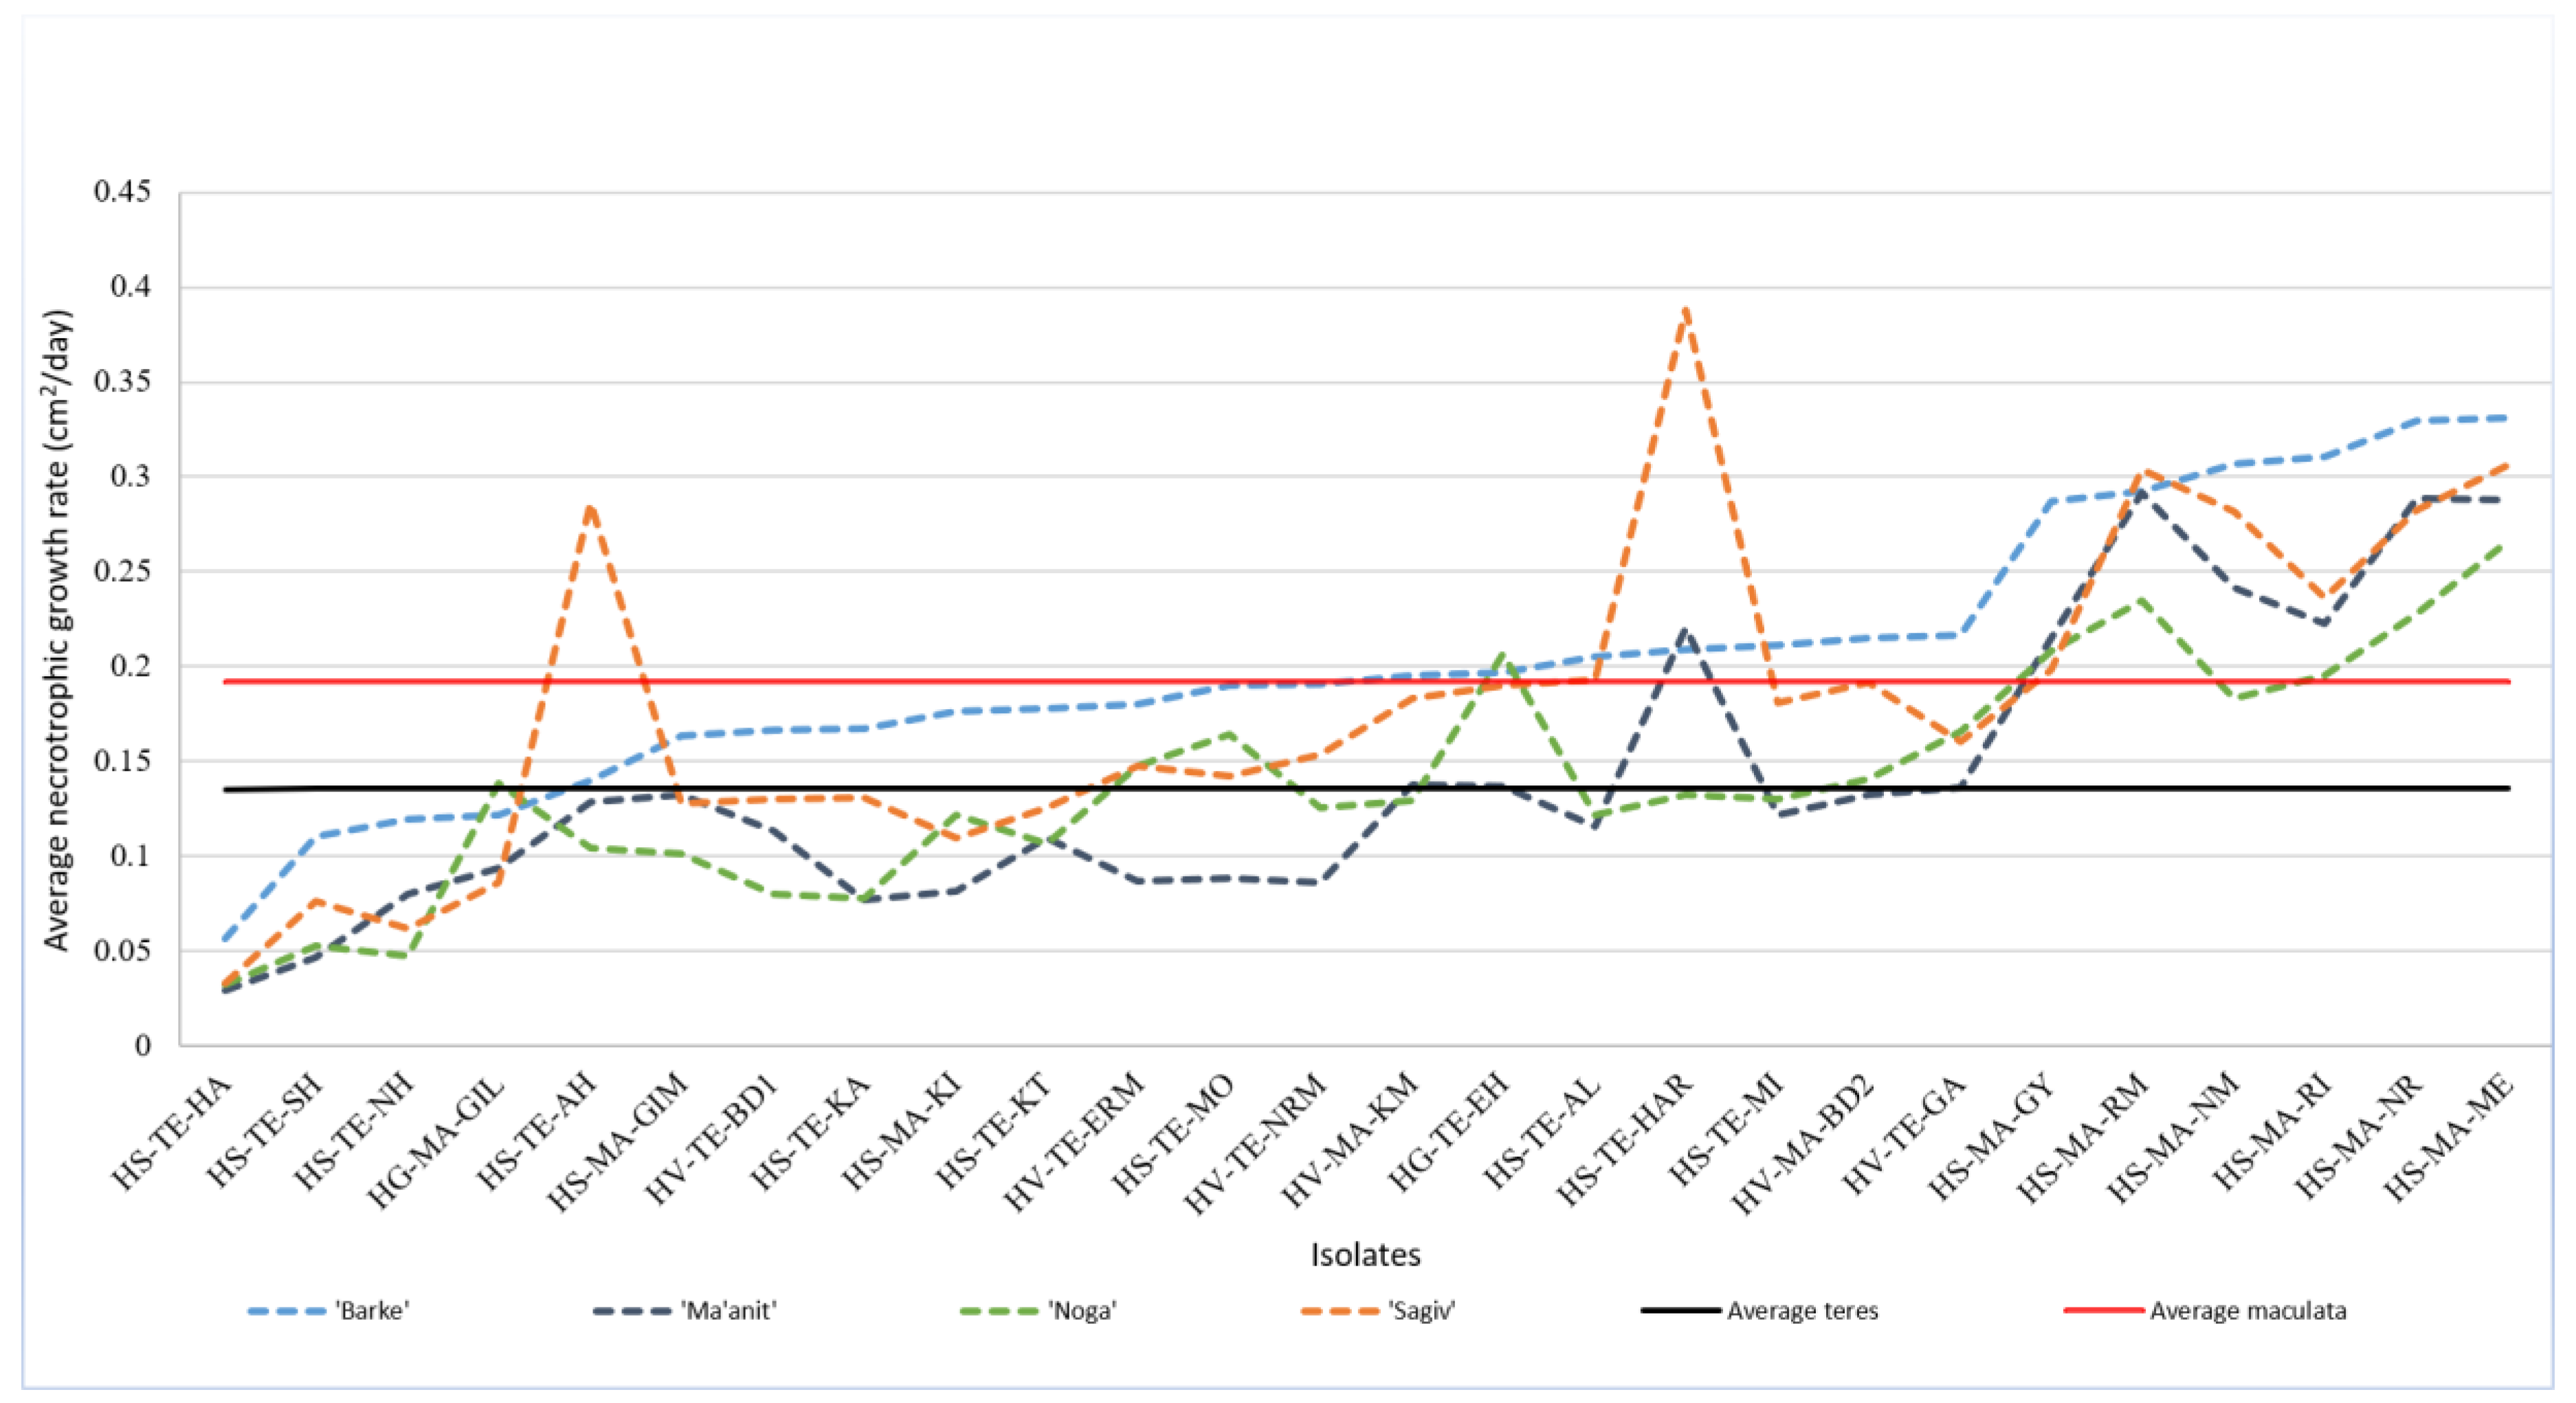
2.5. Necrotrophic Growth Rates Reveal Substantial Variability among Isolates, and Higher Growth Rates of Ptm Isolates

Variability in saprotrophic growth rate was previously associated with the growth rate on leaf tissue [15]. We therefore measured necrotrophic growth rate on barley leaves by inoculating each isolate on four barley varieties ('Noga', 'Ma'anit', 'Sagiv', and 'Barke'). We identified significant differences in necrotrophic growth rate among the fungal isolates (Figure 3, and Supplementary Table S3). In line with higher saprotrophic growth of Ptm, we found that Ptm isolates have significantly higher average necrotrophic growth rate (70%), compared to Ptt isolates (0.22 ± 0.02 vs. 0.138 ± 0.05 for Ptm and Ptt, respectively, P (|t|) < 0.01, Figure 3). Differences in necrotrophic growth rates of the NB isolates were not associated with the original host species or the eco-geographic attributes (i.e., eco-geographic-clusters) of the sampling site. No significant differences were found between the phylogenetic groups in distribution of necrotrophic growth rates (ANOVA test and Welch’s ANOVA test P (F) < 0.45).

2.5.1. Isolates from Wild Hosts Have More Variable Necrotrophic Growth Rates

To further characterize the variability in necrotrophic growth rate we compared the effect of wild vs. cultivated host on this phenotype. Isolates derived from wild hosts (H.G and H.S) showed higher virulence variability compared to isolates that were sampled from the domesticated host (H.V). This is demonstrated by the significant difference in the coefficient of variation (CV), i.e., 12.92 vs. 45.95 for domesticated and wild species, respectively [P (t) < 0.01, Bartlett test, Table 2]. This variability is also observed by the high representation of isolates from wild hosts on the extreme low (n = 6) and high (n = 9) ends of the virulence scale (Table 2, Supplementary Figure S1).

2.5.2. Isolate X Host Interactions

When necrotrophic growth rate was inspected in details for each of the four barley varieties used in the test, some interactions between isolate and host genotype were detected (apparent by crossing of the lines in Figure 3). However, a general trend was apparent from the significant correlation (Spearman's rho > 0.4, (ρ) < 0.0001) between necrotrophic growth rates of NB isolates on each variety-pair (e.g., 0.763 between NB isolates tested on 'Barke' and those tested on 'Ma'anit', Table 3). Generally, 'Barke' had significantly higher sensitivity to NB isolates compared with 'Noga', as expressed by the average necrotrophic growth rate of the isolates, 0.21 ± 0.02 on 'Barke' compared with 0.15 ± 0.01 on 'Noga' (Table 4). This response of 'Barke' to isolates was also characterized by lower variability (although not significant) of isolates necrotrophic growth rates on this host line, compared with 'Noga' (i.e., CV of 47.98 for 'Barke', and 55.14 for 'Noga').

2.5.3. Correlation Between Necrotrophic and Saprotrophic Growth Rates among Isolates

We also tested the pathogen phenotype on four barley cultivars (H. vulgare) to examine consistency (over different genotypes) and relationship between necrotrophic and saprotrophic growth relationships. We found high and significant correlation [Spearman's rho > 0.4, (ρ) < 0.0001] between necrotrophic and saprotrophic growth rates of the NB isolates on each of the four barley cultivars (e.g., 0.507 for 'Barke', Table 3). Considering this correlation, and the significantly higher saprotrophic and necrotrophic growth rate of Ptm compared to Ptt, we compared the normalized necrotrophic growth rates of the NB isolates (i.e., necrotrophic growth rate on leaves divided by saprotrophic growth rate) of Ptt to those of Ptm. The average normalized necrotrophic growth rate of Ptm isolates was significantly (18%, P (|t|) < 0.05) higher than that of Ptt, i.e., 0.39 vs. 0.33, respectively (Table 2). Although this result is in line with the trend shown for necrotrophic growth rates (i.e., higher rate for Ptm), the difference between Ptm and Ptt decreased by approximately 50%, i.e., 18% higher normalized growth rate of Ptm over Ptt isolates, compared with 70% higher non-normalized necrotrophic growth rate of Ptm over Ptt isolates.

2.6. Light Intensity is Negatively Correlated with Saprotrophic and Necrotrophic Growth Rates

The NB habitat in cultivated barley fields and the natural wild habitats of the Hordeum wild species that were sampled are characterized by differing vegetation densities and corresponding light intensities levels. We therefore tested the effect of light intensity on saprotrophic and necrotrophic growth rates across all isolates and the four cultivars used in the assays. Significant negative polynomic correlation were found between the intensity of light exposure and the saprotrophic and necrotrophic (R2 = 0.99 and 0.92 respectively) growth rates (Figure 4), reflecting a diminishing effect at the higher light intensity values. In all assays, the fastest growth occurred under the lowest light intensity (Figure 4, Supplementary).

3. Discussion

Barley was one of the earliest crops to be domesticated together with other major cereal crops [16] in the Fertile Crescent. Since then, the NB pathosystem transformed from merely a wild based pathosystem to a mixed co-existence of wild habitat and cultivated barley fields distributed sympatrically. The present study aimed to characterize a major barley pathogen, the net blotch causal agent, in the center of origin of the crop, to construct a representative collection of this pathogen, and to characterize its genetic variability and virulence profile. In addition, we discuss the relative contribution of the Ptt and Ptm genetic forms to the NB epidemics in our region.

3.1. Disease Distribution

In Israel and surrounding regions, wild barley species thrives across a wide ecological amplitude often sympatric to agricultural barley fields [17,18]. Moreover, both H. vulgare ssp. spontaneum and H. murinum ssp. glaucum are ruderal species which are found as weeds in high intimacy with the cultivated crop.
In general, NB propagates efficiently on wild plants (Figure 1, and Supplementary Table S1). Moreover, there is a huge reservoir of the pathogen in the wild host populations, which could occasionally or continuously serve as a source of initial inoculum to epidemics in the field [5,19]. Based on the frequency of infected leaf samples in our survey, we can conclude that wild H. murinum ssp. glaucum, and H. vulgare ssp. spontaneum and domesticated H. vulgare are the main hosts of Ptt and Ptm in our region, as reported in previous studies [3], and therefore serve as the major inoculum reservoir. Our observations also suggest that the best time to find clear NB symptoms is during the month before heading (when canopy is still green and before other pathogens rise), as previously suggested [3,5]. H. bulbosum showed almost no symptoms of either P. teres form, and even when there were symptoms, we did not find vital conidia. The fact that no successful isolation occurred is in full accordance with Kenneth (1960) finding and support his assumption that H. bulbosum is a NB non-host. This result supports the suggestion that H. bulbosum should be considered as a good resource of NB resistance [20,21,22].
The environment is considered a fundamental rib in the epidemic classical triangle [23]. We have looked into a long list of climatic variables, and identified significant differences between sampling sites for a few variables (Supplementary Table S2) that may affect NB epidemics and host physiology. However, no association was observed between isolate saprotrophic and necrotrophic growth rates and the eco-geographical conditions in their site of origin, as reflected by the eco-geographic clusters we identified (Table S2). Consistently, we did not find association between the host species from which the isolate was sampled and the environment (eco-geographic clusters). Our findings are in line with a similar study in the same region on the legume pathogen Peyronellaea pinodes which did not identify association between mean temperature in the origin of the pea isolate and temperature responses, spore germination rate, and aggressiveness [10].

3.2. Characterization of the NB Isolates Collection

3.2.1. Genetic Characterization

In this study, we computed a Bayesian-based phylogeny of isolates from the center of origin of barley, the host of P. teres. Phylogenetic analysis enabled us to identify several phylogenetic clusters, partially associated to host species. However, we did not identify association between the phylogenetic groups (based on the MAT1 locus) and the environmental parameters (eco-geographic-clusters) that were tested, nor with the necrotrophic and saprotrophic growth rates, and neither with the classification into the two forms of P. teres. This is in contrast to Rau et al. [24] who report on correlation between latitude of collection site and necrotic growth. The lack of correlation with environmental conditions may suggests that the mating type gene used in our study to reconstruct the phylogenetic history of P. teres is not significantly linked to mechanisms that support adaptation to these conditions. The lack of correlation to Ptt and Ptm is in contrast to previous studies that illustrated, based on MAT1, distinct clusters of the two forms [25,26]. Additionally, Rau et al. [24] reported on different co-evolutionary strategies of Ptt and Ptm on a particular barley landrace across six sites in the Island of Sardinia. Our research, which summarized the data of 28 isolates from both wild and domesticated barley hosts at the center of origin of this pathosystem, did not provide evidence for such Ptt and Ptm differentiation. These differences may result from the different sets of isolates and different algorithm used to reconstruct phylogeny (distance matrix-based methods) in the previous studies. As Bayesian inference phylogeny [13] is based on multiple sequence alignment, it is focused on conserved evolutionary information presumably important for the function and structure of the protein coding gene. Considering the visual-based classification (into Ptt and Ptm) some differences between studies may occur, however the significantly higher pathogenicity, and saprotrophic growth rate observed for the Ptm isolates furthers supports classifying them into one group. We have also tested the potential use of ITS sequences to construct a phylogenetic tree. Although ITS serves as a good “barcode” for differentiating fungal species [14], it did not contain sufficient variability to generate genetic resolution between isolates of P. teres (i.e., isolates of the same specie), as previously demonstrated by Andrie et al. [27].

3.2.2. Characterization of Virulence on Wild vs. Domesticated Host

Analysis of necrotrophic and saprotrophic growth rates showed substantial variance among the isolates, with significant effect of the host genotype (different barley cultivars used for the assay, Figure 3, Table 2). No differences in aggressiveness were found between isolates originating from wild vs. domesticated hosts. Similar to our study, no association was found by Golani et al. [10] between isolates from domesticated or wild pea in temperature responses, spore germination rates, and aggressiveness. This lack of differentiation in the NB pathosystem may be a result of the ruderal character of wild barley which could prevent specialization of P. teres into two different groups, that attack either wild or cultivated barley, since these species are growing side by side, providing an advantage to less specialized isolates. Such intimacy between wild and domesticated hosts is rarely observed in wheat, therefore enabling the slow and co-evolving differentiations of the pathogens in the wild habitats compared to domesticated field [7,8]. However, this conclusion should be carefully taken due to the relatively small sample size of isolates sampled from domesticated host.
Interestingly, the variability in virulence between isolates was associated with host origin (wild vs. cultivated), as expressed by higher CV values (for necrotrophic growth rate) in isolates originating from the wild (Table 2). However, these two groups did not differ in mean virulence values. The higher CV values may be explained by the higher genetic variability of wild barley compared the domesticated barley [28]. An additional cause might be the widespread distribution of wild barley in Israel, which causes high variability within and between populations on the wild host due to changing environmental conditions (expressed across our six eco-geographic clusters), ultimately increasing variability of the pathogen population [29]. Previous studies reported variability in pathogenicity between host species. Isolates of Blumeria graminis tritici (Bgt) in wheat showed differences in aggressiveness between the wild and the domesticated groups of isolates [7]. Similarly, Ben-David et al. [8] found higher CV values in virulence profiles of Bgt isolates from wild origin, compared to Bgt collected from wheat fields.
Studies which used differential lines already showed different R and susceptibility genes [30] for NB in barley. However, our assays of necrotrophic growth rate were based on host varieties from farmer fields, lacking data regarding their genetic background or presence of resistance genes. Therefore, our conclusions are mostly general and cannot shed light on the actual genetic mechanism that governs host plant response.

3.2.3. The Prominent Role of P. teres f. maculata

This work highlights the role of P. teres f. maculata in the NB pathosystem. First, the NB spatial survey demonstrated high frequency of this form encompassing approximately 40% of the samples. Interestingly, this high frequency of Ptm was not reported in the last NB survey, done in Israel in 1960 [3]. However, the dominant role of Ptm was recorded lately in a survey of barley fields in Victoria, Australia [31]. Although our survey is confined to 28 samples, our findings demonstrate a higher virulence of Ptm, as shown by 70% and 20% higher necrotrophic and saprotrophic growth rates, respectively, compared with Ptt (Table 2). These finding is in full accordance with the study on NB in Sardinia [24]. Ptm had also significant (20%) higher normalized virulence (measured by necrotrophic divided by saprotrophic growth rate) suggesting that the difference in virulence is not only related to the higher saprotrophic growth rate, and could result from additional virulence mechanisms (e.g., fungal effectors; [15]). The contribution of host defense mechanisms to this result is probably minor, considering that higher virulence of Ptm was observed on all four tested host lines (Figure 3). Ptm was found in sites with significantly higher maximum temperature in the warm off-season (from July to September), which could explain the recent increase in Ptm abundance in new area due to the evidence of rise in temperature [2,32,33]. We are aware that an increase of nearly 1 oC is not likely to affect fungal survival, however such a mean value is based on 30 years data, and may therefore reflect long-term climatic changes in this eco-geographic region. This change could have affected the pathogen over-summering adaptation and survival through a presumably unknown mechanism. Finally, our phenotypic assays and analysis of climatic data from the eco-geographic survey, illustrate that Ptm isolates exhibit higher aggressiveness and adaptation to higher temperatures, respectively. Ptm may therefore play an important role in a future scenario of increasing temperatures (i.e., climate change), thus the control of this form of P. teres should be considered in future breeding programs [31,34]. Our phylogenetic analysis showed significant genetic variability (illustrated by distinct clades). In addition, our analyses of saprotrophic, necrotrophic and light dependent growth show significant substantial differences between isolates. For example, our analysis illustrates approximately a 3.5 fold difference between the highest and lowest saprotrophic growth rates (Table S3), similarly the difference between the highest and lowest necrotrophic growth rates on ‘Barke’ is 7.1-fold (bigger differences were illustrated on the three other cultivars). Thus, it is conceivable that this study is likely to represent major trends of diversity of Ptt and Ptm isolates.

3.2.4. Reduced Light Intensity, a Potential Driver of NB Epidemics

We have detected a negative correlation between light intensity and pathogen saprotrophic and necrotrophic growth rates. NB growth rate is maximal at low light intensity (Figure 4). The significant role of light intensity on necrotrophic and saprotrophic growth rates of the NB isolates is consistent with previous studies of another necrotroph, Botrytis cinerea [35,36]. An initial study showed approximately 70% increase in saprotrophic growth rate, and 400% increase in lesion size on Arabidopsis thaliana leaves, when B. cinerea was grown in constant darkness compared with constant light [35]. Subsequent study demonstrated the presence of a circadian oscillator in B. cinerea and its role in pathogenicity; lesions produced by B. cinerea on A. thaliana leaves were smaller at dawn compared with dusk, and this effect depended on the pathogen's circadian system, as it was abrogated by over expression of the negative regulator BcFRQ1, or by constant light [37]. The role of light intensity in pathogenicity is an emerging topic, demonstrated so far in only a few systems [37]. Our work illustrates this phenomenon in an important pathogen of a staple crop, based on monitoring 108 different isolate X host interactions (27 isolates x four barley cultivars), providing analytic and statistical robustness to our finding. The shape of cereal canopy (in general), and particularly in barley, reduces the light intensity. The vegetative growth stage of cultivated barley is often characterized by a 'green-cap', made of young leaves covering and over-shading older leaves. Considering that important part of the disease cycle of the Ptt and Ptm is occurring under this green cap, fungal isolates that evolved to have a faster necrotrophic growth rate under low light intensity would have a competitive advantage on other isolates and improved adaptively to the host.

4. Materials and Methods

4.1. Sampling Procedure

A total of 126 samples of barley leaves with NB symptoms from four host species (H. vulgare ssp. spontaneum, H.S; H. vulgare, H.V; H. murinum ssp. glaucum, H.G; and H. bulbosum, H.B) were collected during 2015–2017 across Israel. Sampling was done from a wide range of eco-geographic environments (Figure 1, Supplementary Table S1). Collection site latitude, longitude and elevation were measured by GPS. Long-term data on precipitation (annual average, amount in the wet month), maximum and minimum temperatures, wind speed average and solar radiation were extracted from the 30 years WORLDCLIM dataset (~1 km spatial resolution) [34]. The choice of which variable to include in the eco-geographic clustering analysis was based initially on their presumed influence on NB dynamic and epidemics at the field during the season. This was done based on our experience from the current survey and previous work [3]. The dried leaves samples were kept in the dark at room temperature prior to fungal isolation. These conditions maintain the vitality of the isolate cultures for more than one year.

4.2. Plant and Pathogen Material

Twenty-seven isolates of Ptt and Ptm were isolated from the leaf samples, representing the barley host and eco-geographic range (Supplementary Table S1). A modified protocol [3,38] was used to develop single-conidial culture from natural infected leaves. In short, leaf samples were cut into 20–30 mm pieces, surface sterilized by 70% alcohol for 10 s and washed in distilled water. Each sample was placed in a clean petri dish containing a wet filter paper (Whatman) and incubated at 18–20 °C with 12 h light/12 h dark for 36 hrs. Single conidia were transferred (under light microscope) to PDA (potato dextrose agar) plates, by Koch's postulates on detached leaves [3]. Species validation level was based both on alignment of the MAT1 gene (below) of isolates sequences to the GenBank database (NCBI) using BLASTN, and on plant symptoms. The classification into Ptt or Ptm were done using the symptom appearance as described in the literature [1,2,39].

4.3. Genomic DNA Extraction, Primers, PCR, and Sequence Analysis

DNA extraction was performed according to Möller [40] from fresh mycelia in liquid Czapek Dox medium with 0.25 g/L chloramphenicol (Sigma). PCR amplification of the MAT1 gene (primers in Table 5) was conducted as described by Lu et al. (2013), followed by sequencing of the product by Sanger sequencing at Hy Laboratories Ltd, Rehovot, Israel.

4.4. Phylogenetic Analysis

The MAT1 gene sequences were processed by Geneious® software (https://www.geneious.com); nucleotides with sequencing quality below 40 were excluded from the analysis [Quality < 40, P (error) < 0.0001]. A multiple sequences alignment (MSA) was generated separately for isolate sequences of MAT1-1-1 or MAT1-2-1 idiomorphs, using MAFFT (global-pair algorithm) [41]. Gaps were removed from each MSA using trimAL (auotomated1 algorithm) [39]. The best model was estimated using the IQ-TREE built-in function, which tests 144 models (Minh et al. 2013). Bayesian inference was computed using MrBayes, under the GTR substitution model with an invariable gamma distribution for 300,000 generations for both mating type genes [13]. FigTree [42] was used to generate phylogenetic trees. The isolates Timrat and Gan-Yavne (Supplementary Table S1), which appear in virulence characterization tests, do not appear in this analysis due to difficulty in extracting DNA and obtaining informative sequence from these isolates. We also attempted to identify differences between the isolates based on other “housekeeping” genes such the Internal transcribed spacer (ITS) sequence [43], however their sequences did not contain enough variability to differentiate between isolates. As MAT1 contains highest sequence variability among Ptt and Ptm isolates it is more likely to separate between these different forms.

4.5. Phenotypic Assay

Saprotrophic growth rate. The saprotrophic growth rate was tested as follows: An agar plug (4 mm diameter) containing mycelium of the tested isolate (taken from the margins of the growing colony) was placed on Czapek Dox agar with 0.25 g/L chloramphenicol (10 ml per each plate). Each isolate was tested in four repeats, and four plates per isolate were arranged in a stack (as described in the detached-leaf experiment). The experiment was performed in two rounds: (1) 26 isolates were represented by four repeats, each exposed to a different light intensity. Repeats 1-4 were exposed to 1800-2800, 320-680, 90-180, and 45-120 lux, respectively; (2) 16 selected isolates were tested in three different light intensities: 3500, 1500, and 500 lux, respectively. Growth on either detached leaves (see below) or Czapek Dox medium was photographed using a Canon 100D (30-2, Shimomaruko 3-chome, Ohta-ku, Tokyo 146-8501, Japan), once or twice a day. The images were analyzed using ImageJ software to calculate the rate of progress of each isolate [44]. Isolate ‘Beeri’ was omitted from the saprotrophic and necrotrophic growth analysis as it ceased growing during the course of the study.
Necrotrophic growth rate. The necrotrophic growth rate was measured on detached barley leaves of cultivated barley lines ‘Noga’, ‘Ma’anit’, ‘Sagiv’, and ‘Barke’. The first three are commercial cultivars presently grown in Israel, the last is a German variety. The first leaf of each seedling was cut into seven cm segments and placed together in 9 × 9 cm2 high density polyethylene boxes on sterilized four-layer paper towel. In each box six ml of sterile water containing 60 ppm of benzimidazole (Sigma) were added [38]. Each detached leaf was inoculated in the center with an agar plug (four mm diameter) of mycelium from the margins of a growing colony of a given isolate. Each isolate was tested on all four varieties in four replicates. During the first 24 h the plates were placed in a biological hood at 24 °C and 400 lux, then they were transferred to an incubator at 18 °C. The boxes of each isolate were arranged in a stack, thus the upper replicate was exposed to the highest light intensity and the bottom one to the lowest intensity (3500, 1280, 500, and 280 lux for each replicate, respectively). The terms aggressiveness and virulence are defined as the quantitative negative effect of a pathogen on its host and the capacity of the pathogen to infect a particular host genotype, respectively, following Vanderplank terminology [29].

4.6. Statistical Analyses

All statistical analyses were performed on JMP® 13 (SAS Institute Inc., Cary, NC, 1989–2007). Testing for a normal distribution was carried out by the Shapiro-wilk W test [P < 0.05] and homogeneity of variances was estimated using the Bartlett test. ANOVA was applied to assess the effect of different factors (host species, eco-geographical variables, the fungus Ptt and Ptm, genetic clade according to phylogenetic analysis, and light intensity) on necrotrophic and saprotrophic growth rates. ANOVA was also used to test whether isolates groups, divided according to factors such as host, fungus form (Ptt or Ptm) and genetic clade (phylogenetic analysis) showed significant differences in eco-geographic variables from their site of collection. In cases of non-normal distribution, we used nonparametric tests: Kruskal–Wallis test (instead of one-way ANOVA) and Wilcoxon signed-rank test (instead of Student's t-test). Ward's method was used to cluster the samples based on their eco-geographic variables data.

5. Conclusions

The NB isolate collection reported here is a promising resource for studying plant-pathogen interaction in the center of host diversity. In this work, we have shown that Ptm has a prominent representation in the pathogen population with a clear advantage over Ptt in necrotic growth. The relative dominance of Ptm in the NB-Barley pathosystem at the center of origin was not documented before and might reflect a long-term adaptation to climate change. This result, together with a presumable better adaptation of Ptm based on its higher growth rate, highlights the importance of this form in field epidemics, suggesting that future studies and breeding programs should focus on the control of this pathogen. Additionally, the variability in pathogenicity of the isolates may lead to the conclusion that several representative isolates should be used in breeding programs aimed to develop durable resistance. Such programs should consider the interaction between the barley varieties and the isolates as illustrated in our study. Finally, a significant negative correlation was found between light intensity and isolate virulence. In agreement with previous studies on another necrotroph [35,37], this result suggests that light sensing could play an important role in the disease cycle of the NB-Barley pathosystem.

Supplementary Materials

The following are available online at https://www.mdpi.com/2076-0817/8/4/275/s1, Figure S1: Isolate name, Table S1: distribution of Net Blotch disease in Israel by site, barley species and ecogeographic membership. The sampling was taken in the years 2015–2017, Table S2: summary of the mean value of the eco-geographic variable, Table S3: aggressiveness of Pyrenophora teres isolates on detached leaves and saprophytic.

Author Contributions

R.B.-D., A.H., and M.R. designed the experiments, R.B.-D., M.R. and H.S. conducted the experiments. R.B.-D., A.H., M.R., H.S., D.K. and E.F. analyzed data and wrote the paper. All authors read and approved the manuscript.

Acknowledgments

This research was supported by a grant from the Israeli Chief Scientist, Ministry of Agriculture (grant number 20-10-0054) to E.F, R.B.-D., H.S. and A.H.

Conflicts of Interest

The authors declare that they have no conflict of interest.

References

  1. Liu, Z.; Ellwood, S.R.; Oliver, R.P.; Friesen, T.L. Pyrenophora teres: Profile of an increasingly damaging barley pathogen. Mol. Plant Pathol. 2011, 12, 1–19. [Google Scholar] [CrossRef]
  2. McLean, M.S.; Howlett, B.J.; Hollaway, G.J. Erratum to: Epidemiology and control of spot form of net blotch (Pyrenophora teres f. maculata) of barley: A review. Crop Pasture Sci. 2009, 60, 499. [Google Scholar]
  3. Kenneth, R. Aspects of the Taxonomy, Biology and Epidemiology of Pyrenophora teres Drechsl. (Drechslera teres (SACC.) Shoemaker), the Causal Agent of Net Blotch Disease of Barley. In Doctoral Dissertation; The Hebrew University: Jerusalem, Israel, 1960. [Google Scholar]
  4. McDonald, B.A.; Linde, C. Pathogen population genetics, evolutionary potential, and durable resistance. Annu. Rev. Phytopathol. 2002, 40, 349–379. [Google Scholar] [CrossRef]
  5. Ronen, M. The Net Blotch Disease in Barley-Characterization of the Pathogen Pyrenophora teres f. teres and Screening for Resistance in Wild and Domesticated. In MSc thesis; Bar Ilan University: Ramat-Gan, Israel, 2017. [Google Scholar]
  6. Zaffarano, P.L.; McDonald, B.A.; Zala, M.; Linde, C.C. Global hierarchical gene diversity analysis suggests the fertile crescent is not the center of origin of the barley scald pathogen Rhynchosporium secalis. Phytopathology 2006, 96, 941–950. [Google Scholar] [CrossRef]
  7. Ben-David, R.; Parks, R.; Dinoor, A.; Kosman, E.; Wicker, T.; Keller, B.; Cowger, C. Differentiation among Blumeria graminis f. sp. tritici isolates originating from wild versus domesticated Triticum Species in Israel. Phytopathology 2016, 106, 861–870. [Google Scholar]
  8. Ben-David, R.; Dinoor, A.; Peleg, Z.; Fahima, T. Reciprocal hosts responses to powdery mildew isolates originating from domesticated wheats and their wild progenitor. Front. Plant Sci. 2018, 9, 75. [Google Scholar] [CrossRef] [PubMed]
  9. Frenkel, O.; Sherman, A.; Abbo, S.; Shtienberg, D. Different ecological affinities and aggressiveness patterns among Didymella rabiei isolates from sympatric domesticated chickpea and wild Cicer judaicum. Phytopathology 2008, 98, 600–608. [Google Scholar] [CrossRef] [PubMed]
  10. Golani, M.; Abbo, S.; Sherman, A.; Frenkel, O.; Shtienberg, D. The temperature response and aggressiveness of Peyronellaea pinodes Isolates originating from wild and domesticated Pisum sp. in Israel. Phytopathology 2016, 106, 824–832. [Google Scholar] [CrossRef] [PubMed]
  11. Turgeon, B.G. Application of mating type gene technology to problems in fungal biology. Annu. Rev. Phytopathol. 1998, 36, 115–137. [Google Scholar] [CrossRef] [PubMed]
  12. Rau, D.; Maier, F.J.; Papa, R.; Brown, A.H.D.; Balmas, V.; Saba, E.; Schaefer, W.; Attene, G. Isolation and characterization of the mating-type locus of the barley pathogen Pyrenophora teres and frequencies of mating-type idiomorphs within and among fungal populations collected from barley landraces. Genome 2005, 48, 855–869. [Google Scholar] [CrossRef]
  13. Huelsenbeck, J.P.; Ronquist, F. MRBAYES: Bayesian inference of phylogenetic trees. Bioinformatics 2001, 17, 754–755. [Google Scholar] [CrossRef] [PubMed]
  14. Schoch, C.L.; Seifert, K.A.; Huhndorf, S.; Robert, V.; Spouge, J.L.; Levesque, C.A.; Chen, W.; Bolchacova, E.; Voigt, K.; Crous, P.W.; et al. Nuclear ribosomal internal transcribed spacer (ITS) region as a universal DNA barcode marker for Fungi. Proc. Natl. Acad. Sci. USA. 2012, 109, 6241–6246. [Google Scholar] [CrossRef] [PubMed]
  15. Srivastava, D.A.; Yakubov, M.; Feldbaum, R.; Tish, N.; Shoyhet, H.; Manasherova, E.; Pandaranayaka, E.P.J.; Rav-David, D.; Elad, Y.; Harel, A. Multiparametric analysis of diversity in Botrytis cinerea isolates from Israel. Phytoparasitica 2018, 46, 569–581. [Google Scholar] [CrossRef]
  16. Lev-Yadun, S.; Gopher, A.; Abbo, S. The cradle of agriculture. Science 2000, 288, 1602–1603. [Google Scholar] [CrossRef] [PubMed]
  17. Hübner, S.; HÖffken, M.; Oren, E.; Haseneyer, G.; Stein, N.; Graner, A.; Schmid, K.; Fridman, E. Strong correlation of wild barley (Hordeum spontaneum) population structure with temperature and precipitation variation. Mol. Ecol. 2009, 18, 1523–1536. [Google Scholar] [CrossRef]
  18. Salamini, F.; Özkan, H.; Brandolini, A.; Schäfer-Pregl, R.; Martin, W. Genetics and geography of wild cereal domestication in the near east. Nat. Rev. Genet. 2002, 3, 429–441. [Google Scholar] [CrossRef]
  19. Dinoor, A. Role of wild and cultivated plants in the epidemiology of plant diseases in Israel. Annu. Rev. Phytopathol. 1974, 12, 413–436. [Google Scholar] [CrossRef]
  20. Walther, U.; Rapke, H.; Proeseler, G.; Szigat, G. Hordeum bulbosum—A new source of disease resistance—Transfer of resistance to leaf rust and mosaic viruses from H. bulbosum into winter barley. Plant Breed. 2000, 119, 215–218. [Google Scholar] [CrossRef]
  21. Pickering, R.; Ruge-Wehling, B.; Johnston, P.A.; Schweizer, G.; Ackermann, P.; Wehling, P. The transfer of a gene conferring resistance to scald (Rhynchosporium secalis) from Hordeum bulbosum into H. vulgare chromosome 4HS. Plant Breed. 2006, 125, 576–579. [Google Scholar] [CrossRef]
  22. Scholz, M.; Ruge-Wehling, B.; Habekuss, A.; Schrader, O.; Pendinen, G.; Fischer, K.; Wehling, P. Ryd4 (Hb): A novel resistance gene introgressed from Hordeum bulbosum into barley and conferring complete and dominant resistance to the barley yellow dwarf virus. Theor. Appl. Genet. 2009, 119, 837–849. [Google Scholar] [CrossRef]
  23. Stevens, R.B. Cultural practices in disease controltle. In Plant Pathology; Academic Press: Cambridge, MA, USA, 1960; pp. 357–429. [Google Scholar]
  24. Rau, D.; Rodriguez, M.; Leonarda Murgia, M.; Balmas, V.; Bitocchi, E.; Bellucci, E.; Nanni, L.; Attene, G.; Papa, R. Co-evolution in a landrace meta-population: Two closely related pathogens interacting with the same host can lead to different adaptive outcomes. Sci. Rep. 2015, 5, 12834. [Google Scholar] [CrossRef] [PubMed]
  25. Rau, D.; Attene, G.; Brown, A.H.D.; Nanni, L.; Maier, F.J.; Balmas, V.; Saba, E.; Schäfer, W.; Papa, R. Phylogeny and evolution of mating-type genes from Pyrenophora teres, the causal agent of barley “net blotch” disease. Curr. Genet. 2007, 51, 377–392. [Google Scholar] [CrossRef] [PubMed]
  26. Lu, S.; Edwards, M.C.; Friesen, T.L. Genetic variation of single nucleotide polymorphisms identified at the mating type locus correlates with form-specific disease phenotype in the barley net blotch fungus Pyrenophora teres. Eur. J. Plant Pathol. 2013, 135, 49–65. [Google Scholar] [CrossRef]
  27. Andrie, R.M.; Schoch, C.L.; Hedges, R.; Spatafora, J.W.; Ciuffetti, L.M. Homologs of ToxB, a host-selective toxin gene from Pyrenophora tritici-repentis, are present in the genome of sister-species Pyrenophora bromi and other members of the Ascomycota. Fungal Genet. Biol. 2008, 45, 363–377. [Google Scholar] [CrossRef] [PubMed]
  28. Hübner, S.; Günther, T.; Flavell, A.; Fridman, E.; Graner, A.; Korol, A.; Schmid, K.J. Islands and streams: Clusters and gene flow in wild barley populations from the Levant. Mol. Ecol. 2012, 21, 1115–1129. [Google Scholar] [CrossRef] [PubMed]
  29. Vanderplank, J. Disease Resistance in Plants, 2nd ed.; Academic Press: Orlando, FL, USA, 1984. [Google Scholar]
  30. Afanasenko, O.S.; Jalli, M.; Pinnschmidt, H.O.; Filatova, O.; Platz, G.J. Development of an international standard set of barley differential genotypes for Pyrenophora teres f. teres. Plant Pathol. 2009, 58, 665–676. [Google Scholar] [CrossRef]
  31. McLean, M.S.; Howlett, B.J.; Hollaway, G.J. Spot form of net blotch, caused by Pyrenophora teres f. maculata, is the most prevalent foliar disease of barley in Victoria, Australia. Australas. Plant Pathol. 2010, 39, 46–49. [Google Scholar]
  32. Marshall, J.M.; Kinzer, K.; Brueggeman, R.S. First report of Pyrenophora teres f. maculata the cause of spot form net blotch of barley in Idaho. Plant Dis. 2015, 99, 1860. [Google Scholar]
  33. NOAA (National Oceanic and Atmospheric Administration). Available online: https://www.wrh.noaa.gov/boi/climo/average%20annual%20temperatures%20at%20boise,%20airport.txt (accessed on 29 November 2019).
  34. Hijmans, R.J.; Cameron, S.E.; Parra, J.L.; Jones, P.G.; Jarvis, A. Very high resolution interpolated climate surfaces for global land areas. Int. J. Climatol. 2005, 25, 1965–1978. [Google Scholar] [CrossRef]
  35. Canessa, P.; Schumacher, J.; Hevia, M.A.; Tudzynski, P.; Larrondo, L.F. Assessing the effects of light on differentiation and virulence of the plant pathogen botrytis cinerea: Characterization of the white collar complex. PLoS ONE 2013, 8, e84223. [Google Scholar] [CrossRef]
  36. Cox, P.M.; Betts, R.A.; Jones, C.D.; Spall, S.A.; Totterdell, I.J. Acceleration of global warming due to carbon-cycle feedbacks in a coupled climate model. Nature 2000, 408, 184–187. [Google Scholar] [CrossRef] [PubMed]
  37. Hevia, M.A.; Canessa, P.; Müller-Esparza, H.; Larrondo, L.F. A circadian oscillator in the fungus Botrytis cinerea regulates virulence when infecting Arabidopsis thaliana. Proc. Natl. Acad. Sci. USA 2015, 112, 8744–8749. [Google Scholar] [CrossRef] [PubMed]
  38. König, J.; Perovic, D.; Kopahnke, D.; Ordon, F. Mapping seedling resistance to net form of net blotch (Pyrenophora teres f. teres) in barley using detached leaf assay. Plant Breed. 2014, 133, 356–365. [Google Scholar]
  39. Williams, K.J.; Smyl, C.; Lichon, A.; Wong, K.Y.; Wallwork, H. Development and use of an assay based on the polymerase chain reaction that differentiates the pathogens causing spot form and net form of net blotch of barley. Australas. Plant Pathol. 2001, 30, 37–44. [Google Scholar] [CrossRef]
  40. Möller, E.M.; Bahnweg, G.; Sandermann, H.; Geiger, H.H. A simple and efficient protocol for isolation of high molecular weight DNA from filamentous fungi, fruit bodies, and infected plant tissues. Nucleic Acids Res. 1992, 20, 6115–6116. [Google Scholar] [CrossRef] [PubMed]
  41. Katoh, K.; Misawa, K.; Kuma, K.; Miyata, T. MAFFT: A novel method for rapid multiple sequence alignment based on fast Fourier transform. Nucleic Acids Res. 2002, 30, 3059–3066. [Google Scholar] [CrossRef] [PubMed] [Green Version]
  42. Rambaut, A. FigTree, A Graphical Viewer of Phylogenetic Trees. (Ver 1.4.3). 2009. Available online: http://tree.bio.ed.ac.uk/software/figtree/ (accessed on 4 October 2016).
  43. Baldwin, B.G.; Sanderson, M.J.; Porter, J.M.; Wojciechowski, M.F.; Campbell, C.S.; Donoghue, M.J. Erratum: The ITS region of nuclear ribosomal DNAZ: A valuable source of evidence on angiosperm phylogeny. Ann. Mo. Bot. Gard. 1996, 83, 151. [Google Scholar] [CrossRef]
  44. Schneider, C.A.; Rasband, W.S.; Eliceiri, K.W. NIH Image to ImageJ: 25 years of image analysis. Nat. Methods 2012, 9, 671–675. [Google Scholar] [CrossRef]
Figure 1. Spatial survey of Pyrenophora teres samples (that exhibited net blotch (NB) symptoms) from wild barley (H. spontaneum, H. murinum ssp. glaucum, H. bulbosum) or cultivated barley (H. vulgare) fields (host species are indicated by colour code) from different eco-geographic regions (co-geographic-clusters are indicated by symbol).
Pathogens 08 00275 g001
Figure 2. Phylogeny computed by Bayesian inference, based on the full-length of MAT1-2-1 (left) and MAT1-1-1 (right) idiomorphs. Three major MAT1-2-1, and four major MAT1-1-1 clades are indicated by numbers right to the leaves. Bayesian posterior probability values are shown above the branches. Wild and cultivated hosts (H. vulgare ssp. spontaneum,H. murinum ssp. glaucum, H. bulbosum, and H. vulgare) from which isolates originated are indicated by color code, and the eco-geographic classification (eco-geographic clusters) of each host's environment is indicated by symbol. Another species of this genus, P. graminea, was used as an outgroup [14], and sequences of non-Israeli isolates (NCBI sequence) were used as a reference.
Pathogens 08 00275 g002
Figure 3. Comparison of mean necrotrophic growth rate (cm2\day) of each of the 27 NB isolates (Table 1), on detached leaves of each of four barley varieties separately (four replicates of detached leaves from each variety were used for each isolate). The mean necrotrophic growth rate of Ptm and Ptt are illustrated in red and black lines, respectively.
Pathogens 08 00275 g003
Figure 4. Correlation between light intensity (Lux) and average saprotrophic or necrotrophic growth rates (cm2/day) of 27 NB isolates, tested on four different barely varieties ('Noga', 'Ma'anit', 'Sagiv', and 'Barke'). Significant regression was found for saprotrophic (P (F) < 0.0018), and necrotrophic (P (F) < 0.0001) growth rates, respectively.
Pathogens 08 00275 g004
Table 1. Characterized Ptt and Ptm isolates used in this study.
Isolate Name 1Collection SiteHost SpecieMAT IdiomorphFormaPhylogenetic Group
H.S-MA-RIRishonH. spontaneum1-1-1Ptm4
H.V-TE-NRMRamot MenasheH. vulgare1-1-1Ptt2
H.V-TE-ERMRamot MenasheH. vulgare1-1-1Ptt2
H.V-TE-BE 2BeeriH. vulgare1-1-1Ptt-
H.V-MA-BD2Beit DaganH. vulgare1-1-1Ptm4
H.S-TE-SHShtulimH. spontaneum1-1-1Ptt2
H.S-MA-NMNeve MichaeH. spontaneum1-1-1Ptm-
H.S-TE-NHNetiv Halamed HeH. spontaneum1-1-1Ptt3
H.S-TE-MOModi'inH. spontaneum1-1-1Ptt2
H.S-TE-MIMitzpe IlanH. spontaneum1-1-1Ptt1
H.S-MA-MEMeytzarH. spontaneum1-1-1Ptm4
H.S-MA-KI3KisufimH. spontaneum1-1-1Ptm3
H.S-TE-KAKatzirH. spontaneum1-1-1Ptt-
H.S-TE-KTKiryat TivonH. spontaneum1-1-1Ptt-
H.S-TE-HAR3HaruvitH. spontaneum1-1-1Ptt3
H.S-MA-GIMGimzueH. spontaneum1-1-1Ptm-
H.G-MA-GILGilatH. glaucum1-1-1Ptm4
H.G-TE-EHEl HaharH. glaucum1-1-1Ptt-
H.S-TE-AHAloney habashanH. spontaneum1-2-1Ptt3
H.V-MA-KM 3Kefar MasarikH. vulgare1-2-1Ptm1
H.V-TE-GAGatH. vulgare1-2-1Ptt3
H.V-TE-BD1Beit DaganH. vulgare1-2-1Ptt1
H.S-MA-RMRamot MenasheH. spontaneum1-2-1Ptm2
H.S-MA-NRNahal RazH. spontaneum1-2-1Ptm2
H.S-TE-HAHarishH. spontaneum1-2-1Ptt2
H.S-TE-ALAlumimH. spontaneum1-2-1Ptt1
H.S-MA-GYGan YavneH. spontaneumn/aPtmn/a
H.S-MA-TI 3TimratH. spontaneumn/aPtmn/a
1: Isolates names sections, separated by hyphen, correspond to host-form-location, e.g., H.S-MA-RI corresponded with H. spontaneum- Ptm-Rishon; 2: This isolate was omitted from the saprotrophic and necrotrophic growth analysis as it ceased growing in the course of the study; 3: Isolates that all three primers were used due to low sequences quality.
Table 2. Coefficient of variation (CV) and mean of necrotrophic (cm2/day) and saprotrophic [cm(diameter)/day] growth rates on detached leaves, and on Czapek Dox agar, respectively.
No. of IsolatesCVMean4
Nec. Growth Rate 1 Sap. Growth Rate 2 Nec. / Sap. 3 Nec. Growth Rate Sap. Growth Rate Nec. / Sap.
CategoryformaPtm1215.0934.7626. 530.22 A,*0.55 A,*0.39 A,*
Ptt1534.1334.4842.410.13 B0.45 B0.33 B
HostDomesticated 612.92 A,**26.9337.770.150.480.36
Wild 2145.95 B28.2842.090.170.500.35
1 Necrotrophic growth rate on detached leaves. 2 Saprotrophic growth rate on Czapek Dox agar. 3 Necrotrophic/Saprotrophic growth ratio. 4 Mean comparison is preformed within each category between different row pairs of the same column (e.g., average necrotrophic growth rate was significantly different between Ptm and Ptt in the forma category). Different letter mark means which are significantly different. *, ** indicate significant of Student's t-test (P (|t|) < 0.05) and Bartlett test (P (t) < 0.01), respectively.
Table 3. Correlation [Spearman's rho (ρ)] of necrotrophic growth rates of NB isolates between variety-pairs, and between necrotrophic and saprotrophic growth rates of a given variety.
Variety, medium
Variety, medium1 Noga'''Ma'anit''Sagiv''Barke'
‘Noga’
'Ma'anit'0.682*
'Sagiv'0.684*0.761*
'Barke'0.760*0.763*0.740*
'Czapek'0.424*0.448*0.405*0.507*
1 Variety refer to 'Noga','Ma'anit', 'Sagiv', and 'barke', and medium to 'Czapek'; * Significant value P (ρ) < 0.0001.
Table 4. Coefficient of variation and mean necrotrophic growth rates (detached leaf assay) of NB isolates on the four barley -cultivars.
VarietyCVAverage 1N
'Barke'47.9890.211A105
'Sagiv'55.4790.18AB105
'Ma'anit'61.2670.15AB105
‘Noga’55.1460.145B108
1 Data refer to the average of four repeats. Different letter mark means which are significantly different. by Tukey HSD test (P < 0.05).
Table 5. Oligonucleotide primers used in this study.
Primer NameSequence (5′→3′)Amplicon Size (In Base Pairs)
ptt-MAT1F1TGGAAGGATCGCAGACTGGAA1933-2161
ptt-MAT1R1TTCGTCGCGGAGGAGGCTTGT
ptt-MAT1-1F4952GGCAACAAGAGGTGAAGGTG1273
1 The primers were suitable for both MAT1-1-1 and MAT 1-2-1 as well [26]. 2 Used on isolates with low quality of sequence, with ptt-MAT1R.

