Article

Analysis on the Variation of Hydro-Meteorological Variables in the Yongding River Mountain Area Driven by Multiple Factors

1
State Key Laboratory of Hydrology-Water Resources and Hydraulic Engineering & Science, Nanjing Hydraulic Research Institute, Nanjing 210029, China
2
State Key Laboratory of Hydraulics and Mountain River Engineering & College of Water Resource and Hydropower, Sichuan University, Chengdu 610025, China
3
Yangtze Institute for Conservation and Development, Nanjing 210098, China
4
State Key Laboratory of Hydro-Science and Engineering, Department of Hydraulic Engineering, Tsinghua University, Beijing 100084, China
5
State Key Laboratory of Hydraulic Engineering Simulation and Safety, Tianjin University, Tianjin 300072, China
6
Yongding River Investment Co., Ltd., Beijing 100086, China
7
La Salle College Preparatory, Pasadena, CA 91107, USA
*
Author to whom correspondence should be addressed.
Remote Sens. 2021, 13(16), 3199; https://doi.org/10.3390/rs13163199
Submission received: 10 June 2021 / Revised: 2 August 2021 / Accepted: 5 August 2021 / Published: 12 August 2021
(This article belongs to the Special Issue Remote Sensing Applications for Water Scarcity Assessment)

Abstract

:
In recent decades, strong human activities have not only brought about climate change including both global warming and shifts in the weather patterns but have also caused anomalous variations of hydrological elements in different basins all around the world. Studying the mechanisms and causes of these hydrological variations scientifically is the basis for the management of water resources and the implementation of ecological protection. Therefore, taking the Yongding River mountain area as a representative watershed in China, the changes of different observed and simulated hydro-meteorological variables and their possible causes are analyzed on an inter-annual scale based on ground based observations and remotely sensed data of hydrology, meteorology and underlying surface characteristics from 1956 to 2016. The results show that the annual natural runoff of Guanting hydrological station in the main stream of the Yongding River, Cetian hydrological station and Xiangshuibao hydrological station in the tributary of the Yongding River all have a significant decreasing trend and abrupt changes, and all the abrupt change points of the annual natural runoff series of the three hydrological stations appear in the early 1980s. On the inter-annual scale, the water balance model with double parameters is unable to effectively simulate the natural surface runoff after the abrupt change points. The annual average precipitation after the abrupt change points decreases by no more than 10%, compared with that before the abrupt change points. However, the precipitation from July to August, which is the main runoff-production period, decreases by more than 25%, besides the intra-annual temporal distribution of precipitation becoming uniform and a significant decrease in effective rainfall, which is the source of the runoff. Meanwhile, the NDVI in the basin show an increasing trend, while the groundwater level and land water storage decrease significantly. These factors do not lead only to the continuous reduction of the annual natural runoff in the Yongding River mountain area from 1956 to 2016, but also result in significant changes of the hydro-meteorological relationship in the basin.

1. Introduction

Sustainable water supply is the basis of the ecosystem and human survival, and the climate system and characteristics of the underlying surface are the dominant factors for water resources in a basin [1,2]. In the past few decades, strong human activities have been rapidly changing the natural environment in different regions, having a profound impact on the water resources [3,4,5]. Due to the strong human activities, hydrological elements in many regions show an increasing or decreasing trend. This leads to the sharp decrease in river runoff in some arid areas, which will bring challenges to the management of water resources and ecological protection in the basin at present or in the future [6,7,8,9] Therefore, it is of great significance to analyze the variability and causes for the changes in different hydro-meteorological variables in order to understand the climate change induced changes of the hydrological cycle, as well as to improve the hydrological prediction, water-resource evaluation methods, water-resource planning and management, etc.
Climate change has a large influence on runoff and other hydro-meteorological variables by changing precipitation, potential evapotranspiration and snowmelt through changes in air temperature [10,11], while human activities affect runoff through land use/cover change, urbanization process, reservoir operation and direct exploitation of surface water and groundwater [12,13,14]. At present, with the increasing scarcity of water resources, especially in arid and semi-arid areas, the impact of climate change and land use/cover change on hydrological elements is more and more obvious, which has attracted the attention of hydrological researchers, decision makers and scholars [15]. The International Association of Hydrological Sciences (IAHS) has taken the evolution and attribution of river runoff under natural influences and human activities as one of its key research topics in recent years [16]. A large number of literatures are devoted to the study of hydrological variation and attribution identification of the runoff variation in different basins or regions. Pankaj summarized the main methods of attribution analysis for the runoff variation at present stage from four aspects of hydrological modeling approaches, conceptual approaches, analytical approaches and methods based on field observations, and then sorted out the conclusions of the runoff change contribution rate in some regions of the world in relevant literature [17]. Kuk conducted an attribution analysis on runoff changes through four methods and found that human activities are the main reasons for the runoff reduction in each state, which are mainly due to urbanization, agricultural development, rainwater utilization measures and water conservancy project construction in Indiana, New York, Arizona and Georgia in USA [18]. Wang quantitatively analyzed the causes of runoff change of main rivers in China and concluded that human activities are the main causes of the runoff reduction in northern China, while the runoff change in southern China is mainly affected by climate change, based on the RCCC-WBN model [19]. Yang analyzed that the significant decrease in water resources in the Yellow River Basin of China in the past half century is mainly due to the decrease in precipitation, the increase in evapotranspiration and the increase in irrigation water consumption [20]. Gao analyzed the attribution of runoff change in the Loess Plateau by the Budyko theory and concluded that the sensitivity of hydrological response to land use is higher than that to climate change, and the contribution rate of land use to runoff reduction in most areas of the Loess Plateau is about 60% [21]. Bao quantitatively identified the runoff change in Haihe River Basin based on the four element driving theory, and the results showed that the contribution rates of climate change and human activities to runoff reduction are 32–38% and 62–68%, respectively [22], which is similar to Xu’s research conclusion [23]. Although human induced changes observed for different elements of the hydrological cycle and their attribution have been widely analyzed, it is still not fully understood about the variation and its causes of some hydro-meteorological variables. At present, the researchers mainly focus on the diagnosis and attribution analysis of the observed runoff, but natural runoff which is obtained by adding the water amount utilized by human beings to the observed runoff is less discussed in literatures. As the key factor to characterize the precipitation redistribution and water production capacity, natural runoff is very important for analyzing the change of water resources from the source. Moreover, even though many papers have combined analyzing the relationship of runoff and precipitation, evapotranspiration, land use and other elements, few discussed the in-depth reasons of runoff change sufficiently with a variety of observed data and remotely sensed data, which restricts the systematic understanding and correct attribution of the driving mechanism for the runoff change.
The Yongding River is one of the seven major water systems of the Haihe River and the mother river of Beijing. Maintaining the health of the Yongding River and creating a flowing, clean and green Yongding River are the important foundation for ensuring the water safety in the capital and promoting the coordinated development of Beijing, Tianjin and Hebei. However, since the 1980s, the situation of the Yongding River has changed, and the problems of river cut-off and dry-up have become increasingly prominent, and the ecological corridor function of the river has been lost [24,25]. The development and the changes observed for different hydro-meteorological variables for the watershed of the Yongding River is representative for Northern China. Considering the declining trend of the surface runoff in the Yongding River mountain area (YRMA) since 1980s, the Haihe River Water Conservancy Commission proposed a “recover” treatment method for the natural runoff seriously affected by underlying surface [26]. Wang used the geomorphology-based hydrological model (GBHM) to analyze the impact of the land use/cover change on the runoff production in the Yongding River Basin (YRB). The results showed that the increase in woodland and grassland would reduce the runoff production in the basin [27]. Zhang used the SWAT model to simulate the monthly runoff process in the upper reaches of the Yongding River from 1957 to 2000 and pointed out that climate change is the dominant factor for the runoff change in the basin from 1980 to 2000 [28]. Based on the Budyko hypothesis, Hou used the climate elasticity coefficient method to analyze the driving factors for the runoff change in the YRB and pointed out that the human activities have been the main factors for the significant decline of the observed runoff in the YRB since the 1980s [29]. It can be seen that these studies mainly focus on the observed runoff changes of the Yongding River, but the conclusions are different or even contradictory. Considering that there still exist many factors not yet properly understood, as well as the important geographical location, resource ecology and historical and cultural significance of the Yongding River, the aim of this paper is to analyze the changes in natural runoff and other hydro-meteorological variables for the YRMA in recent decades, as well as to understand the causes of the observed changes using a large variety of ground-based and remotely sensed observations. First, the inter-annual variation of surface runoff, precipitation and evaporation capacity in the YRMA are explored. Then, the changes in the relationship between precipitation, vegetation cover and runoff are analyzed, also by utilizing a water balance model. Finally, the causes of the observed changes are investigated by analyzing the temporal distribution of the precipitation, change of vegetation cover and groundwater exploitation.

2. Materials

2.1. Diagnosis Methods for the Variability of Hydrological Elements

Time series of different hydrological variables are often non-stationary due to trend and abrupt changes. At present, there are several statistical tools to analyze the variability of these time series, however, most of them cannot detect the trend and abrupt changes at the same time, and the results obtained by different methods are not the same. In order to improve the robustness and reliability of the diagnosis methods for the variability of hydrological elements, a process called “Hydrological Alteration Diagnosis System” based on multiple methods is proposed by Xie [30], including three steps, that is preliminary diagnosis, detailed diagnosis and comprehensive diagnosis.
Preliminary diagnosis: preliminary diagnosis checks the variability of a sequence according to the Hurst method [31] to determine whether there is an abrupt change in the sequence.
Detailed diagnosis: if the preliminary diagnosis confirms that there is a change in the sequence, the detailed diagnosis will be used for further analysis, that is, multiple statistical tests are used to further diagnose the trend and abrupt changes of the sequence. Among them, slide F-test, slide T-test, L-H test, ordered clustering test, R/S test and optimal segmentation are used for analyzing abrupt changes in the time series, while Pearson, Spearman and Kendall correlation coefficients are used for trend analysis [30]. If a test method judges that the trend or abrupt change of the sequence is significant, the test result is recorded as +1; if it is found to be non-significant, then the test result is recorded as –1; if it cannot be judged, then the test result is recorded as 0.
Comprehensive diagnosis: comprehensive diagnosis means comprehensively analyzing the detailed diagnosis results. When the sum of all the results obtained by the trend test or abrupt change test in detailed diagnosis is greater than 1, the change of the sequence is considered significant, otherwise it is not significant. If the abrupt change points as a results of the detailed diagnosis are different, the point of year with the most occurrences can be regarded as the year in which the abrupt change of natural runoff occurred.
After finding the abrupt change points in the series of hydrological elements, the time series before the abrupt change points can be regarded as the reference period. While the series after the abrupt change points can be regarded as the variation period.

2.2. Water Balance Model for River Basins

Basin water balance model is an empirical or semi-empirical hydrological model with the advantages of a simple structure and few parameters. At present, there are a series of water balance models, which are widely used in the simulation of the hydrological process and the attribution analysis of the runoff variability from daily to multi-year time-scales in basins with different topography and climates. In this study, the water balance model with double parameters (WBM-DP) [32] is used to simulate the annual runoff of the YRB. The WBM-DP is composed of three equations. The first is the water balance equation, which is used to describe the relationship between hydro-meteorological variables at adjacent times. The second is the coupled water–energy balance equation, used to describe the actual evapotranspiration under the control of the evaporation capacity and the available water supply such as precipitation. The last is the storage–discharge equation, used to describe the relationship between the runoff at the outlet section and the available water supply such as precipitation. The principle and methods of the model are described as follows.
Water balance equation: taking the water storage of the basin as the state variable, the water balance relationship at the beginning and end of the period is expressed as follows.
S t = S t 1 + P t + I t E t Q t
where S t 1 and S t are the water storages of the basin at the beginning and end of a certain period, respectively; P t , E t and Q t represent the precipitation, actual evapotranspiration and runoff in this period, respectively; I t is the inflowing water in this period.
The coupled water–energy balance equation is shown as follows. The actual evapotranspiration in the basin is calculated by the Choudhury–Yang formula [33].
E t = E P t H t ( H t n + E P t n ) 1 / n
where EP is the atmospheric evapotranspiration capacity in a certain period; H is the amount of available water for evapotranspiration in this period; n is a parameter reflecting the influence of underlying surface characteristics on evapotranspiration; the larger n is, the more sensitive EP is to the change of P, especially in arid area. For a basin, H is the sum of the water storage (S) in the basin at the beginning of this period, the precipitation (P) during this period and the inflow water (I), i.e.,
H t = P t + I t + S t 1
The storage–discharge equation adopts the hyperbolic tangent function to express the relationship between the runoff and the amount of water deducting evapotranspiration.
Q t = ( H t E t ) tanh ( H t E t S C )
where SC is the storage–discharge coefficient of the basin. The value of SC is small in humid area and large in arid area.
By combining Equations (2)–(4), the times series of annual runoff, evapotranspiration and water storage can be obtained on the annual time scale. The WBM-DP can be used to simulate the runoff and evapotranspiration processes on an annual or monthly scale. In the paper, the only two parameters of the model were calibrated through the shuffled complex evolution method developed by the University of Arizona [34]. The annual natural runoff in reference period and in variation period was simulated separately, with the model parameters calibrated for each period separately. Then the water balance error and Nash–Sutcliffe efficiency can be obtained:
R e = 1 i = 1 i = N Q t s / i = 1 i = N Q t o
N S E = 1 - i = 1 i = N ( Q t s Q t o ) 2 / i = 1 i = N ( Q t o Q ¯ o ) 2
where Re is water balance error; NSE is the Nash–Sutcliffe efficiency; Q t o and Q t s are the observed and simulated runoff in the tth month, respectively; Q ¯ o is the average value of Q t o in the period; N is the total number of months in the period.

2.3. Traditional Runoff Restoration Method

For watersheds influenced by human activities caused obvious changes in the runoff, the runoff restore should be performed. The runoff restore is calculated by using the traditional runoff restoration method [35]. The natural runoff of the hydrological stations of the YRMA can be obtained by adding the water amount utilized by human beings to the observed runoff. The formula of natural runoff calculation is as follows.
W = i = 1 7 W i
where W is the natural runoff after restoration; W1 is the observed runoff; W2 is the agricultural irrigation water consumption; W3 is industrial water consumption; W4 is domestic water consumption; W5 is the variation amount of the storage capacity of water storage project; W6 is the runoff influence by soil and water conservation measures; W7 is the runoff inter basin water transfer. Section 3.2. gives a detailed overview on the data necessary for the calculations.

2.4. The Transfer Matrix of Land Use Types

The land-use transfer matrix is an effective tool to represent the transfer area of different land use types in a certain period and can present the overall transfer situation of land use [36]. On the ArcGIS platform, the land use data in 1980 and 2015 are statistically analyzed to obtain the spatio-temporal pattern variations of land use from 1980 to 2015. The transfer-out area of one land use type mainly reflects the area of a certain land use type transforms into another land use type from 1980 to 2015. While the meaning of transfer-in area of one land use type reflects the area of a certain land use type transformed into by another land use type from 1980 to 2015. The proportion of different land use types refers to the proportion of different land use types in the total land area in a certain year. The calculation formulas is as follows.
P i = T i j j = 1 n T i j × 100 %
In the formulas, Pi is the proportion of different land use types in the total land area; Tij is the land area of one land use type; i is the certain year of 1980 or 2015; j is the type of land use, including cultivated land, woodland, grassland, water area, construction land and unused land.

2.5. Slope Analysis Method

In this study, an ordinary least squares (OLS) method based on grid size is used to analyze the climate and vegetation trend on interannual time scales. The calculation equation for trend analysis is:
θ s l o p e = n × i = 1 n i × Y i i = 1 n i i = 1 n Y i n × i = 1 n i 2 ( i = 1 n i ) 2
where θ s l o p e is the slope of the linear regression, indicating the changing trend of NDVI; n represents the total number of the studied years, and it is 35 in this study; and Yi is the value of NDVI in the ith year.

3. Study Area and Data

3.1. Study Area

The YRB is located in the Middle East of China and the northwest of the Haihe River Basin (111°58′ E–116°22′ E, 38°50′ N–41°16′ N), flowing through five provincial administrative regions of Inner Mongolia, Shanxi, Hebei, Beijing and Tianjin. Its catchment area is about 47,000 km2, accounting for 14.7% of the Haihe River system. In 2016, the total population in the basin was about 8.13 million, and the urbanization rate was 58.3%. The primary tributaries of the YRB upper reaches are the Sanggan River and the Yanghe River, which are called Yongding River after the confluence. The YRB has a semi-humid and semi-arid monsoon climate, with an annual average precipitation of 360–650 mm. The precipitation from June to August accounts for about 80% of the annual average precipitation.
Guanting hydrological station is located at the downstream of Guanting Reservoir. The basin in the upper reaches of the Guanting Reservoir is a mountainous area, Yongding River mountain Area (YRMA), with an area of 45,100 km2, accounting for 95.8% of the whole basin, which is the main runoff-producing area of the basin. The Cetian hydrological station and Xiangshuibao hydrological station are located at the downstream of Cetian Reservoir of Sanggan River and Xiangshuibao Reservoir of Yanghe River, with the catchment area of 17,100 and 14,500 km2, respectively (Figure 1).

3.2. Data

In this paper we utilize a large dataset of various ground-based and remotely sensed observations, such as meteorology and hydrology, exploitation and utilization of water resources, land use, vegetation cover and land water storage. The following data are used in the study.
(1)
Meteorological data: the daily surface observation data (monthly precipitation, maximum/minimum temperature, relative humidity, average wind speed, sunshine) at 14 meteorological stations (Beijing, Huailai, Zhangjiakou, Zhangbei, Jining, Yuxian, Yangquan, Datong, Youyu, Wutaishan, Youyu, Wuzhai, Hequ, and Yuanping) in the study area from 1956 to 2016, as shown in Figure 1 (http://cdc.cma.gov.cn/home.do/, accessed on 5 August 2020).
(2)
Areal precipitation data: the areal precipitation data in the YRMA from 1956 to 2016 based on the precipitation data of the meteorological stations shown in Figure 1, obtained by the Thiessen polygon method.
(3)
Potential evapotranspiration data: the potential evapotranspiration at each station is calculated by the Penman–Monteith [37] formula based on the meteorological data of meteorological stations, and the averaged surface potential evapotranspiration in the study area is obtained by the Thiessen polygons method.
(4)
Observed runoff data: according to the Hydrological Data of Haihe River Basin of Annual Hydrological Report of China [38], the observed runoff of Cetian, Xiangshuibao, Guanting hydrological stations from 1956 to 2016 are selected.
(5)
Water resources exploitation and utilization data: according to the water resource communiques of Shanxi, Beijing, Hebei and evaluation of water resources (http://slt.shanxi.gov.cn/zncs/szyc/szygb/; http://slt.hebei.gov.cn/dynamic/search.jsp; http://swj.beijing.gov.cn/zwgk/szygb/, accessed on 20 October 2020) and Evaluation of water resources in Haihe River Basin [26], the exploitation and utilization data of water resources in YRMA are selected, including the total amount of water supply and consumption, the consumption of different water users and the water supply from surface and underground.
(6)
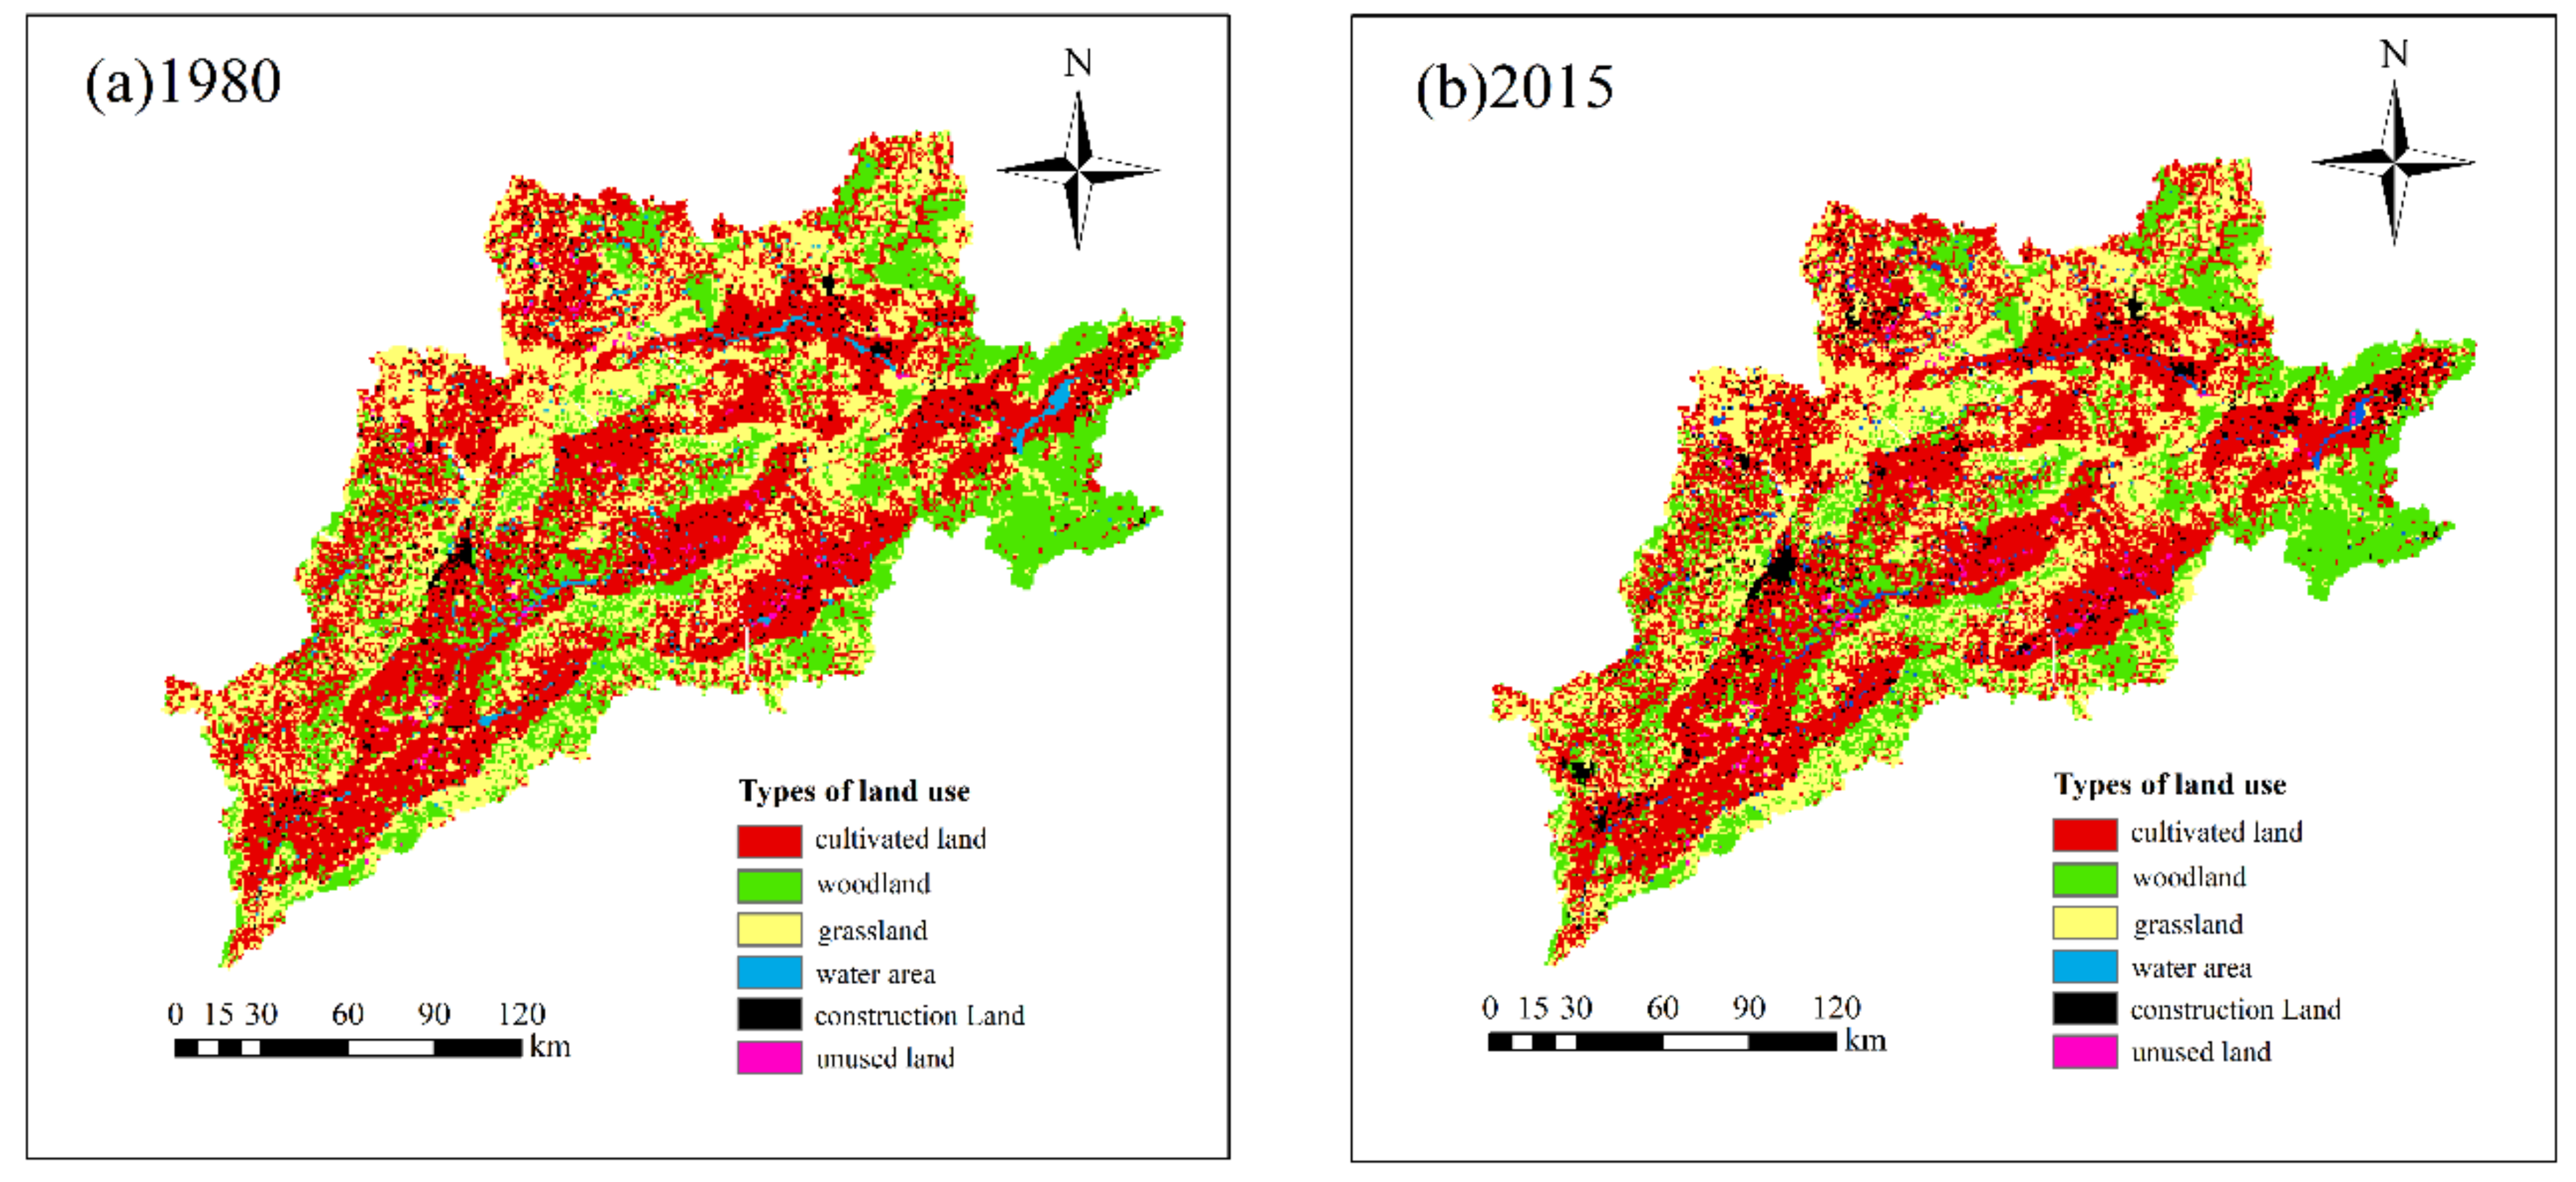
Land use data: the remotely sensed data of land use in the YRB in 1980 and 2015 are obtained, mainly including crop land, forest land, grassland, water area, land for industrial, construction land, as well as unused land, with the data resolution of 1 km. The land use data are based on Landsat TM/ETM remotely sensed image in 1980 and 2015, interpreted by ArcGIS platform. (https://www.resdc.cn/data.aspx?DATAID=184/, accessed on 8 November 2020).
(7)
Vegetation data: the monthly normalized vegetation index (NDVI) data from 1982 to 2016 are obtained. The monthly NDVI data from 1982 to 2015 is from the Global Inventor Modeling and Mapping Studies (GIMMS) NDVI data set, with a resolution of 8 km and a temporal resolution of 15 days (https://ecocast.arc.nasa.gov/data/pub/gimms/3g.v1/, accessed on 14 November 2020). The monthly NDVI values were obtained by using the maximum value composite (MVC) method [39]. The monthly NDVI data in 2016 is from the website of resources and environment science and data center, which is based on the SPOT/VEGETATION, MODIS and other satellite remotely sensed images, with a resolution of 1 km and a temporal resolution of one month (https://www.resdc.cn/DOI/doi.aspx?DOIid=50, accessed on 14 November 2020)). It could be used after unifying the resolution of GIMMS NDVI and MODIS NDVI data [40].
(8)
GRACE data: The GRACE data from April of 2002 to December of 2016 in the YRMA are used to study the long-term spatiotemporal changes of terrestrial water storage anomaly (TWSA) [41]. The TWSA data is released by the University of Texas with a spatial resolution of 0.25° (http://www2.csr.utexas.edu/grace/RL06_mascons.html/, accessed on 20 December 2020). Among them, 33 months of data are missing, which are interpolated by the cubic spline interpolation method [42]. According to the topographic map of the basin, the area weighted average is carried out, and the monthly average land water storage change of the basin is obtained.

4. Results and Discussion

4.1. Changes of the Annual Runoff and other Hydrological Elements

The inter-annual variations of natural and observed runoff in the YRMA from 1956 to 2016 are shown in Figure 2. It can be seen that there is an obvious decreasing trend in the annual observed runoff of the three hydrological stations downstream of the Cetian, Xiangshuibao, Guanting Reservoirs in the YRMA. The variabilities of the annual natural runoff series of the Guanting hydrological station, the Cetian hydrological station and the Xiangshuibao hydrological station are tested at the 95% confidence level by using the diagnosis system for hydrological variability. The results in Table 1 show that the annual natural runoff of the three hydrological stations all has a significant decreasing trend and abrupt changes, and the abrupt change points are in 1983, 1982 and 1983, respectively. Considering that the abrupt change points of natural runoff in the three hydrological stations are almost the same, 1983 is regarded as the abrupt change point for the hydrological stations, and the periods of 1956–1982 and 1983–2016 are recorded as the reference period and the variation period, respectively. The mean values of annual natural and observed runoff of the Guanting hydrological station, the Cetian hydrological station and the Xiangshuibao hydrological station before and after the abrupt change point are shown in Table 2, as well as the mean values of annual precipitation and evaporation capacity at reference period and variation period. Since the 1980s, the surface natural runoff of the above three hydrological stations in the YRMA has declined significantly, indicating that the water production capacity of the basin has greatly decreased. The annual average natural runoff of the Guanting hydrological station is 43.4 mm in the reference period and 21.2 mm in the variation period, decreased by 51.1%. For the Cetian hydrological station and the Xiangshuibao hydrological station, they are 37.8 mm, 22.5, 40.5% and 50.1 mm, 21.9 mm, 57.1%, respectively. Compared with the natural runoff, the reduction of the observed runoff in each hydrological station is more severe. From the reference period to the variation period, the reduction ratios of annual average natural runoff of Guanting hydrological station, Cetian hydrological station and Xiangshuibao hydrological station are 78.9%, 85.3% and 70.8%, respectively.
The annual average precipitation in the Guanting Reservoir basin is 432.2 mm in the reference period and 395.5 mm in the variation period, with a decrease in about 8.5%. For the basins of the Cetian Reservoir and the Xiangshuibao Reservoir, the reduction rates are 9.1% and 8.9%, respectively. At the same time, the potential evapotranspiration in the basin of each hydrological station in the variation period also decreases in different degrees compared with the reference period. The annual potential evapotranspiration in the Guanting Reservoir basin is 1004.4 mm in the reference period and 962.9 mm in the variation period, with a decrease in about 4.1%. The reduction rates in the basins of Cetian and Xiangshuibao reservoirs are 2.4% and 6.0%, respectively. As the reduction of annual precipitation is higher than that of potential evapotranspiration, the average drought index (the ratio of annual potential evapotranspiration to precipitation) of the YRMA in the variation period increases compared with that in the reference period, and the annual average drought indexes in the basins of the Guanting Reservoir, the Cetian Reservoir and the Xiangshuibao Reservoir increase by 0.11, 0.18 and 0.08, respectively.

4.2. Variations of Hydro-Meteorological Relationships in the Basin

The variation of the hydrological elements in the YRMA from 1956 to 2016 does not show only the sharp decrease in the natural runoff, but also the significant change of the hydro-meteorological relationship and the coupled water–energy balance on an annual scale.
Figure 3 shows the scatter plot and linear regression relationship between the annual precipitation and natural runoff in the main and tributary stream sections in the YRMA in the reference period and variation period. It can be seen that the annual precipitation–runoff scattered points in the variation period are basically below those in the reference period, and the slope of linear regression line in the variation period is significantly lower than that in the reference period. Thus the runoff production capacity of the YRMA decreases greatly under the same annual precipitation conditions. The average annual runoff coefficients at the Guanting Reservoir station before and after the abrupt change point are 0.10 and 0.05, respectively, and that at the Xiangshuibao Reservoir station are 0.12 and 0.06, respectively. The relative reductions of the natural runoff of the Guanting and Xiangshuibao hydrological stations are both close to 50%. For the Cetian hydrological station, they are 0.09, 0.06 and 33.3%, respectively. This means that before the 1980s, about 10% of the annual precipitation in the YRMA could be converted into natural water resources. Since the 1980s, this proportion has reduced to about 5%. At the same time, the scatter of annual precipitation–runoff of the three hydrological stations in the variation period is more dispersed than that in the reference period. The determination coefficient of corresponding linear regression equation of annual precipitation–runoff decreases from 0.57, 0.63 and 0.59 in the reference period to 0.10, 0.17 and 0.07 in the variation period respectively, which means that the contribution of the annual precipitation to the natural runoff is greatly reduced.
The natural water production capacity of the YRMA is greatly reduced, and the reduction of natural runoff is significantly higher than the annual precipitation. This reflects that the natural runoff converted from precipitation supply is decreasing, while the water consumption is increasing. It shows that the relationship among precipitation, runoff and evapotranspiration has changed, which means that the precipitation redistribution and the relationship of coupled water–energy balance have changed. At the same time, it should be recognized that the change of the coupled water–energy balance in the YRMA does not show only the increase in the water-consumption proportion in the water supply, but also may involve the significant change of the water–energy response process and mechanism. In order to illustrate this problem, the WBM-DP is used to simulate the annual natural runoff of the three hydrological stations. According to the abrupt change points of annual natural runoff in Section 4.1, the models for the reference period and the variation period are separately calibrated. Figure 4 shows the simulation results of the natural runoff at each hydrological station in 1956–1982 and 1983–2016. In the reference period, the accuracy of WBM-DP is acceptable, and the simulation result is good. The water balance error at each hydrological station is close to zero, and the Nash–Sutcliffe efficiency (NSE) coefficients are 0.78, 0.82 and 0.89, respectively. The model parameters are also within the normal limits. This indicates that the relationship between the actual evapotranspiration and natural runoff with the annual precipitation and atmospheric evaporation capacity in the YRMA basically conforms to the Budyko hypothesis and the storage–discharge equation. However, the simulation result of WBM-DP in the variation period is poor, and the NSE values of the three hydrological stations are only 0.46, 0.58 and 0.55, respectively. Especially since the mid-1990s, the difference between the simulated value and the actual value of the natural runoff has been particularly significant. Taking Guanting hydrological station as an example, the WBM-DP fails to accurately simulate the natural annual runoff process after 2000, and the simulated value is obviously higher than the actual value. This indicates that the influencing factors and mechanisms of the natural runoff and evapotranspiration in the basin are more complex during the variation period, so the relationship with the annual precipitation and atmospheric evaporation capacity can no longer be described by the Budyko hypothesis and the storage–discharge equation. Only by changing the parameters of the WBM-DP, it is impossible to adapt to the significant changes of the coupled water–energy balance.

4.3. Driving Factors for the Change of Hydro-Meteorological Relationship

Understanding the dominant driver factors of hydrological change is essential for water resources management. Similar to natural runoff, non-stationary trends also exists in hydrological drivers. Currently, the hydrological drivers of variation in streamflow have been widely discussed all around the world [43,44]. In undisturbed basins, changes in runoff are likely primarily due to climatic factors [45]. While in human-impacted basins, development and land cover change can be the most important drivers for runoff variation [46,47]. The relative importance of hydrologic drivers varies spatially across different types of basins. As a representative arid watershed in Northern China, the variation and its causes of hydro-meteorological variables of the YRB can be analyzed from the aspects of precipitation, land use, water utilization, et al. The detailed analysis and discussion are shown below.

4.3.1. Intra-Annual Temporal Distribution of Precipitation

Precipitation is the basic driving factor for the hydrological process in a river basin, and its spatio-temporal distribution characteristics have a profound impact on the runoff. Previous studies have pointed out that under the premise of a slight decrease in the atmospheric evaporation capacity, the annual average precipitation in the variation period of the YRMA is reduced by less than 10% relative to the reference period, but the annual average natural runoff in the main stream is reduced by more than 40% and that in the tributaries is reduced by more than 50%. Although the elastic response coefficient of annual runoff to precipitation is significantly greater than 1 in many cases [25], it is still intriguing. Since the YRMA is located in North China influenced by the monsoon climate, the precipitation in a year is highly concentrated in the flood season (from June to September), and thus the river runoff is also mainly concentrated in the flood season. The precipitation in the flood season of the YRMA determines the scale of the annual runoff to a considerable extent, so the change of the intra-annual temporal distribution of precipitation and its impact on water production should be paid attention to. Figure 5 shows the intra-annual precipitation distribution in the basins of the Guanting, Cetian and Xiangshuibao reservoir control basin in the reference and change periods. The precipitation difference between the variation period and the reference period is significant mainly from July to August, while there is little difference in other months. From 1983 to 2016, the precipitation in the basins of the Guanting Reservoir, Cetian Reservoir and Xiangshuibao Reservoir from July to August decreases by 26.3%, 27.8% and 26.5%, respectively, compared with that from 1956 to 1982. As a result, the nonuniformity coefficient of monthly precipitation in the three control basins decreases from 1.12, 1.16 and 1.14 to 0.95, 0.96 and 0.96, respectively, and the precipitation concentricity in a year decreases.
It can also be seen from Figure 5 that, except for individual cases, the monthly average natural runoff in the three control basins of the Guanting Reservoir, the Cetian Reservoir and the Xiangshuibao Reservoir during the variation period decreases with varying degrees, compared with that in the reference period. From July to September, the natural runoff of the three hydrological stations decreases by 10.67, 9.68 and 12.79 mm, respectively (the relative reductions are 56.7%, 51.0% and 61.2%, respectively), accounting for 47.9%, 59.2% and 43.9% of the annual reduction, respectively. The nonuniformity coefficient of the natural runoff in the three hydrological stations decrease from 0.67, 0.56 and 0.60 during 1956–1982 to 0.57, 0.55 and 0.50 during 1983–2016, respectively. It shows that the intra-annual distribution of the natural runoff in each hydrological station tends to be even. Obviously, the decline of the natural runoff from July to September in the YRMA has a clear correspondence with the substantial decrease in precipitation from July to August.
Furthermore, the daily precipitation from July to August in the reference period and in the variation period in the YRMA are analyzed, respectively, and then the frequency histogram of days with different-level daily precipitation in the control basin of each hydrological station from July to August is plotted (Figure 6). Compared with 1956–1982, the number of days with daily precipitation less than 0.1 mm, that is, the number of days without rainfall, increases significantly in 1983–2016; the proportion of days with daily precipitation between 0.1 and 2 mm does not change significantly; the ones with daily precipitation in 2–10 mm and 10–50 mm both decrease significantly, while the one with daily precipitation over 50 mm is basically zero. This shows that compared with the reference period, the number of effective precipitation days for the runoff production in the YRB has been significantly reduced during the variation period. The daily average precipitation in the Guanting Reservoir basin decreases from 4.3 mm during 1956–1982 to 2.9 mm during 1983–2016, the variation coefficient decreases from 2.3 to 1.9, and the kurtosis coefficient decreases from 73.3 to 18.3 (Table 3). The other two control basins also show similar trends. It shows that compared with 1956–1982, the daily average precipitation in the YRMA in 1983–2016 decreases significantly, the concentration decreases and the distribution becomes uniform. The changes of the precipitation from July to August in the YRB obviously have an important influence on the runoff production. The decreases of precipitation intensity and concentration will be beneficial for increasing the vegetation interception and reducing the excess runoff by throughfall and surface infiltration. As a result, the rainfall flowing into the vadose zone will move more slowly, but the proportion of returning to the atmosphere through vegetation transpiration and soil evapotranspiration will also increase, so the groundwater infiltration recharge by rainfall may not increase or even decrease. Therefore, the total result is an increase in evapotranspiration and a decrease in runoff production. As a result of the decrease in total precipitation and its uniform distribution, as well as the increase in evaporation in the basins, the natural runoff of the basins could decrease.

4.3.2. Changes of Vegetation Cover

Land use and vegetation cover are important para meters to reflect the characteristics of the underlying surface, and their changes have an important impact on the water cycle and the associated processes. The land use types in the YRMA mainly include crop land, forest land, grassland, water area, construction land and unused land, in which the crop land, forest land and grassland cover most of the land. Figure 7 shows the distributions of land use types in the study area in 1980 and 2015, which are used to show the land use conditions in the reference period and the variation period, respectively. Compared with 1980, the forestland area increases by 2364.4 km2 in 2015, with a relative increase in 34.6%. The areas of crop land and grassland respectively decrease by 1610.1 and 1056.8 km2, with a relative decrease in 7.7% and 7.5%, respectively. Urban and rural construction land increase by 926.9 km2, with a relative increase in 116.2%. According to the transfer matrix of land use area in the YRMA shown in Table 4, from 1980 to 2015, there is mainly the mutual transfer of crop land, forest land and grassland, as well as the conversion from parts of crop land and grassland into construction land. As a result, the proportion of the area of cultivated land to the whole basin area decreases from 47.3% in 1980 to 43.7% in 2015, but the proportion of the total area of forest land and grassland increased from 47.3% to 50.2%, and that of the construction land increases from 1.8% to 3.9%. The proportion of conversion area of different land use types to the whole basin area is small and varied between 0.4% to 5.3%. Therefore, in general, the land use pattern of the YRMA changed little compared 1980 with 2015.
In order to further study the change law of the vegetation in the YRMA, the NDVI data during 1982–2016 are analyzed. Figure 8 shows the variation of the annual average and maximum NDVI in the YRMA during 1982–2016. The annual average NDVI in the YRMA during 1982–2016 showed a significant increasing trend (at the confidence level of 99%), and it increased by 0.0013 per year, with the minimum value of 0.272 (1985) and the maximum value of 0.341 (2016). The fluctuation range of the spatial change rate of annual average NDVI obtained by the slope analysis method is −0.08% a−1–0.33% a−1. The areas where the annual average NDVI show increasing and decreasing trends account for 95.36% and 4.64% of the total area, respectively. Among them, the area with a faster growth (slope ≥ 2 × 10⁻³ a−1) accounts for about 12.32%. From 1982 to 2016, the annual maximum NDVI in the YRMA showed a significant increasing trend (at the confidence level of 99%), with an average increase in 0.0023 a−1; the minimum value is 0.459 (1983), the maximum value is 0.607 (2016); the fluctuation range of spatial change rate is −0.18% a−1–0.6% a−1. In addition, in only 8.12% of this area the annual maximum NDVI shows a decreasing trend.
Comparing the data of land use in 1980 and 2015 as well as the NDVI data in 1982 and 2015, the changes of NDVI in crop land, woodland and grass are analyzed. The annual average NDVI of crop land, forest land and grassland increases from 0.282, 0.367 and 0.254 in 1982 to 0.327, 0.431 and 0.296 in 2016, with the growth rates of 13.2%, 17.4% and 16.3%, respectively. The annual maximum NDVI of crop land, forest land and grassland increase from 0.488, 0.627 and 0.404 in 1982 to 0.587, 0.801 and 0.506 in 2016, with growth rates of 20.2%, 27.8% and 25.2%, respectively. It can be seen that the NDVI all increases significantly under different land use types, and the most obvious increase in NDVI is in woodland, followed by grassland, and finally crop land. To a certain extent, due to meteorological factors such as precipitation and temperature and human activities such as the vegetation conservation and the soil and water conservation in the basin, as well as the promotion of irrigation measures and the management improvement of agriculture, forestry and grassland, the vegetation cover under various land use types increased, so that the annual and seasonal average NDVIs in the growth period are all increasing.
Therefore, from 1982 to 2016, the vegetation in the YRMA increased significantly, showing a clear trend of greening, which is consistent with the land cover change after the policy implementation of “returning farmland to forest and grassland” in the North China Plain and the economic and social development, and it is also consistent with the development trend of land use [48,49,50].
The vegetation change in the YRMA is simultaneously affected by strong human activities. The changes of precipitation and temperature will inevitably affect the vegetation growth. At the same time, as one of the key areas for soil erosion control in China, the vegetation-cover changes in the study area are also affected by the large-scale soil and water conservation measures. As for the impact of strong human activities on the vegetation-cover change, that which one is dominant is not the focus of this paper. In any case, since the 1980s, the vegetation cover in the YRMA has been increasing significantly in general. The vegetation-cover change causes the change of the underlying surface conditions, which will inevitably affect the hydrological cycle in the basin and then lead to the change of the river runoff, which has been confirmed by a large number of studies [51,52,53,54,55,56,57]. However, whether the increase in vegetation cover increases or decreases the river runoff is closely related to the geographical and climatic characteristics. Some studies have suggested that because of the humid climate in the upper reaches of the Yangtze River, the increase in forest vegetation can strengthen the water conservation capacity, and will not increase the actual evapotranspiration, and then increase the runoff. However, there are more reports in northern China about that the increase in vegetation cover leads to the decrease in water production in the basin. The main physical mechanism is that the increase in vegetation cover strengthens the ability of vegetation canopy to intercept the precipitation, increases the evapotranspiration of forest and grass vegetation and strengthens the consumption of precipitation, soil water and groundwater, which is not good for the production of the surface runoff and subsurface flow. For example, Liu X. et al. pointed out that in the semi-humid or semi-arid loess area, the runoff coefficient and flood yield coefficient will be reduced with the improvement of forest and grass vegetation, and the more arid the climate is, the more the runoff or flood will decrease [54]. It is found that the large-scale vegetation restoration aggravates the water resource consumption in the Loess Plateau, resulting in a decrease in the runoff production. Zhao et al. integrated the Gravity Recovery and Climate Experiment (GRACE) land water storage data and dynamic vegetation model simulation, and it was found that the large-scale artificial vegetation restoration project consumes the land water storage capacity of Maowusu Sand Land in the northern China at the rate of 17 mm per year [58]. The YRMA is adjacent to the middle reaches of the Yellow River, and the climate characteristics in these two areas are similar. Therefore, in this study the annual average NDVI and annual maximum NDVI series are compared with the natural runoff series from 1982 to 2016 in the YRMA (Figure 9), and they show opposite inter-annual variation trends, with a significant negative correlation. This indicates that the change of the vegetation cover may be an important reason for the decrease in the natural runoff in the YRMA.

4.3.3. Groundwater Exploitation

In addition to the intra-annual temporal distribution characteristics of precipitation and the vegetation cover change, another important reason for the decrease in the natural runoff and the change of hydro-meteorological relationship in the YRMA is the high-intensity utilization of water resources. Although the water consumption caused by the economic and social water consumption has been taken into account in calculating the restored natural runoff, because the economic and social water consumption in the Yongding River basin is highly dependent on groundwater resources, the increase in economic and social water consumptions will not only reduce the observed runoff, but also affect the natural water production of the basin due to its impact on the vadose zone and groundwater aquifer.
It can be seen from Figure 10 that the exploitation of groundwater in the YRB is relatively weak before the 1970s, with an annual extraction volume of less than 200 million m3. In general, the groundwater depth is 1.5–3.0 m, with a thin vadose zone. Therefore, in the case of large-scale precipitation, it is easier for the excess infiltration of rainfall to replenish the groundwater through unsaturated aquifer, and it is also possible to saturate the vadose zone. However, since the 1970s, the economic and social water demand in the basin has been increasing. It can be seen from Figure 11 that the social water consumption in the basins of the Guanting, Cetian and Xiangshuibao reservoirs from 1983 to 2016 is significantly higher than that from 1956 to 1982. According to statistics analysis, in the control basins of the three hydrological stations, the annual average economic and social water consumption in the variation period increases by 209 million m3, 154 million m3 and 22 million m3 compared with that in the reference period. At the same time, the amount of surface water resources in the YRMA continues to decline, so the amount of groundwater exploitation is increasing. The annual exploitation amount was 710 million m3 in 1980, which reached 1.2 billion m3 in 1990, further increased to 1.36 billion m3 in 2012, and then began to decline. It was 1.13 billion m3 in 2016. According to the “Haihe River Basin Water Resources Bulletin” and other data during 2010–2016, under current conditions, the proportion of the groundwater supply in the total water supply is as high as 56.5–67.1% in the YRMA. There are varying degrees of groundwater overexploitation in the urban areas of Datong City and Zhangjiakou City and the surrounding areas of Shanyin, Huairen and other cities, and in some irrigation areas the groundwater is also exploited. As a result, the groundwater level continues to sink, and the maximum buried depth reached more than 60 m in the 2010s [59]. Although the time series of the anomaly changes of GRACE land water storage data obtained is relatively short, it can still provide important evidences for the analysis of the groundwater overexploitation in the YRMA. Figure 12 shows that the overall decline trend of land water storages in the YRMA in 2002–2016 is very obvious and sustainable. According to statistical analysis, the land water storage in the YRMA decreased by about 0.71 mm per month and 8.4 mm per year on average. From January of 2002 to December of 2016, the land water storage of the YRMA decreased by 172.5 mm. The decrease in the land water storage in the YRMA is not only closely related to the groundwater exploitation, but also may be affected by the increase in the vegetation cover.
In the YRMA, the long-term overexploitation of groundwater has many influences on the hydro-meteorological relationship. First of all, the drastic decline in the groundwater level means that the thickness of the current vadose zone may be several times or even tens of times thicker than that before 1980s, which greatly improves the water holding capacity of the vadose zone. It is difficult for the vadose zone to be filled with water even under the condition of large-scale rainfall. In addition, it is difficult to replenish the groundwater through infiltrations when the regional precipitation intensity is decreasing, and therefore the precipitation mostly stays in the vadose zone and is consumed through the vegetation evapotranspiration or soil evapotranspiration. Secondly, the continuous decline of the groundwater level will change the recharge and discharge relationship between groundwater and water in river channels, and the lateral recharge of groundwater to the river runoff will weaken, disappear, or even be recharged by the river runoff. To this end, in general, the long-term overexploitation of groundwater will increase the proportion of water consumption, resulting in the reduction of natural runoff production. Zhang believes that the groundwater exploitation is the main factor for the runoff reduction in the YRB [59].

5. Conclusions

This study analyses the changes of natural runoff in the main and tributaries of the Yongding River from 1956 to 2016, reveals the change of the hydro-meteorological relationship in the basin around the 1980s, and comprehensively analyzes the important driving mechanism leading to the significant decline of the natural runoff and the change of the hydro-meteorological relationship from three aspects, including the intra-annual temporal distribution of precipitation, the change of vegetation cover and the groundwater exploitation. The main conclusions are as follows.
(1)
From 1956 to 2016, the annual natural runoff of the Guanting hydrological station located in the main stream, Cetian hydrological station and Xiangshuibao hydrological station located in the tributary of Yongding River mountain area all had significant decreasing trends and abrupt changes. The abrupt change points were in 1983, 1983 and 1982, respectively. Compared with the reference period, the annual average precipitation in the basins of the three hydrological stations during the variation period decreased by less than 10%, the annual average potential evapotranspiration decreased slightly, but the annual average natural runoff decreased sharply, and the relative reduction was more than 40%.
(2)
The variation of the hydrological elements in the Yongding River mountain area from 1956 to 2016 presented a sharp decrease in the natural runoff and change of the relationship between the hydro-meteorological variables since 1980s. With the precipitation–runoff relationship becoming weaker, the WBP-DP based on the Budyko hypothesis and storage–discharge equation cannot adapt to the significant changes of the coupled water–energy balance in the basin and cannot effectively describe the complex relationship of hydro-meteorological variables on an annual scale.
(3)
Compared with 1956–1982, the intra-annual temporal distribution of precipitation in the Yongding River mountain area underwent important changes during 1983–2016. In the main runoff generation period from July to August, the precipitation amount dropped significantly, the concentration of precipitation distribution decreased significantly, and the number of effective precipitation days decreased significantly. This is one of the important reasons for the decrease in the natural runoff and the change of hydrological responses.
(4)
From 1980 to 2015, the overall land use pattern in the Yongding River mountain area did not change much, but the NDVI had a significant increasing trend, and there was a significant negative correlation between the NDVI and the annual natural runoff. The evapotranspiration increased and the consumption of underground water storage caused by the increase in the vegetation cover was likely to be another important reason for the substantial reduction of the natural runoff since the 1980s.
(5)
Due to the long-term and large-scale exploitation of the groundwater in the Yongding River mountain area, the thickness of vadose zone may increase by several times or even tens of times compared with that before the 1980s. The groundwater level in the basin has drastically dropped and the land water storage has been continuously consumed. It has changed the mechanism of runoff production and the relationship between groundwater recharge and discharge, and also has a significant impact on the runoff decreasing and the adjustment of the hydro-meteorological relationship in the YRB.
Under the combined influences of climate change and human activities, the sharp natural-runoff decrease and the change of the hydro-meteorological relationship in the Yongding mountain area are remarkable. The continuous and substantial decline of natural runoff indicates that the hydrological cycle in the basin has been significantly changed, which intensifies the contradiction and competition between the economic-social water use and the ecological water use, making the sustainable utilization of water resources and ecological stability recovery in the basin face severe challenges. In order to realize the coordinated benign evolution of the water resources, economy, society and ecological environment system, we should strive to build a benign water cycle system in the comprehensive management of the river basin, including strengthening the total water consumption control, improving the level of efficient and intensive utilization of water resources, compressing the groundwater exploitation and optimizing the structure of water supply sources. In addition, we should systematically evaluate the hydrological and ecological effects of large-scale vegetation restoration, reasonably allocate vegetation restoration measures and strengthen the natural vegetation restoration.

Author Contributions

Conceptualization, Y.W. and Q.H.; methodology, K.N. and Q.H.; investigation, L.W., L.L. and X.L.; resources, H.Y.; writing—original draft preparation, K.N.; writing—review and editing, Q.H. and C.L. (Chengxi Li); supervision, Y.W. and C.L. (Chuan Liang); funding acquisition, Y.D. All authors have read and agreed to the published version of the manuscript.

Funding

This research was funded by the Beijing Science and Technology Project(Grants Z191100006919002), the Consulting Research Project of Chinese Academy of Engineering(2020-ZD-20), the National Natural Science Foundation of China (No.52009081), the Postdoctoral Research Funding Program of Jiangsu Province (No.2020Z060), the Special Funds for Basic Scientific Research of Central Public Welfare Research Institutes(No.Y520016), the Special Funds for Basic Scientific Research of Central Public Welfare Research Institutes (No.Y521007).

Data Availability Statement

Meteorological data were downloaded from the China Meteorological Data Service Centre (http://data.cma.cn/en/, accessed on 5 August 2020). Water resources exploitation and utilization data were obtained according to the water resource communiques of Shanxi, Beijing, Hebei and evaluation of water resources (http://slt.shanxi.gov.cn/zncs/szyc/szygb/; http://slt.hebei.gov.cn/dynamic/search.jsp; http://swj.beijing.gov.cn/zwgk/szygb/, accessed on 20 October 2020). The remotely sensed data of land were obtained based on Landsat TM/ETM remotely sensed image (https://www.resdc.cn/data.aspx?DATAID=184/, accessed on 8 November 2020). The NDVI data were obtained at the website (https://ecocast.arc.nasa.gov/data/pub/gimms/3g.v1/, accessed on 14 November 2020). The GRACE data were obtained at the website. (http://www2.csr.utexas.edu/grace/RL06_mascons.html/, accessed on 20 December 2020).

Acknowledgments

We would like to thank the National Climatic Centre of the China Meteorological Administration for providing the climate database used in this study. We thank Nanjing Hurricane Translation for reviewing the English language quality of this paper. We also thank the anonymous reviewers and editors of this paper for their very helpful comments and suggestions.

Conflicts of Interest

The authors declare no conflict of interest.

References

  1. Mekonnen, M.M.; Hoekstra, A.Y. Four billion people facing severe water scarcity. Sci. Adv. 2016, 2, e1500323. [Google Scholar] [CrossRef] [PubMed] [Green Version]
  2. Greve, P.; Orlowsky, B.; Mueller, B.; Sheffield, J.; Reichstein, M.; Seneviratne, S.I. Global assessment of trends in wetting and drying over land. Nat. Geosci. 2014, 7, 716–721. [Google Scholar] [CrossRef]
  3. Zhou, G.; Li, L.; Fang, X.; Han, S.; Shi, T. Trend and influencing factors of global river discharge in recent 60 years. Trans. Atmos. Sci. 2020, 43, 1076–1085. [Google Scholar]
  4. Climate Change 2014–Impacts, Adaptation and Vulnerability: Regional Aspects; Cambridge University Press: Cambridge, UK, 2014.
  5. Milly, P.; Dunne, K.A.; Vecchia, A.V. Global pattern of trends in streamflow and water availability in a changing climate. Nature 2005, 438, 347–350. [Google Scholar] [CrossRef]
  6. Desta, H.; Lemma, B.; Gebremariam, E. Identifying sustainability challenges on land and water uses: The case of Lake Ziway watershed, Ethiopia. Appl. Geogr. 2017, 88, 130–143. [Google Scholar] [CrossRef]
  7. McVicar, T.R.; Li, L.T.; Van Niel, T.G.; Zhang, L.; Li, R.; Yang, Q.K.; Zhang, X.P.; Mu, X.M.; Wen, Z.M.; Liu, W.Z.; et al. Developing a decision support tool for China’s re-vegetation program: Simulating regional impacts of afforestation on average annual streamflow in the Loess Plateau. For. Ecol. Manag. 2007, 251, 65–81. [Google Scholar] [CrossRef]
  8. Salmoral, G.; Willaarts, B.A.; Troch, P.A.; Garrido, A. Drivers influencing streamflow changes in the Upper Turia basin, Spain. Sci. Total Environ. 2015, 503–504, 258–268. [Google Scholar] [CrossRef]
  9. Berghuijs, W.R.; Larsen, J.R.; Van Emmerik, T.H.M.; Woods, R.A. A global assessment of runoff sensitivity to changes in precipitation, potential evaporation, and other factors. Water Resour. Res. 2017, 53, 8475–8486. [Google Scholar] [CrossRef] [Green Version]
  10. Kundzewicz, Z.W.; Mata, L.J.; Arnell, N.W.; Doll, P.; Jimenez, B.; Miller, K.; Oki, T.; Sen, Z.; Shiklomanov, I. The implications of projected climate change for freshwater resources and their management. Hydrol. Sci. J. 2008, 53, 3–10. [Google Scholar] [CrossRef]
  11. Berghuijs, W.R.; Woods, R.A.; Hrachowitz, M. A precipitation shift from snow towards rain leads to a decrease in streamflow. Nat. Clim. Chang. 2014, 4, 583–586. [Google Scholar] [CrossRef] [Green Version]
  12. Rose, S.; Peters, N.E. Effects of urbanization on streamflow in the Atlanta area (Georgia, USA): A comparative hydrological approach. Hydrol. Process. 2001, 15, 1441–1457. [Google Scholar] [CrossRef]
  13. Wang, D.; Hejazi, M. Quantifying the relative contribution of the climate and direct human impacts on mean annual streamflow in the contiguous United States. Water Resour. Res. 2011, 47, 411. [Google Scholar] [CrossRef] [Green Version]
  14. Kim, J.; Choi, J.; Choi, C.; Park, S. Impacts of changes in climate and land use/land cover under IPCC RCP scenarios on streamflow in the Hoeya River Basin, Korea. Sci. Total Environ. 2013, 452–453, 181–195. [Google Scholar] [CrossRef] [PubMed]
  15. Zhang, J.; Wang, G. Variation of River Runoff and Quantitative Attribution Identification; Science Press: Beijing, China, 2014. [Google Scholar]
  16. Montanari, A.; Young, G.; Savenije, H.H.G.; Hughes, D.; Wagener, T.; Ren, L.L.; Belyaev, V. “Panta Rhei—Everything flows”: Change in hydrology and society—the IAHS scientific decade 2013–2022. Hydrol. Sci. J. 2013, 58, 1256–1275. [Google Scholar] [CrossRef]
  17. Dey, P.; Mishra, A. Separating the impacts of climate change and human activities on streamflow: A review of methodologies and critical assumptions. J. Hydrol. 2017, 548, 278–290. [Google Scholar] [CrossRef]
  18. Ahn, K.H.; Merwade, V. Quantifying the Relative Impact of Climate and Human Activities on Streamflow. J. Hydrol. 2014, 515, 257–266. [Google Scholar] [CrossRef]
  19. Wang, G.; Zhang, J.; Guan, X.; Bao, Z.; Liu, Y.; He, R.; Jin, J.; Liu, C.; Chen, X. Quantifying Attribution of Runoff Change for Major Rivers in China. Adv. Water Sci. 2019, 24, 303–310. [Google Scholar]
  20. Yang, D.; Li, C.; Hu, H.; Lei, Z.; Yang, S.; Kusuda, T.; Musiake, K. Analysis of water resources variability in the Yellow River of China during the last half century using historical data. Water Resour. Res. 2004, 40. [Google Scholar] [CrossRef]
  21. Gao, G.; Fu, B.; Wang, S.; Liang, W.; Jiang, X. Determining the hydrological responses to climate variability and land use/cover change in the Loess Plateau with the Budyko framework. Sci. Total Environ. 2016, 557, 331–342. [Google Scholar] [CrossRef]
  22. Bao, Z.; Zhang, J.; Yan, X.; Wang, G.; Wang, G.; He, R.; Guan, T.; Liu, Y. Quantitative assessment of the attribution of runoff change caused by four factors in the Haihe River basin. Adv. Water Sci. 2020, 32, 171–181. [Google Scholar]
  23. Xu, X.; Yang, D.; Yang, H.; Lei, H. Attribution analysis based on the Budyko hypothesis for detecting the dominant cause of runoff decline in Haihe basin. J. Hydrol. 2014, 510, 530–540. [Google Scholar] [CrossRef]
  24. Feng, Z.; Liu, S.; Pin, L. Research progress in eco-environmental issues and eco-restoration strategy in Yongding River basin. J. Univ. Chin. Acad. Sci. 2019, 36, 510–520. [Google Scholar]
  25. Hou, L.; Peng, W.; Dong, F.; Liu, J.; Chen, Q.; Huang, A.; Chen, X. Historical Evolution of the Hydro–Meteorological Elements in the Upstream of the Yongding River Basin. China Rural Water Hydropower 2020, 14, 1–8. [Google Scholar]
  26. Ren, X.; Hu, Z.; Cao, Y.; He, S. Water Resources Assessment in the Haihe River Basin; China Water Power Press: Beijing, China, 2007. [Google Scholar]
  27. Wang, L. Distributed Hydrological Model of Yongding River Mountain Basin and Surface Water Resources Evaluation; Tsinghua University: Beijing, China, 2004. [Google Scholar]
  28. Zhang, L.; Yu, S.; Duan, Y.; Shan, L.; Chen, X.; Xu, Z. Quantitative assessment of the effects of climate change and human activities on runoff in the Yongding River Basin. Clim. Chang. Res. 2013, 9, 391–397. [Google Scholar]
  29. Hou, L. Study on Mechanism of Eco-Hydrological Response at the Water Resources Shortage Watershed in Northern China—A Case Study of Yongding Rive; China Institute of Water Resouces and Hydropower Research: Beijing, China, 2019. [Google Scholar]
  30. Xie, P.; Chen, G.; Lei, H.; Wu, F. Hydrological alteration diagnosis system. J. Hydrol. Eng. 2010, 29, 85–91. [Google Scholar]
  31. Hurst, H.E. Long-term storage capacity of reservoirs. Trans. Am. Soc. Civ. Eng. 1951, 116, 770–799. [Google Scholar] [CrossRef]
  32. Hu, Q.; Wang, Y.; Liu, K.; Wang, Z.Z. Monthly runoff simulation based on improved two-parameter monthly water volume balance model. J. Hohai Univ. 2007, 35, 638–642. [Google Scholar]
  33. Yang, H.; Yang, D.; Lei, Z.; Sun, F. New analytical derivation of the mean annual water-energy balance equation. Water Resour. Res. 2008, 44, 893–897. [Google Scholar] [CrossRef]
  34. Duan, Q.; Sorooshian, S.; Gupta, V.K. Optimal use of the SCE-UA global optimization method for calibrating watershed models. J. Hydrol. 1994, 158, 265–284. [Google Scholar] [CrossRef]
  35. SL 278-2002. In Regulation for Hydrologic Computation of Water Resources and hydropower Projects; Ministry of Water Resources of the People’s Republic of China: Beijing, China, 2002.
  36. Liu, R.; Zhu, D. Methods for Detecting Land Use Changes Based on the Land Use Transition Matrix. Resour. Sci. 2010, 32, 1544–1550. [Google Scholar]
  37. Allen, R.G.; Pereira, L.S.; Raes, D.; Smith, M. Crop Evapotranspiration Guidelines for Computing Crop Water Requirements; FAO Irrigation and Drainage Paper No. 56; FAO: Rome, Italy, 1998. [Google Scholar]
  38. Hydrological Data of Haihe River Basin of Annual Hydrological Report of China; Department of Hydrology, Ministry of Water Resources: Beijing, China, 1956.
  39. Gao, J.; Jiao, K.; Wu, S. Investigating the spatially heterogeneous relationships between climate factors and NDVI in China during 1982 to 2013. J. Geogr. Sci. 2019, 29, 1597–1609. [Google Scholar] [CrossRef] [Green Version]
  40. Mao, D.; Wang, Z.; Luo, L.; Rec, C. Integrating AVHRR and MODIS data to monitor NDVI changes and their: Relationships with climatic parameters in Northeast China. Int. J. Appl. Earth Obs. Geoinf. 2012, 18, 528–536. [Google Scholar] [CrossRef]
  41. Tapley, B.D.; Bettadpur, S.; Ries, J.C.; Thompson, P.F. GRACE measurements of mass variability in the Earth system. Science 2004, 305, 503–505. [Google Scholar] [CrossRef] [Green Version]
  42. McKinley, S.; Levine, M. Cubic spline interpolation. Coll. Redw. 1998, 45, 1049–1060. [Google Scholar]
  43. Liu, J.; You, Y.; Zhang, Q.; Gu, X. Attribution of streamflow changes across the globe based on the Budyko framework. Sci. Total Environ. 2021, 794, 148662. [Google Scholar] [CrossRef]
  44. Patterson, L.A.; Lutz, B.; Doyle, M.W. Climate and direct human contributions to changes in mean annual streamflow in the South Atlantic, USA. Water Resour. Res. 2013, 49, 7278–7291. [Google Scholar] [CrossRef]
  45. Birsan, M.-V. Trends in monthly natural streamflow in Romania and linkages to atmospheric circulation in the North Atlantic. Water Resour. Manag. 2015, 29, 3305–3313. [Google Scholar] [CrossRef]
  46. Debbage, N.; Shepherd, J.M. The influence of urban development patterns on streamflow characteristics in the Charlanta Megaregion. Water Resour. Res. 2018, 54, 3728–3747. [Google Scholar] [CrossRef]
  47. Bao, Z.; Zhang, J.; Wang, G.; Chen, Q.; Guan, T.; Yan, X.; Liu, C.; Liu, J.; Wang, J. The impact of climate variability and land use/cover change on the water balance in the Middle Yellow River Basin. China J. Hydrol. 2019, 577, 123942. [Google Scholar] [CrossRef]
  48. Liang, K.; Liu, C.; Liu, X.; Song, X. Impacts of climate variability and human activity on stream flow decrease in a sediment concentrated region in the Middle Yellow River. Stoch. Environ. Res. Risk Assess. 2013, 27, 1741–1749. [Google Scholar] [CrossRef]
  49. Jin, K.; Wang, F.; Han, J. Contribution of climatic change and human activities to vegetation NDVI change over China during 1982–2015. Acta Geogr. Sin. 2020, 75, 961–974. [Google Scholar]
  50. Zhao, A.; Zhang, A.; Liu, H. Spatiotemporal variation of vegetation coverage before and after implementation of grain for green project in the Loess Plateau. J. Nat. Resour. 2017, 32, 449–460. [Google Scholar]
  51. Li, H.; Shi, C.; Zhang, Y.; Ning, T.; Sun, P.; Liu, X.; Ma, X.; Liu, W.; Collins, A.L. Using the Budyko hypothesis for detecting and attributing changes in runoff to climate and vegetation change in the soft sandstone area of the middle Yellow River basin, China. Sci. Total Environ. 2019, 703, 135588. [Google Scholar] [CrossRef]
  52. Ning, T.; Zhou, S.; Chang, F.; Shen, H.; Li, Z.; Liu, W. Interaction of vegetation, climate and topography on evapotranspiration modelling at different time scales within the Budyko framework. Agric. For. Meteorol. 2019, 275, 59–68. [Google Scholar] [CrossRef]
  53. Sinha, J.; Jha, S.; Goyal, M.K. Influences of watershed characteristics on long-term annual and intra-annual water balances over India. J. Hydrol. 2019, 577, 123970. [Google Scholar] [CrossRef]
  54. Liu, X.; Liu, C.; Yang, S.; Jin, S.; Gao, Y. Influences of shrubs-herbs-arbor vegetation coverage on the runoff based on the remote sensing data in Loess Plateau. J. Geogr. Sci. 2014, 69, 1595–1603. [Google Scholar]
  55. Zhu, H.; Wang, L.; Tang, H. A review of advances in the generation, propagation and environmental impacts of internal waves in lakes and reservoirs. J. Hydraul. Eng. 2014, 45, 386–393. [Google Scholar]
  56. Chen, M. Attribution Analysis of Runoff Variation in Typical Catchments of the Loess Plateau Based on Budyko Hypothesis; University of Chinese Academy of Sciences: Shaanxi, China, 2019. [Google Scholar]
  57. Zhang, B.; Wu, P.; Zhao, X. Detecting and analysis of spatial and temporal variation of vegetation cover in the Loess Plateau during 1982–2009. Trans. Chin. Soc. Agric. Eng. 2011, 27, 287–293. [Google Scholar]
  58. Zhao, M.; Geruo, A.; Zhang, J.; Velicogna, I.; Liang, C.; Li, Z. Ecological restoration impact on total terrestrial water storage. Nat. Sustain. 2021, 4, 56–62. [Google Scholar] [CrossRef]
  59. Zhang, J.; Liu, J.; Ren, H. Impact of underlying surface change on runoff of Guanting Reservoir in Yongding River Basin. Haihe Water Resour. 2016, 7–10. [Google Scholar] [CrossRef]
Figure 1. Location of meteorological and hydrological stations in the Yongding River mountain area.
Remotesensing 13 03199 g001
Figure 2. Annual natural runoff of the three hydrological stations in the mountain area of Yongding River from 1956 to 2016. (a) Cetian hydrological station; (b) Xiangshuibao hydrological station; (c) Guanting hydrological station.
Remotesensing 13 03199 g002
Figure 3. Relationship between annual rainfall and natural runoff of main and tributaries in the mountain area of Yongding River. (a) the relationship between annual rainfall and natural runoff in the control basin of Cetian reservior; (b) the relationship between annual rainfall and natural runoff in the control basin of Xiangshuibao reservior; (c) the relationship between annual rainfall and natural runoff in the control basin of Guanting reservior.
Remotesensing 13 03199 g003
Figure 4. Comparison of natural runoff and WBM-DP simulation value in the mountain area of Yongding River from 1956 to 2016. (a) the natural runoff and simulation runoff of Cetian reservior; (b) the natural runoff and simulation runoff of Xiangshuibao reservior; (c) the natural runoff and simulation runoff of Guanting reservior.
Remotesensing 13 03199 g004
Figure 5. Annual distribution of natural runoff and areal rainfall in the mountain area of Yongding River in different periods. (a,b) the natural runoff and areal precipitation of the control basin of Cetian reservior; (c,d) the natural runoff and areal precipitation of Xiangshuibao reservior; (e,f) the natural runoff and precipitation of the areal control basin of Guanting reservior.
Remotesensing 13 03199 g005
Figure 6. Probability distribution histogram of daily precipitation in different reservoir control basins. (a) the probability distribution histogram in the control basin of Cetian reservior; (b) the probability distribution histogram in the control basin of Xiangshuibao reservior; (c) the probability distribution histogram in the control basin of Guanting reservior.
Remotesensing 13 03199 g006
Figure 7. Land use types in the mountain area of Yongding River Basin. (a) Land use types in the mountain area of Yongding River Basin in 1980; (b) Land use types in the mountain area of Yongding River Basin in 2015.
Remotesensing 13 03199 g007
Figure 8. Annual average and annual maximum NDVI variation characteristics in the mountain area of Yongding River from 1982 to 2015. (a) the annual average NDVI in the YRMA from 1982 to 2015; (b) the space distribution of the slope value of the annual average NDVI in the YRMA from 1982 to 2015; (c) annual maximum NDVI in the YRMA from 1982 to 2015; (d) the space distribution of the slope value of the annual average NDVI in the YRMA from 1982 to 2015.
Remotesensing 13 03199 g008
Figure 9. Correlation analysis of natural runoff with annual average NDVI and annual maximum NDVI in the mountain area of Yongding River from 1982 to 2016. (a) correlation analysis of natural runoff with annual average NDVI in the YRMA from 1982 to 2015; (b) correlation analysis of natural runoff with annual maximum NDVI in the YRMA from 1982 to 2015.
Remotesensing 13 03199 g009
Figure 10. Groundwater exploitation in the mountain area of Yongding River.
Remotesensing 13 03199 g010
Figure 11. Socioeconomic water consumption in the mountain area of Yongding River from 1956 to 2016.
Remotesensing 13 03199 g011
Figure 12. Changes of terrestrial water storage in the mountain area of Yongding River from 2002 to 2016.
Remotesensing 13 03199 g012
Table 1. Diagnostic results of annual natural runoff variation in the mountain area of Yongding River from 1956 to 2016.
Hydrological StationsCetianXiangshuibaoGuanting
Diagnostic Process
Preliminary diagnosisHurst index0.9821.0000.975
Overall variationStrongStrongStrong
Detailed diagnosisabruptSlide F-test2010(+)2014(+)2000(+)
Slide T-test1982(+)1983(+)1983(+)
L-H test1982(0)1983(0)1983(0)
Ordered clustering test1982(0)1983(0)1983(0)
R/S test1982(0)1986(0)1983(0)
Optimal segmentation1982(+)1983(+)1998(+)
trendPearson correlation test(+)(+)(+)
Spearman correlation test(+)(+)(+)
Kendall correlation test(+)(+)(+)
Compre
-hensive diagnosis
abruptAbrupt change point198219831983
Comprehensive significance2(+)2(+)1(+)
trendTrend
Comprehensive significance
decline
3(+)
decline
3(+)
decline
3(+)
ConclusionThe natural runoff of all hydrological stations showed significant decreasing trend and abrupt changes
Table 2. Annual mean values of meteorological and hydrological elements in the basins of Yongding River mountain area in different periods.
BasinsPeriodP/mmEP/mmEP/PR1/mmR2/mm
Cetian Reservoir1956–1982422.91012.82.3937.825.1
1983–2016384.6988.32.5722.53.7
Xiangshuibao Reservoir1956–1982427.01033.12.4251.034.9
1983–2016389.0971.52.5021.910.2
Guanting Reservoir1956–1982432.21004.42.3243.428.5
1983–2016395.5962.92.4321.26.0
Remarks: R1 and R2 in the table represent annual natural runoff and observed runoff respectively.
Table 3. Daily precipitation statistics of different meteorological stations from July to August.
Hydrological
Station
1956–19821983–2016
AverageVariation
Coefficient
Kurtosis
Coefficient
AverageVariation
Coefficient
Kurtosis
Coefficient
Cetian4.42.553.42.82.524.6
Xiangshuibao4.22.575.32.82.021.4
Guanting4.32.373.32.91.918.3
Table 4. Transfer matrix of land use types in the mountain area of Yongding River from 1980 to 2015 unit: km2.
2010Cultivated LandWoodlandGrasslandWater AreaConstruction LandUnused LandTotalP2010
1980
cultivated land13139.12093.14160.8373.11111.5142.521,020.147.3%
woodland822.74560.11347.239.555.316.56841.215.4%
grassland4078.72378.67184.8137.6328.147.914,155.631.9%
water area612.3100.1224.3117.871.721.51147.62.6%
construction land453.749.1137.012.3140.94.7797.61.8%
unused land303.624.644.728.717.037.0455.71.0%
total19,410.09205.613,098.9708.91724.5270.044,417.9100.0%
P198043.7%20.7%29.5%1.6%3.9%0.6%100%-
Publisher’s Note: MDPI stays neutral with regard to jurisdictional claims in published maps and institutional affiliations.

