Article

Estimation of Potential Suitable Habitats for the Relict Plant Euptelea pleiosperma in China via Comparison of Three Niche Models

Research Center for Engineering Ecology and Nonlinear Science, North China Electric Power University, Beijing 102206, China
*
Author to whom correspondence should be addressed.
Sustainability 2023, 15(14), 11035; https://doi.org/10.3390/su151411035
Submission received: 18 April 2023 / Revised: 23 June 2023 / Accepted: 9 July 2023 / Published: 14 July 2023
(This article belongs to the Section Sustainability, Biodiversity and Conservation)

Abstract

:
Climate change has a significant impact on species distribution, especially for the relict plants. Euptelea pleiosperma is a type of tertiary relict plant. This plant shows a decreasing trend in population size, and it is on the edge of extinction given the background of climate change. Understanding the change in suitable habitats of E. pleiosperma will provide significant academic value for investigating species conservation and sustainable development. According to the 236 distribution records of E. pleiosperma in China, and 11 environmental factors, the optimal model was selected from MaxEnt, BIOCLIM, and DOMAIN models, aiming to estimate the future potential suitable habitats and exploring the major environmental factors influencing the distribution of E. pleiosperma. By comparison, the BIOCLIM model was the optimal for estimation, since it achieved the highest precision and the lowest standard error. Our results demonstrated that temperature was the most important factor affecting the suitable habitats of E. pleiosperma, followed by precipitation and altitude. Under the medium- and high-emission scenarios, the future suitable habitats of E. pleiosperma will migrate northward to the high-latitude areas, whereas those under the low-emission scenario will migrate southward to the low-latitude areas. During 2041–2060, the suitable habitat areas will present a positive trend, while those during 2081–2100 will exhibit a negative trend to varying degrees. Consistent with the above results, it is advisable to establish natural reserves and seed resource banks of E. pleiosperma in the current high suitability areas, as well as to provide artificial assistance to guide its migration to the high suitability areas under the future climate scenarios. The findings in this research not only reveal the response of suitable habitats of E. pleiosperma to climate change but also lay a reliable foundation for its population resource conservation and sustainable development.

1. Introduction

Climate change is a global crisis and challenge, which has and will pose nonnegligible impacts on the natural ecosystem and human survival and development [1]. As indicated in ICPP AR6, over the past 100 years, the global temperature elevated by 1.1 °C relative to that during the preindustrial period [2]. Climate is the most vital environmental factor determining tree species distribution [3], while climate change has resulted in tremendous changes of the suitable habitats for plants and also influenced the local original ecosystem and the ecological service function [4,5]. It has been indicated that plants migrate to the higher altitude or higher latitude areas [6], and two thirds of the spring phenology has been advanced [7]. Under the background of global warming, extreme weathers occur frequently, severely impairing tree species [8]. The world biodiversity is disappearing at an unprecedented rate [9], with approximately 100 species becoming extinct every day [10], and climate change has become the major threat to biodiversity and ecosystems [11,12,13,14,15,16,17,18].
Relict plants are species that were once widely distributed in the Tertiary Arctic but are currently only distributed in East Asia, North America, and southwestern Europe [19]. Honored as the living fossil plants, the tertiary relict plants have aroused extensive attention due to their ancient origin, special morphology, and significant research value [20,21], also becoming the hot topic in the field of biodiversity protection [22,23,24]. During the Neogene period and the Quaternary period, due to global climate change, these species that were once widely distributed in the Northern Hemisphere began to migrate to the warm and humid areas in North America, East Asia, and Southwest Eurasia [25,26]. The flora in East Asia has the most abundant species diversity, with an ancient and complete succession sequence, which can provide vital information for the lost historical records and is also an important area to explore in terms of plant origin and evolution in the northern hemisphere [26,27]. At present, numerous relict plants (Appendix A) are listed as endangered species, including Shaniodendron subaequale [28], Liriodendron chinense [29], Taxus wallichiana [30], and Ginkgo biloba [31]. For relict plants, climate change will not only lead to the degradation or loss of their habitats [29,32] but also block gene communications between populations, affecting their genetic diversity and adaptability to the environment [33,34]. Therefore, it is of great significance to investigate the adaptive mechanisms of relict plants to the global climate change for their protection and sustainable development.
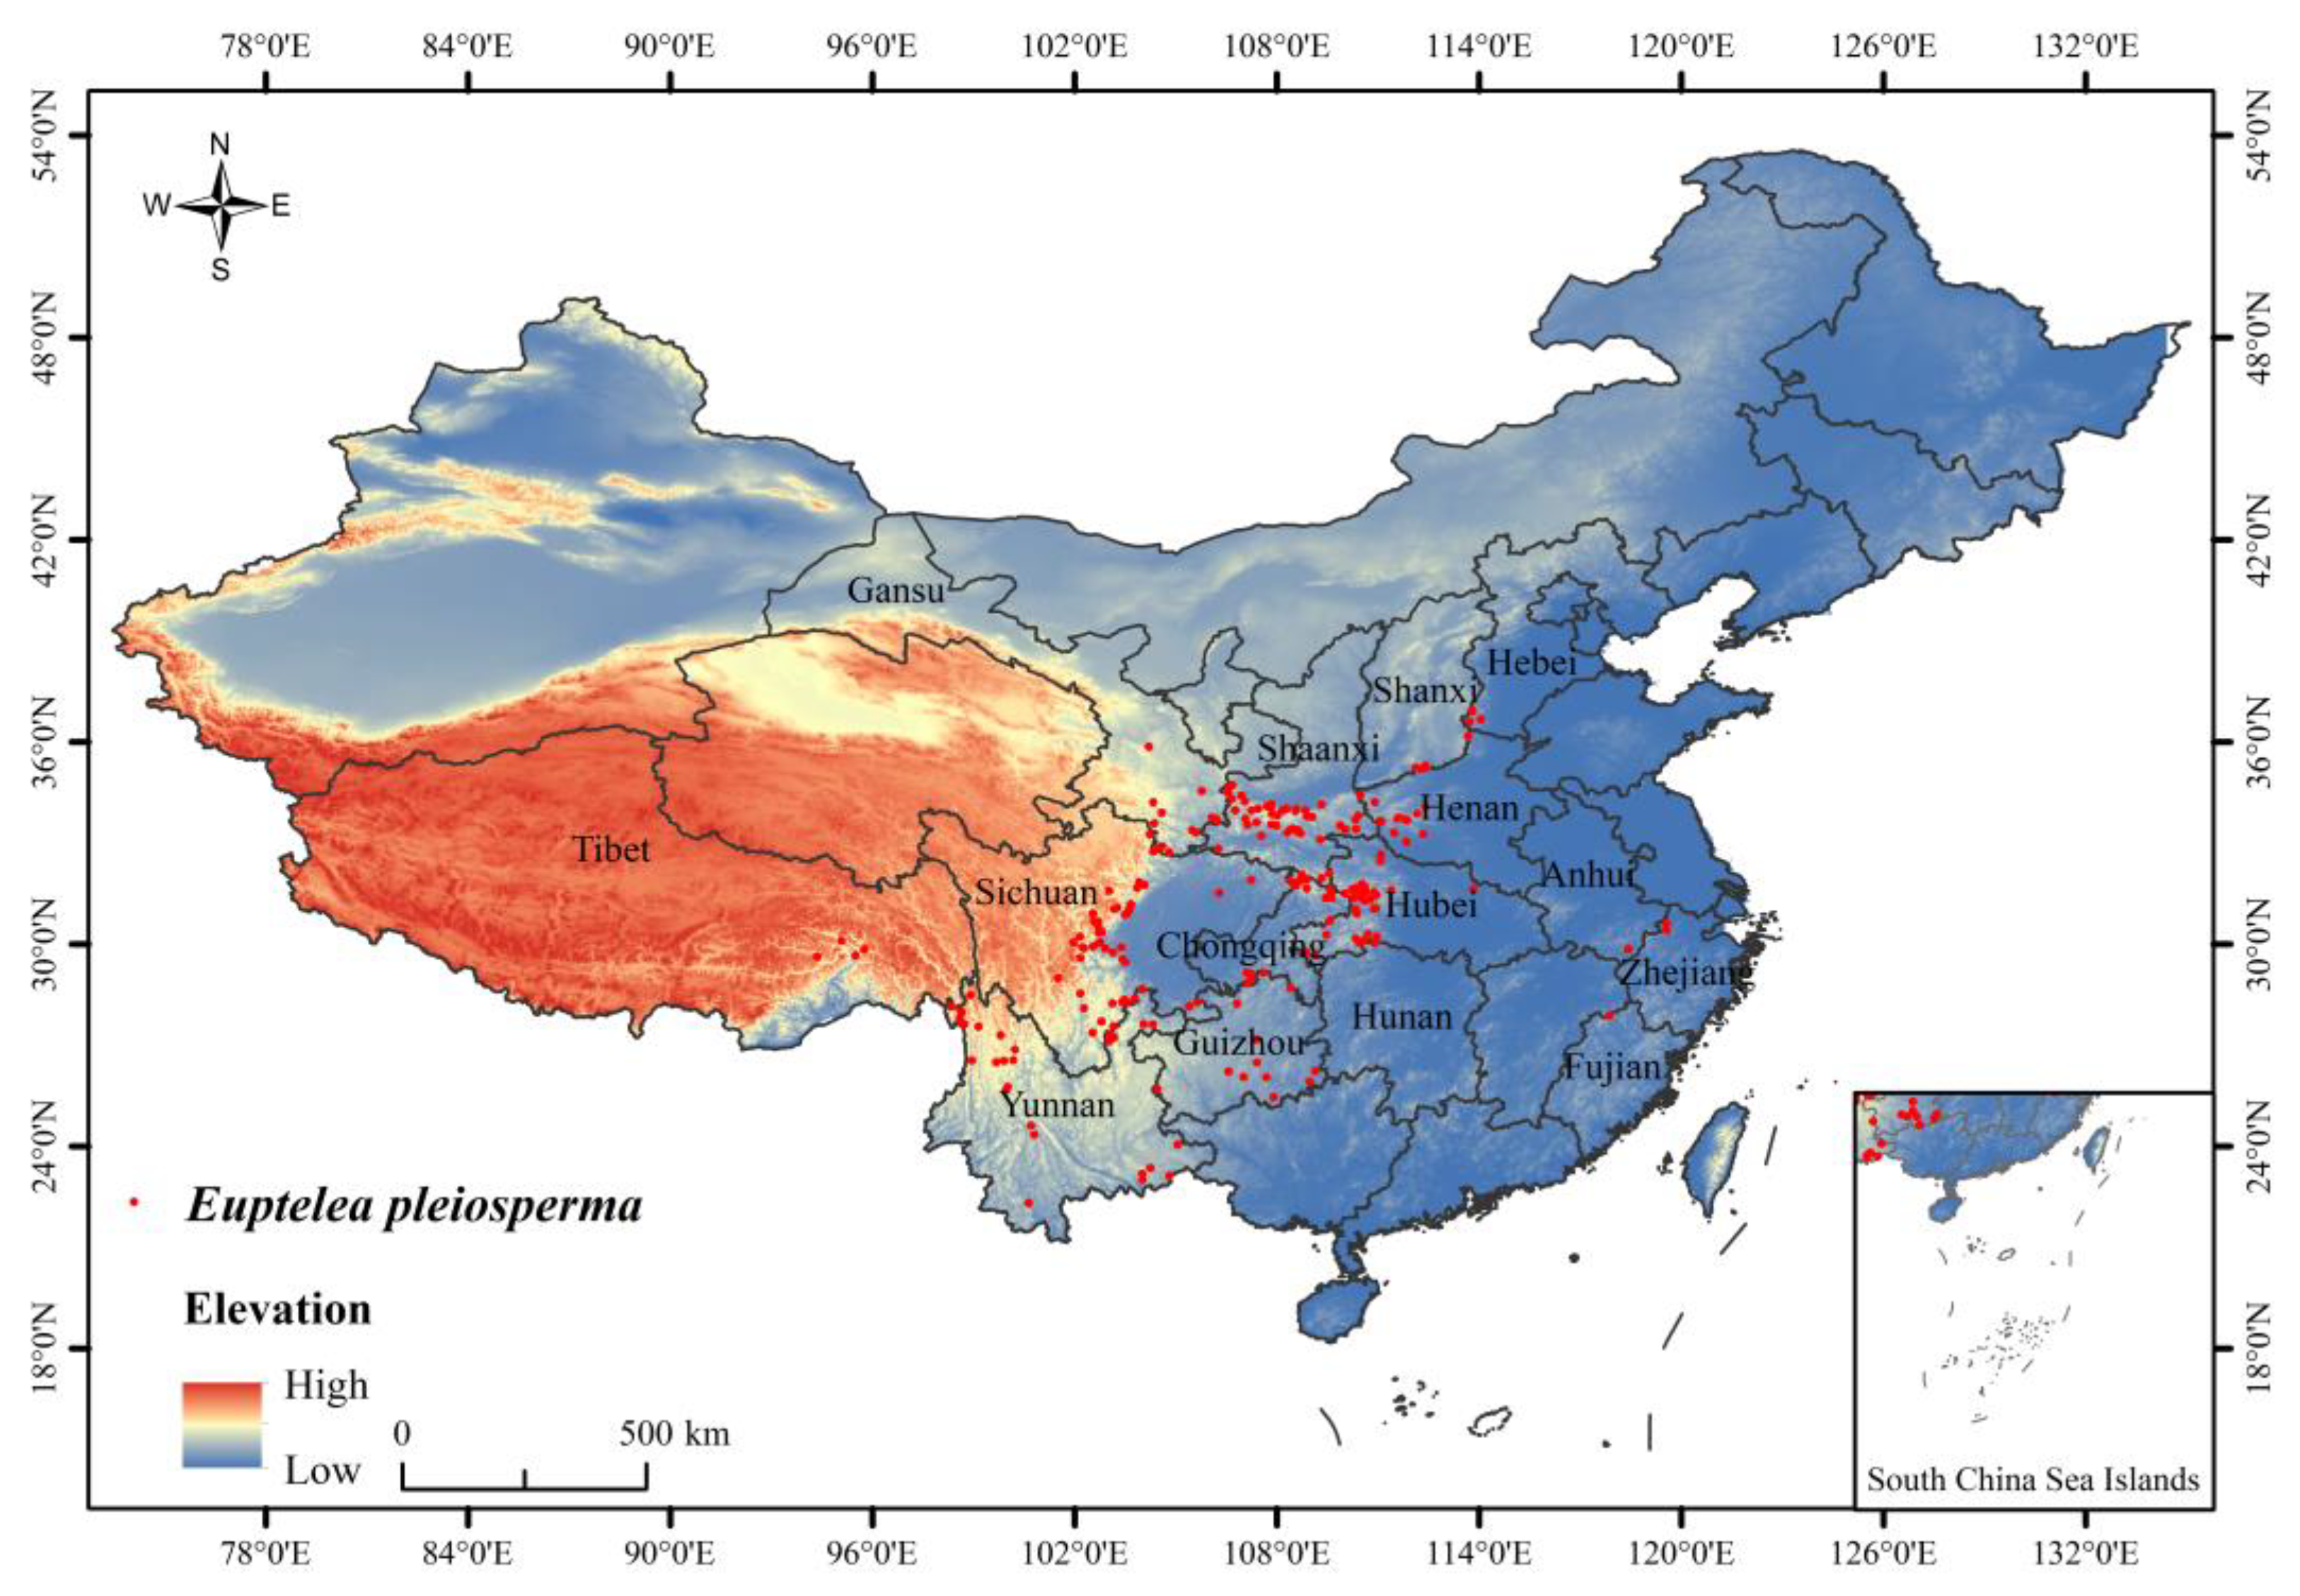
Euptelea pleiosperma Hook. f. et Thoms is a small deciduous tree belonging to Euptelea of Eupteleaceae [35]. During the Late Miocene, global cooling resulted in E. pleiosperma populations in China gradually migrating to the lower latitude area [36]. They sought suitable habitats while migrating along the altitude and used mountains as shelters [19]. The survey shows that E. pleiosperma is distributed in Zhejiang, Hunan, Hubei, Guizhou, Yunnan, Shanxi, Hebei, and Henan in China [37]. Eupteleaceae is a monotypic family endemic to East Asia, including one genus: Euptelea. There are only two species of this genus: one is distributed in China and India, and the other is originated in Japan. The distribution and number of E. pleiosperma are extremely limited. If E. pleiosperma becomes extinct in China, it will generate a certain impact on its biodiversity [35]. In terms of phylogeny, this species has an isolated status, possessing several relatively primitive features and having few closely related species. E. pleiosperma belongs to the tertiary relict plant group and is also the typical characteristic species as the floristic component of East Asia. At present, studies on E. pleiosperma mainly concentrate on seed traits [38], genetic diversity [39,40], and community structure [35], while studies regarding the response to climate and the estimation of the potential distribution are still lacking. However, with the aggravation of global climate change and excessive disturbance of human activities, the natural habitat for E. pleiosperma is severely fragmented, its distribution range is shrinking, and its population quantity is decreasing and even on the edge of extinction; it is currently listed in the Red Book of Chinese Plants as a Grade III protected plant in China [22]. Therefore, determining the potential geographical distribution of E. pleiosperma and estimating the influence of future climate change on its suitable habitat can provide effective information for protecting population resources.
Species distribution models (SDMs), also referred to as niche models, combine the observed species distribution data with the corresponding environmental variables in order to infer the ecological needs of species, which can thus estimate their potential distribution [41]. In addition, there is a growing trend to utilize SDMs to investigate the influence of climate on species distribution [42,43]. Scholars have developed multiple models based on different algorithms [44,45], which are extensively applied in numerous fields including species protection, natural environment monitoring, evaluation of ecological situation, protection against invasive species, and estimation of the risk of infection [44,46,47,48,49]. This study used three models (BIOCLIM, DOMAIN, and MaxEnt) to estimate the suitable habitats of species [50,51]. The BIOCLIM model is a framework niche model based on bioclimatic data, which can extract various environmental data from the known distribution areas to form fixed and complex rectangle packing. If the values of regional environmental variables are within the range of the rectangle packing, then it is shown that this region is suitable for species distribution [52]. The DOMAIN model calculates the Gower distance between points to determine the maximum similarity degree of environmental factors between the known distribution area and the estimated area, which can therefore judge the species distribution range [53]. MaxEnt is a machine-learning algorithm based on the principle of maximum entropy, which can simulate the species niches using data related to the environmental variables and habitat suitability; in addition, the distribution probability can be estimated by the maximum entropy distribution restricted by the environmental variables [54].
Studies on the potential distribution of species have begun to use niche models, and each niche model exhibits specific preferences. Different results may be obtained from the same species distribution data when they are applied in different models. In order to maximally lower the simulation deviation caused by the application of a single model, this study integrated the BIOCLIM, DOMAIN, and MaxEnt models and selected the optimal one to estimate the future potential suitable areas of E. pleiosperma in China. This study aimed to (i) investigate the estimation accuracy of three niche models and select the optimal model for simulation; (ii) investigate the major environmental factors affecting E. pleiosperma distribution; and (iii) summarize the potential suitable habitat patterns of E. pleiosperma and the dynamic variation rules under different climate scenarios.

2. Materials and Methods

2.1. Collection and Processing of Species Distribution Data

The geographical distribution data of E. pleiosperma were obtained through searching the Global Biodiversity Information Network Database (GBIF, https://www.gbif.org/, accessed on 24 October 2022) and the China Digital Herbarium (CVH: https://www.cvh.ac.cn, accessed on 27 October 2022). After removing the duplicated, cultured, and uncertain points, the ArcGIS software was used to construct a buffer area of 2.5 km × 2.5 km within the study area. Only one distribution point was retained in each mesh. Finally, a total of 236 effective distribution point data were screened (Figure 1).

2.2. Collection and Processing of Environmental Data

The current (1970–2000s) and future (2041–2060s and 2081–2100s) climate data were derived from the WorldClim (https://www.worldclim.org/, accessed on 3 November 2022), including a spatial resolution of 2.5’ and 19 bioclimatic factors. Future data employ the BCC-CSM2-MR climate scenario pattern in CMIP6. This pattern simultaneously considers the shared socioeconomic paths (SSPs) and the representative concentration path (RCP), which has an obviously improved capacity in simulating temperature and precipitation compared with the global pattern in CMIP5 and has achieved a better simulation of climate change in China [55]. The model can reasonably reproduce the climate distribution characteristics, and the correlation coefficient between the simulation results and the observation results is 0.86. High reliability has been demonstrated when this model is used to study species distribution [56]. In the literature, researchers in China have often used this model to assess species distribution [57,58,59]. This pattern includes four scenarios, among which, three scenarios including low emissions (SSP126), medium emissions (SSP370), and high emissions (SSP585) were selected for simulation estimation. The SRTM30m altitude data (DEM) were derived from the Geospatial Cloud (http://www.gscloud.cn/, accessed on 3 November 2022), where altitude, slope, and exposure were extracted. Meanwhile, soil data were obtained from the Harmonized World Soil Database (HWSD, https://www.fao.org/, accessed on 8 November 2022), and four variables, namely soil acidity and alkalinity, soil bulk density, soil texture classification, and soil water content, were extracted based on the environment. Diverse environmental variables were extracted from ArcGIS 10.8, with the vector map of the administrative regionalization of China (scale, 1:4,000,000) downloaded from the National Fundamental Geographic Information System (http://nfgis.nsdi.gov.cn/, accessed on 12 November 2022) as the base map for analysis. Then, the spatial resolutions were uniformed and transformed into the ASCII format for subsequent use.
To avoid overfitting induced by multicollinearity among the environmental variables [60], the Pearson correlation coefficients in SPSS software were used to investigate the remaining environmental variables. If the correlation coefficients of two or more variables were >|0.8|, then the variable of a higher contribution rate was incorporated during modeling [14]. All of the above 26 environmental factors (19 bioclimatic factors, 4 soil factors, and 3 topography factors) were tested for correlation and each covariate was removed sequentially, keeping the one covariate demonstrating the highest r coefficient. After screening, 7 bioclimatic factors, 3 soil factors, and 1 soil factor were included into the final model (Table 1).

2.3. Model Estimation

2.3.1. BIOCLIM and DOMAIN

The calculation of BIOCLIM and DOMAIN models was completed in DIVA-GIS software (Version 7.5) [61]. Firstly, the environmental data were converted into the “.grd” file prior to data accumulation in order to generate the stack dataset. Secondly, using the sample point evaluation function in DIVA-GIS software, 75% of the sample point data (“.shp” file) involved in modeling were randomly selected as the training subset, while the remaining 25% of the data and ten-fold existence points were selected as the test result model to test for ten times repeatedly. Moreover, the BIOCLIM/DOMAIN option in the modeling toolkit was used for the simulation. The estimation results were output by importing the distribution point dataset and the stacked environmental data. Finally, the evaluation tool in DIVA-GIS was applied in calculating the area under the curve (AUC) values [50,53].

2.3.2. MaxEnt

The calculations of the MaxEnt model (Version 3.4.4) were performed in this model [46,62]. Firstly, the training dataset in “.csv” format and the 11 environmental variable data in ASCII format were imported into the MaxEnt model. Similarly, 75% of the distribution point data were randomly selected as the training set, whereas the remaining 25% of the data remained as the test set. Afterwards, the variable contribution rate was evaluated by the jackknife method, and the rerun type was set as bootstrap. The output format was logistic, and the repetitive operation was set at 10. The remaining parameters were set at default values [45,63].
To visualize and calculate the area of each class of habitat, the results obtained from the above three models were subsequently processed in ArcGIS 10.8 software.

2.4. Model Accuracy Assessment

In this study, two methods were used for improving the estimation accuracy of the niche models. One was the extensively recognized receiver operating characteristic (ROC) curve, in which the y-axis indicates the true positive rate, and the x-axis indicates the false positive rate [64]. The most important index of accuracy evaluation is AUC (value range, 0.5–1), and a greater AUC value suggests a better model estimation accuracy [17,65,66]. This assessment method is quite objective and is not influenced by the threshold [54]. The other method used was the Kappa statistic. It is a kind of consistency test method based on the optimal threshold, which can modify the estimation performance through estimating the accidental accuracy [52,54]. The Kappa value can range from −1 to 1, where 1 indicates complete consistency between the estimated and observed results, while −1 represents compete inconsistency. A greater value indicates a more significant consistency [19,54]. In this study, the AUC values and Kappa values of the different models were obtained using with DIVA-GIS software, and the estimation accuracy was classified into five grades in accordance with the AUC and Kappa evaluation criteria [14,17,52], as shown in Table 2.

2.5. Classification of Potential Suitable Habitats

The model output results were uniformed to the ASCII format and later imported into the ArcGIS (Version 10.8) software for reclassification, aiming to realize the visualization and area calculation of the suitable habitats. Using the natural breakpoint classification method (Jenks), the E. pleiosperma potential suitable habitats were classified into four grades, including high-suitability, medium-suitability, low-suitability, and unsuitable habitats [17,29]. The value range of the logic value of species existence probability (p) was [0, 1], when the -p-value approached 1, indicating the greatest species existence probability. The criteria for the classification of suitable habitat grades based on the three models are presented in Table 3.
To determine the changes in future potential distribution areas for E. pleiosperma, the suitability and unsuitability values of the potential distribution areas were reclassified using the values of 0 and 1. The results were transformed into an existence–absence binary file. Using the ArcGIS 10.8 software, the changes in species suitable habitat area and gravity center displacement under different climate scenarios were calculated [29]. The binary change results were −1, 1, and 2, representing the gain area, stable area, and lost area under the future climate scenarios. Meanwhile, the species migration trend and trajectory under the climate change scenarios were speculated based on the changes in the gravity center locations of suitable habitats [29,67].

3. Results

3.1. Model Accuracy Evaluation

The mean AUC values and Kappa values of the BIOCLIM, DOMAIN, and MaxEnt models from ten-fold simulations are displayed in Figure 2. The mean AUC values of the three models were 0.929, 0.898, and 0.788, respectively, higher than 0.7. This represents an excellent estimation accuracy. At the same time, the standard deviations were in the order of BIOCLIM (0.003) < MaxEnt (0.005) < DOMAIN (0.009). The Kappa values of the three models were 0.772, 0.627, and 0.576, respectively, higher than 0.55, suggesting good consistency test results. The standard deviations of the Kappa value were in the order of BIOCLIM (0.009) < MaxEnt (0.01) < DOMAIN (0.019). The AUC values of the three models were higher than their Kappa values. Furthermore, evaluation results by the two methods both revealed that BIOCLIM had the highest values, followed by DOMAIN, while the MaxEnt model exhibited the lowest values, indicating that the AUC values were partially associated with the Kappa values. The smaller standard deviations indicated a lower sample dispersion degree and a lower influence on the estimation results. In general, the MaxEnt model achieved an average accuracy, whereas the DOMAIN model had an excellent accuracy. The BIOCLIM model showed a good accuracy, and all of them accurately reflected the potential distribution of E. pleiosperma. The BIOCLIM model had the highest scores of both evaluation indexes, the highest accuracy and the lowest standard deviation; thus, it was considered to be the optimal model.

3.2. Major Influencing Environmental Factors

The BIOCLIM and DOMAIN models could not explore the contributions of environmental factors to the estimation of distribution. If the environmental variables affecting the E. pleiosperma distribution are analyzed, it is essential to estimate the combination of single variables or multiple variables, which takes a long time and is difficult to perform operationally on a large scale [68]. The “knife-edge” function of the MaxEnt model can measure the importance of environmental variables and output the results directly when making the estimation. In addition, although the MaxEnt model shows a lower accuracy evaluation value than the other two models, which may have a bias in estimating the contribution of environmental factors, its accuracy is still within the reference range, and the results have reference significance. Therefore, based on the output information of the MaxEnt model, the major environmental factors affecting the potential distribution of E. pleiosperma were obtained.
As presented in Table 4, among the 11 environmental variables, bio6, bio12, and alt ranked the top three places, with contribution rates of 37.8%, 31.9%, and 13.5%, respectively, significantly higher than those of the other environmental factors. Moreover, in the jackknife test, the “without variable”, “with only variable”, and “with all variable” patterns were employed to explore the regularized training gain, also displaying the importance of the 11 environmental variables to the current species distribution. Figure 3 shows that the top three factors with the highest training model scores were bio6, bio12, and bio2, respectively. Considering the contribution rates and importance, it was determined that the environmental variables which dominated the potential distribution areas of E. pleiosperma included temperature (bio6, bio2), precipitation (bio12), and terrain (alt).
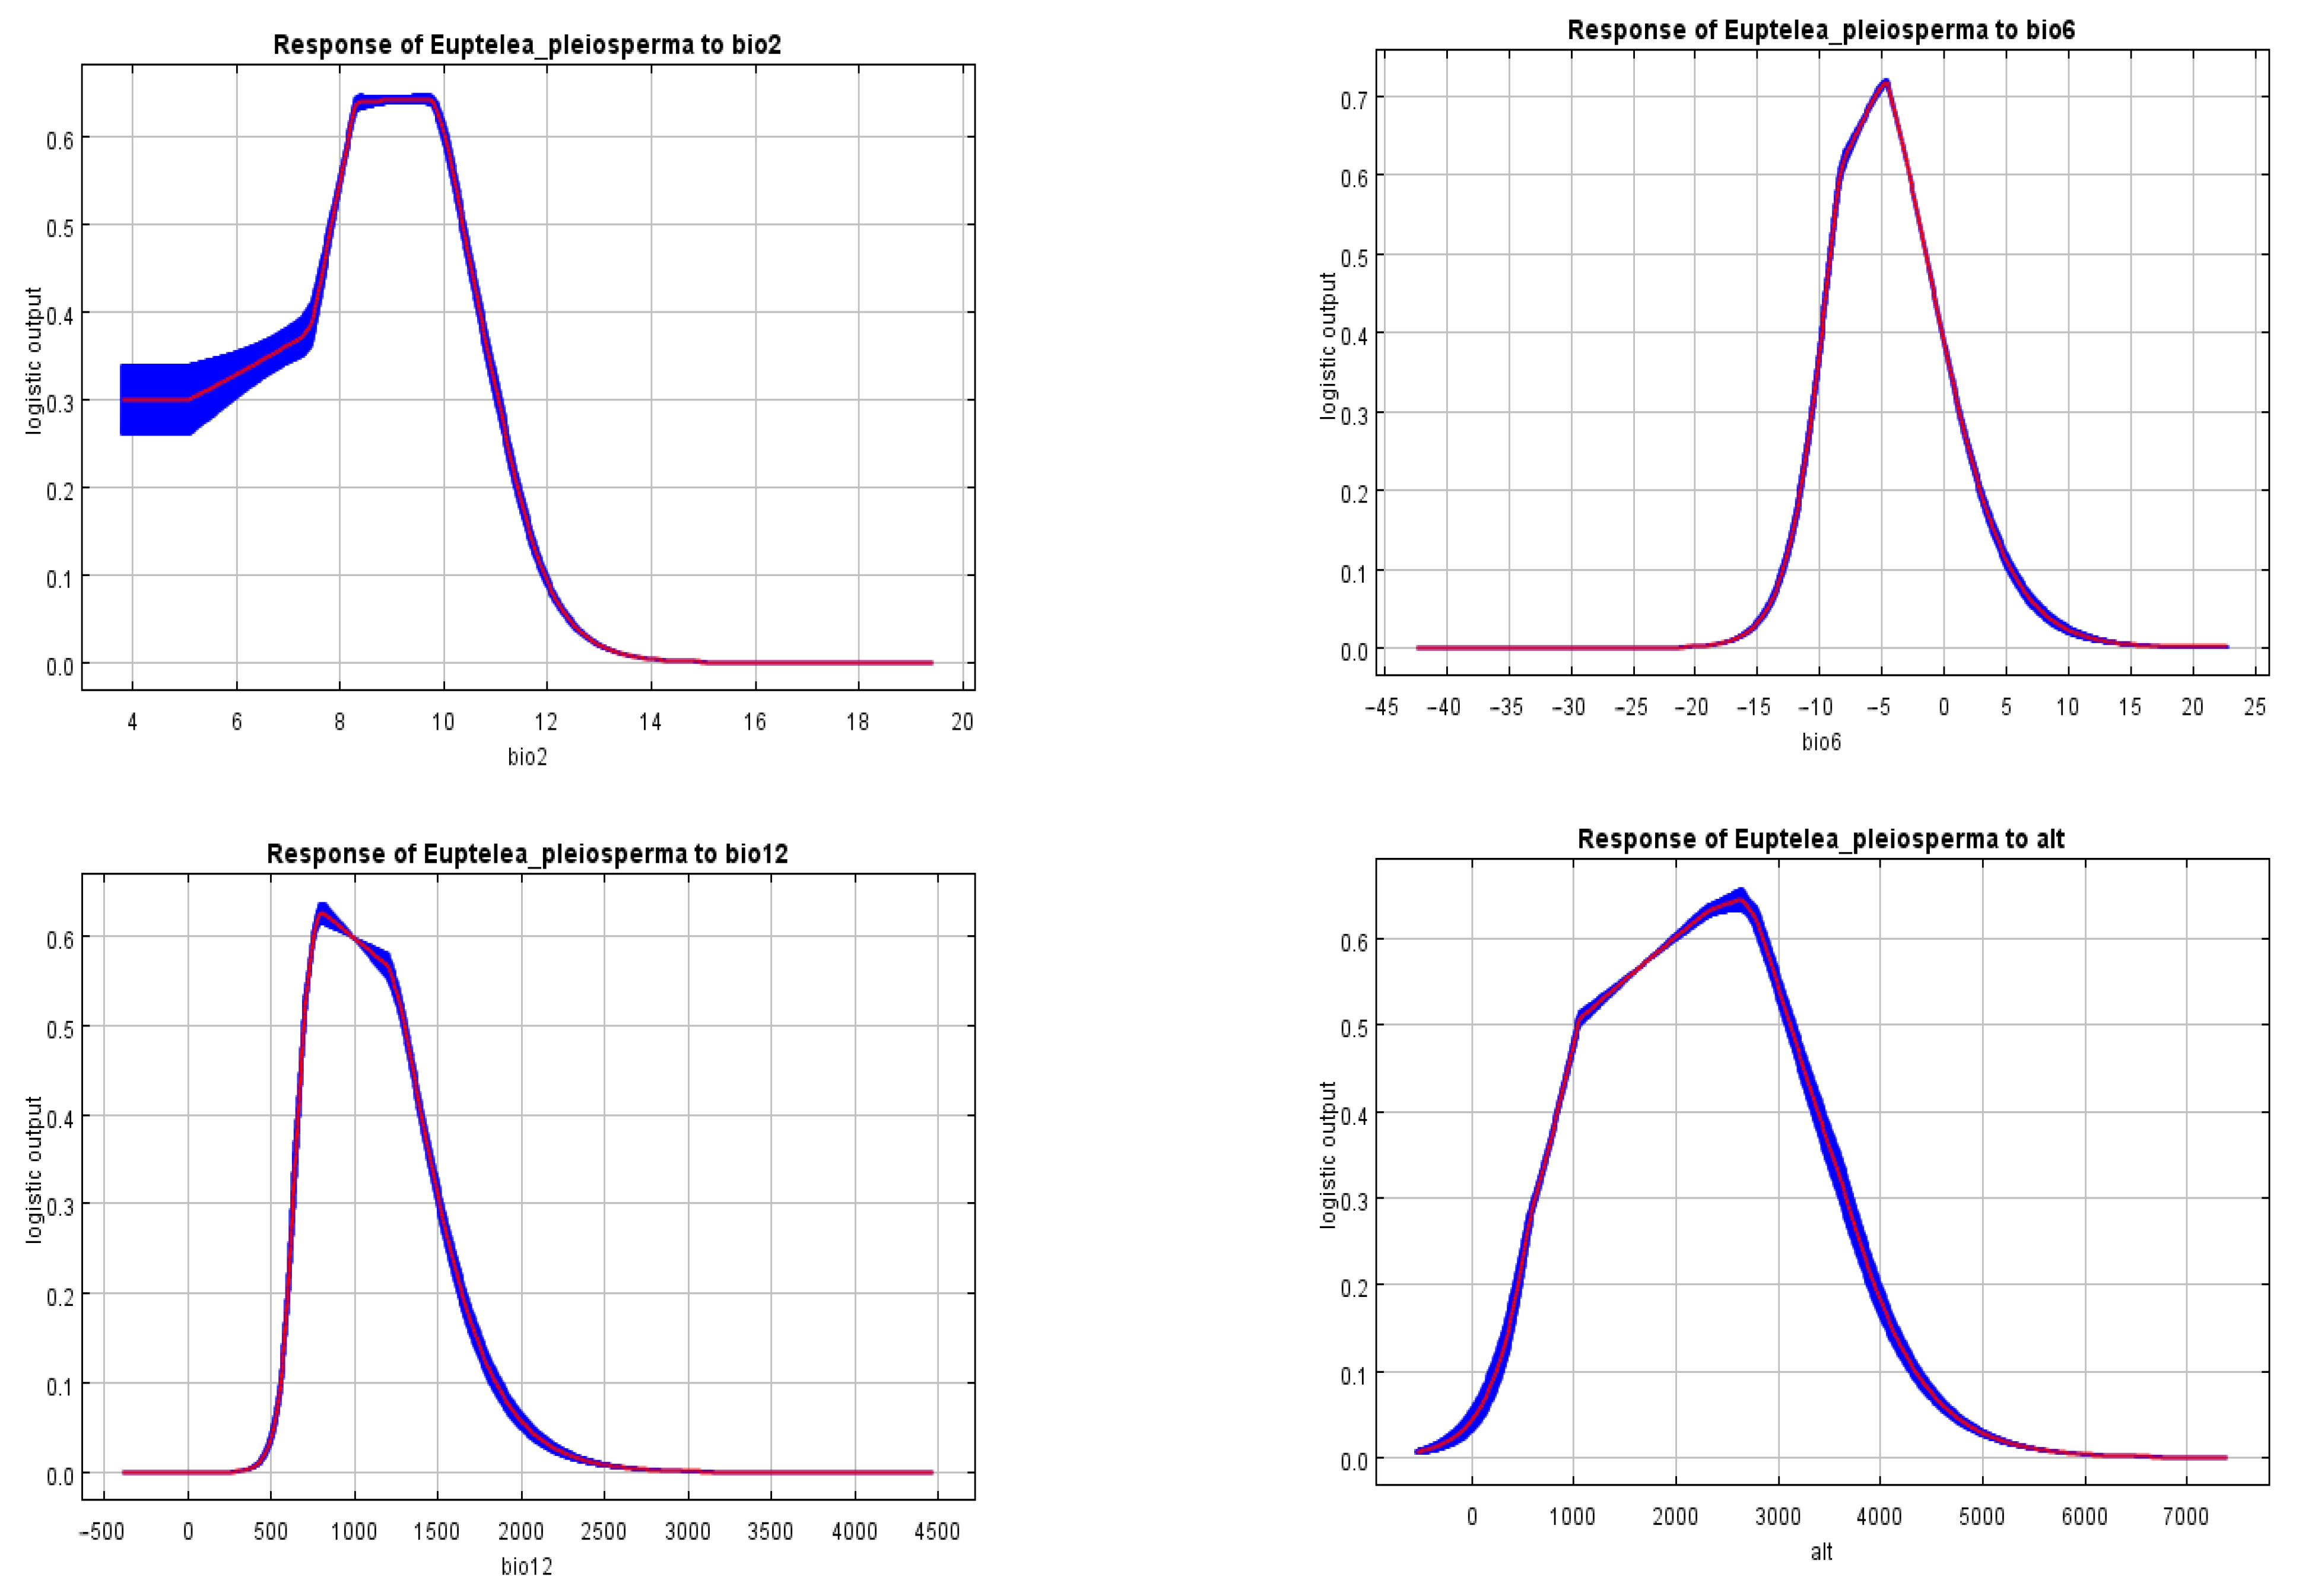
To intuitively understand the influencing mechanism of every factor on the suitable habitat of E. pleiosperma, the MaxEnt model was used to plot the single-factor response curves, aiming to reflect the influence features of major environmental factors on the suitable habitat distribution probability and the species tolerance to the environment (Figure 4). For the four environmental factors, their suitable habitat distribution probability exhibited the trend of first increasing and then decreasing. The peaks displayed the optimal distribution values. A higher suitable habitat distribution probability was maintained within bio2 values of 8.5–9.8 °C. The probability rapidly declined beyond this range. When the range was >12 °C, the suitable habitat distribution probability was lower than 0.08, indicating that the area was no longer suitable for the survival of E. pleiosperma. Moreover, in terms of bio6, the suitable habitat distribution range was −13.4–6.1 °C, and the maximal probability value reached 0.718 at −4.7 °C. The suitable habitat range of bio12 was 545.8–1908.6 mm, and that of the highly suitable area was 691.8–1309.9 mm. The highest suitable habitat probability of 0.625 was found at 803.7 mm. In terms of altitude, the suitable habitat range was 175.9–4459.0 m, which was wider than the other environmental factors. The optimal suitable distribution range was 1026.2–3139.9 m, with the highest suitable distribution probability of 0.645 at the altitude of 2631.4 m.

3.3. Potential Suitable Habitats under Current Climates and Model Selection

The potential distribution estimation results of E. pleiosperma in China based on the three models are displayed in Figure 5 and Table 5. According to the MaxEnt model results, the suitable habitat range was from 22° N~41° N to 79° E~125° E, and the total distribution area occupied 15.24% of the total land area, mainly exhibiting a zonal distribution in central and southwestern China, with sparse distribution in southeastern China. The highly suitable habitats were found in Shaanxi, Sichuan, Gansu, Tibet, Yunnan, Shanxi, Chongqing, Guizhou, Henan, Hubei, Anhui, and Shandong, with the area reaching 262.89 × 10³ km2. Using the BIOCLIM model, the suitable habitat range was from 24° N~37° N to 87° E~119° E, particularly from 24° N~37° N to 93° E~114° E. Compared with the MaxEnt model, the suitable distribution area estimated by the BIOCLIM model showed a lost trend, with an area of 804.54 × 10³ km2 occupying 8.35%. The highly suitable area occupied 0.67%, mainly distributed in Shaanxi, Sichuan, Gansu, Chongqing, Yunnan, Guizhou, Henan, and Hubei. The high-, medium-, and low-suitability habitat areas estimated by the MaxEnt and BIOCLIM models increased in succession. Using the BIOCLIM model, the areas of suitable habitats at various grades were lower than those estimated by the MaxEnt model, and the high suitability distribution area exhibited a narrow zonal distribution. The current suitable habitats of E. pleiosperma estimated by the DOMAIN model are almost all over the country, which is extremely different from the other two models. In addition, Wang et al. [50] and Duan et al. [69] also obtained similar results, which may be a result of the false behavior of the model. This model was discarded due to the great deviation.
Although the potential geographical distribution regions and areas estimated by the MaxEnt and BIOCLIM models were different, the results were quite similar. The suitable areas were largely overlapping, especially for the highly suitable area range. The BIOCLIM model achieved the highest simulation accuracy, with its estimated current suitable area being located in the subtropical area in China. Basically, the results were consistent with the actual E. pleiosperma distribution area, suggesting that the BIOCLIM simulation results were relatively accurate and reliable. Therefore, the BIOCLIM model was selected to estimate the potential distribution of E. pleiosperma under the future climate scenario.

3.4. Estimation of the Potential Distribution of E. pleiosperma under the Future Climate Scenario

The potential suitable area distribution results estimated based on the BIOCLIM model under different emission scenarios (SSP126, SSP370, and SSP585) in 2041–2060 and 2081–2100 are displayed in Figure 6 and Table 6. The distribution of various suitable area grades in the future potential distribution area varied to varying degrees. Under different climate scenarios, the future suitable area still presented zonal distribution, accompanied by severe habitat fragmentation, and the high suitable area remained narrow. Under the SSP126 scenario, the total suitable area will increase from 8.36% to 8.70% and later decrease to 8.60%. The highly suitable habitat area will decrease from 0.67% to 0.60% and later increase to 0.69%. Under the SSP370 emission scenario, the total suitable habitat area will increase from 8.36% to 8.43% and subsequently decrease to 8.14%, while the highly suitable habitat area will increase from 0.67% to 0.72% and later decrease to 0.61%. Under the SSP585 scenario, the total suitable habitat area will elevate from 8.36% to 8.84% and then decrease to 5.75%. The highly suitable habitat area will increase from 0.67% to 0.79% and later decrease to 0.41%. Relative to the current scenario, the total suitable area under the future SSP126 scenario will finally increase to 0.25%, that under the SSP370 emission scenario will decrease by 0.21%, and that under the SSP585 emission scenario will decrease by 2.6%.
Under the three emission concentrations, the total suitable habitat area exhibited first a gain and then a loss trend from the current to the future scenarios. Apart from the SSP126 scenario, the variation trend in the highly suitable habitat area will be basically consistent with that of the total suitable habitat area. Under the SSP585 highest emission concentration scenario, E. pleiosperma will obtain the greatest highly suitable habitat area and total suitable habitat area in 2041–2060, compared to the smallest highly suitable habitat area and total suitable habitat area in 2081–2100. The low-suitability areas will account for a large proportion of the total suitable area, followed by medium-suitability areas, and high-suitability areas will occupy the lowest proportion.

3.5. Dynamic Variation in Potential Suitable Area under the Future Climate Scenarios

Based on the results estimated by the BIOCLIM model, the edge and central area in the current potential suitable habitat were greatly susceptible to climate change, exhibiting gain and loss to varying degrees. The change areas were sparsely distributed and fragmented (Figure 7, Table 7). Compared with the current potential distribution area, the gain and loss areas of the suitable habitat under the SSP126 scenario in 2041–2060 will be 107.25 × 10³ km2 and 70.95 × 10³ km2, respectively. To be specific, the gain areas will be concentrated in Sichuan, Shanxi, Henan, Hunan, and Yunnan, while the lost areas will be concentrated in Sichuan, Fujian, Gansu, and Ningxia. Under the SSP370 scenario, the gain area of suitable habitat will be 70.90 × 10³ km2, whereas the lost areas are still concentrated in the Sichuan area, with the total lost area of 61.79 × 10³ km2. Under the SSP585 scenario, the lost area of suitable habitat will be 60.95 × 10³ km2. The maximum gain area will be obtained (112.29 × 10³ km2), mainly in provinces including Henan, Shanxi, Shaanxi, Guangdong, and Hunan.
Compared with 2041–2060, more significant fluctuations will be observed in suitable habitats in 2081–2100. Under the SSP126 scenario, the gain areas will occur in the Gansu, Shaanxi, Tibet, Sichuan, Jiangxi, and Fujian areas, with a total area of 95.67 × 10³ km2. Meanwhile, the lost areas will be highly similar to the gain areas from the current scenario to 2041–2060, with a total lost area of 104.61 × 10³ km2. Under the SSP370 scenario, the gain and lost areas of suitable habitats will be close, mainly in Yunnan, Fujian, and Jiangxi. Under the SSP585 scenario, the suitable habitats will present a lost trend on the whole. The suitable habitats in Yunnan, Sichuan, Chongqing, Gansu, Shaanxi, Hunan, and Guangxi will be substantially decreased, the habitat degradation will be aggravated, and the total lost area will reach 401.74 × 10³ km2, ranking top among the lost areas of suitable habitats among all the paths. In addition, this value is increased by 321.28 × 10³ km2 compared with the gain area. Particularly, the suitable areas in the east of Tibet at the south of Gansu will increase significantly.
The gain area of suitable habitats will be greater than the lost area under the three emission scenarios in 2041–2060, indicating the increased area of suitable habitats during this future period. On the contrary, the lost area will be greater than the gain area in 2081–2100, indicating the gradually decreased area of suitable habitats during this future period. Moreover, the area of stable regions from the current to future climate scenarios will change significantly. Under the SSP585 emission scenario, the highest stable habitat area will be the highest (802.14 × 10³ km2) in 2041–2060, while the lowest stable habitat area (512.69 × 10³ km2) will be observed in 2081–2100.

3.6. Changes in Suitable Habitat Centroid under Different Climatic Scenarios

The centroid location can be calculated according to the potential suitable area of E. pleiosperma under different climate scenarios estimated by the BIOCLIM model. Thus, the migration trajectory and trend of suitable habitats can be determined. As displayed in Figure 8, under the SSP126 scenario, the centroid coordinates of the current suitable habitat are (29.30° N, 105.57° E), which will migrate to (29.30° N, 105.86° E) in 2041–2060, and to (29.21° N, 106.07° E) in 2081–2100. Under the SSP370 scenario, the centroid will migrate from (29.30° N, 105.57° E) to (29.34° N, 105.69° E) and later to (29.34° N, 105.86° E). Under the SSP585 scenario, the centroid will migrate from (29.30° N, 105.57° E) to (29.21° N, 105.89° E) and then to (29.71° N, 104.69° E).
In the future scenarios, the centroid of E. pleiosperma will mostly be distributed in the southwest of Chongqing City. However, under the SSP585 scenario in 2081–2100, the centroid will suddenly migrate to the northwest and finally to the southeast of Sichuan. The moving trajectory of the centroid also varies: migrating southeastward under the SSP126 scenario, northeastward under the SSP370 scenario, and northwestward under the SSP585 scenario. The centroid of the future suitable habitat will be evenly distributed in the southwest of China. Under the SSP370 medium-emission and SSP585 high-emission scenarios, the potential distribution areas may migrate to the higher northern latitude area, whereas they show a trend to the lower northern latitude areas under the SSP126 low-emission scenario.

4. Discussion

4.1. Comparison of Performance for the Three Niche Models

For decades, various niche models have been widely used to estimate the potential suitable distribution of species. However, certain differences still exist in the estimation of the same species by different models. Choosing the appropriate niche model is a vital part of the research process [54]. In this study, the BIOCLIM, MaxEnt, and DOMAIN models were selected to eliminate the overfitting of environmental variables. During a comprehensive comparison of the two evaluation methods, the AUC and Kappa values of the BIOCLIM model were the highest and the standard deviation was the smallest. The estimation results were consistent with the actual sample point distribution. Therefore, it is concluded that the BIOCLIM model has the best performance and reliable results, and it is the most suitable for estimating the potential geographical distribution of E. pleiosperma in the future.
The current suitable area of E. pleiosperma estimated by the DOMAIN model in this study is far from the other two models, and similar results have been obtained by Wang et al. [50] and Duan et al. [69]. The DOMAlN model is modeled by judging the similarity between the environmental factors at the target point and the environmental factors at the sample point [70]. The results are dependent on the distribution point. Therefore, it is speculated that the wide range of simulated suitable areas may be the result of the false behavior unique to the DOMAIN model.

4.2. Major Environmental Variables Affecting the Potential Distribution

E. pleiosperma prefers fertile and moist soils and is characterized by cold and drought resistance [37]. The estimation results of this study showed that bio6, bio2, and bio12 were the main environmental factors influencing their distribution. The contribution rate of precipitation was 39.4%, and the contribution rate of temperature was 31.9%. The results showed that temperature and precipitation were the main factors affecting the geographical distribution pattern of E. pleiosperma. This can be confirmed by the study of Wu et al. [71], who pointed out that the extreme minimum temperature in the distribution area of E. pleiosperma could reach −18 °C, bio12 being 800–1400 mm. By applying the niche model to estimate the potential suitable areas of other relict plants, it was also verified that temperature and precipitation were the main factors which could affect their distributions. For example, Ye et al. [72] found during studies of Glyptostrobus pensilis that the minimum temperature of the coldest month and the annual precipitation were the key factors influencing its distribution. Wu et al. [73] pointed out during their study on two sibling species of Taxus Linn that temperature and precipitation were two major environmental factors affecting the T. mairei distribution, while the T. chinensis distribution was restricted by temperature. Similarly, other studies on Davidia involucrate Baill. [74] and Abies chensiensis [75] have also shown that temperature and precipitation have a greater impact.
Temperature variation can affect plant distribution through influencing processes including seed germination, water absorption, photosynthesis, reproduction, and growth [17,76]. The extremely cold weather is the minimum temperature in the coldest month, which has been considered as the major factor and the limiting variable in determining the extent of forest distribution [77,78]. Low temperature will induce plant death from frostbite; similarly, the extremely high temperature will also destroy the plant water balance and the internal tissues and suppress plant development [17]. At the same time, precipitation will affect species growth, morphology, phenology, and biomass accumulation, and it can lead to changes in plant height and seed yield, causing a change in distribution [76,79]. The relatively high precipitation and water utilization rate are beneficial for seedling emergence and growth. Nonetheless, when the water yield exceeds the ecological demand of the species, it will destroy the water equilibrium and restrict plant growth. Another study has shown that excessive soil water content has a negative effect on the growth of subalpine forest trees with a similar living environment to E. pleiosperma [79].
In addition, altitude was another major factor which could affect E. pleiosperma distribution. This study estimated that the suitable altitude range for E. pleiosperma growth was 1026.2–3139.9 m. Based on the relevant research, E. pleiosperma is extensively distributed at altitudes of 1100–3600 m [35,39,80]. With a decrease in altitude, the distribution of E. pleiosperma accordingly decreases. Above an altitude of 2090 m, the seed emergence rate is high, whereas the seedling death rate is low. By contrast, at altitudes of <900 m, the seed emergence rate is low and the seedling death rate is high [80]. These previous studies have reported results which are basically consistent with the present study. E. pleiosperma relies on the wind to spread and has the potential to migrate to higher altitude areas [39]. Populations in the lower altitude areas are vulnerable to future climate change due to the lack of seedlings [22,80].

4.3. Changes of Potential Distribution Areas under the Future Climate Scenarios

In 2021, as indicated by the sixth evaluation report released by the Intergovernmental Panel on Climate Change (AR6), global temperature and precipitation will continue to increase by 2100 if current trends continue [2]. Based on the three classical concentration paths of low, medium, and high emissions, this study used the BIOCLIM model to estimate the potential distribution of E. pleiosperma in China under climate change.
The current suitable area of E. pleiosperma estimated in this study is mainly distributed in southwest China and its surrounding areas, which is similar to the habitat of the E. pleiosperma derived from previous studies [37]. The results of this study demonstrate that under the different scenarios of 2041–2060 and 2081–2100, the suitable habitat of E. pleiosperma is still mainly located in the southwest. In particular, Guizhou, Sichuan, and other places represent highly suitable areas for its growth. The central and southern parts of China are shelters for relict plants to cope with the climate turmoil during the Quaternary glacial period, providing long-term stable habitats for species survival [19].
Our results suggest that the total suitable area of E. pleiosperma will expand during 2041–2060 under the three scenarios. In 2081–2100, the SSP370 and SSP585 scenarios will shrink, while the SSP126 scenario will be the opposite. This suggests that future extreme climate change is unsuitable for the stable growth of E. pleiosperma. Our results also show that, with the increasing emission concentration, the potential distribution areas of E. pleiosperma will become more dispersed and unstable. Comparatively, the lower emission scenario indicates that global warming is effectively controlled, which is more conducive for the growth of E. pleiosperma. This can be supported by a study on species extinction. One study indicated that, in 2050, the species extinction rate under the smallest climate warming scenario will be 18%, while that under the medium degree scenario will be 24%, and that under the highest degree scenario will be 35% [81]. This demonstrates that the continuous increase in emission concentration will decrease the species’ suitable habitat.
When investigating the dynamic variation in the potential distribution under the future climate condition, it is more convenient and more accurate to apply gravity center movement to represent the responses of species distribution to climate change considering the border irregularity of the suitable habitat [17]. The estimation results of this study show that the movement of the gravity center of the potential distribution area for E. pleiosperma moves in different directions under different emission scenarios. Under the medium- and high-emission scenarios, the gravity center of E. pleiosperma will finally migrate northward, while that under the low-emission scenario will migrate southward. This suggests that climate change greatly influences the distribution of E. pleiosperma. Moreover, the migration trend of the gravity center to the northern higher latitude area will be more obvious as the emission concentration increases. Under the SSP585 emission scenario, the gravity center of E. pleiosperma distribution shifted sharply, which could be supported by the results of Zhang et al. [82] and Hao et al. [83]. Under the SSP585 scenario, the annual mean temperature in China will be increased by 5.8 °C in 2021–2100, which is more than double compared to the SSP370 scenario [82]. E. pleiosperma is a cold-resistant and heat-intolerant plant. The temperature rise under the SSP585 scenario may exceed its adaptation threshold, raising the lowest elevation line of its distribution [83]. Climate warming will result in a decline in the regeneration ability of the E. pleiosperma population in low altitude and low latitude areas, and the population will even disappear in certain areas [84]. This will lead to the shrinkage of the suitable area of E. pleiosperma in southern China and the migration of the potential habitat center to the northwest.
Studies have pointed out that future climate warming may lead to a greater moisture level in higher latitude areas, and a majority of animals and plants will migrate to the higher latitude and higher altitude areas to address climate change [29,85]. As reported in a study concerning L. boulard, the species migrated northward at a high rate in the presence of obviously increasing temperatures [86]. In addition, a study based on 100 invasive species demonstrates that the number of invasive species in the northern hemisphere is greater than that in the southern hemisphere, presenting shrinkage in the lower latitude area [87]. When investigating the relation of species change with climate warming, Chen et al. [88] discovered that species distribution migrated to the higher latitude area at a rate of 16.9 km per 10 years.
It is of note that from the distribution of E. pleiosperma, a few individuals are far away from other trees, indicating these individuals have different adaptation mechanisms to the environment and climate from other trees, while our study only reflects the general response of E. pleiosperma to the environment and climate. Therefore, further analysis of the specific response of tree individuals or regional tree subpopulations to the environment, such as genetic or phenotypic adaptability, may help people better respond to certain specific factors and environmental changes in tree growth. This may also provide a new direction for the future protection of E. pleiosperma.

4.4. Study Limitations

However, there are some limitations in this study. Improving these aspects in future work will enable further contributions to the research:
(i) Limitations of modeling. Any study based on a niche model inevitably has deviations and limitations [52]. The model in our research can investigate the potential distribution of suitable habitats but cannot reflect the changes caused by human activities. Factors including urbanization trajectory and land-use patterns also play an important role in the distribution of E. pleiosperma [89,90], and these affect the estimation ability of the model. Since the interactions between human activities and species distribution can show very complex mechanisms, the effects of human activities are not addressed in our modeling. In future studies, these interactions should be included to improve the accuracy of model estimation and provide a reference for establishing long-term protected areas.
(ii) Limitations of data resolution. At present, in the study of estimating species distribution, 2.5 arc-minutes and 30 arc-seconds are two commonly used resolutions, both of which are well estimated [91,92]. In this study, the changes in the suitable area of E. pleiosperma were estimated using 2.5 arcs of data, indicating that this resolution can satisfy the model’s needs [44,50,69]. Since our study performed comparisons of three niche models, in order to ensure the good operation of the models simultaneously, this study selected the data of 2.5 arc-minutes resolution, which may be one of the limiting factors of our study. Certainly, the utilization of 30 arc-second data may obtain better results but would require a high data-processing capability. The limitation resulting from the choice of resolution may, for instance, reduce the simulation ability of the estimation model [93,94]. In the future, we will consider using higher resolution data to enhance the accuracy of our results.
(iii) Limitations of variable screening. When selecting variables, we used the Pearson correlation coefficient. This coefficient is often used to describe a linear correlation [95], which may result in the inaccurate expression of the contribution rate of environmental factors [52,96]. In future studies, more conceptual methods can be used to investigate the effects of linear, nonlinear, and covariate predictors, such as the random forest model (B-RF), which can enhance the rationality of variable screening and improve system modeling.
(iv) Limitations of climate models. This study focuses on the comparison of niche models, and the choice of the climate model is mainly to serve the purpose of estimating the suitable area of E. pleiosperma. Through comparing the simulation and measured results, the BCC-CSM2-MR model can meet research needs. However, without the comparison of multiple climate models, it is impossible to select the most suitable climate model to optimize the estimation of suitable habitats, and this may influence the screening of climate factors. In the future, we will consider multiple global climate models, use the same simulation parameters to evaluate the uncertainty of our ability to simulate future climate variability, as well as compare the estimation results of the ensemble estimation of multiple climate models.

4.5. Implications of the Conservation of E. pleiosperma

It has been indicated that under the influence of climate change and other environmental factors, the future potential suitable habitat area of E. pleiosperma may shrink and the habitat conditions will become more severe. Based on the results of changes in the suitable habitat of E. pleiosperma under future climate scenarios, certain reasonable suggestions can be provided.
At present, the wild resources of E. pleiosperma are in an endangered state. A survey found that E. pleiosperma has a special habitat and has difficulty in reproducing itself; thus, artificial nurturing and seed introduction are effective measures to expand its population [80]. As a result, artificial seed introduction can be considered in the future suitable habitat expansion areas including eastern Tibet, southern Gansu, and central and southern Shaanxi. In addition, the decline of E. pleiosperma is also closely related to anthropogenic disturbance damage [35]. Therefore, considering the trajectory of human activities, establishing long-term protected areas and prohibiting destructive use are the main measures recommended to protect biodiversity and maintain sustainable development [97], which can contribute to the full development of the collar springwood community. The model results indicate that regardless of future climate scenarios, central Guizhou, Chongqing, southern Gansu, southern Shaanxi, and western Hubei are highly suitable areas for E. pleiosperma. These areas are less affected by climate and have a more suitable environment for its survival, making them good choices for establishing long-term nature reserves. E. pleiosperma seeds need sufficient light during germination and their seedlings have difficulty in emerging, while their survival rate increases when they grow into young trees [40]; thus, establishing a seed bank to ensure seed germination and seedling growth also provides an effective method. The above suggestions may be beneficial for conserving E. pleiosperma in the context of climate change, which is expected to shrink the habitat of this species.

5. Conclusions

To conclude, this study selected the optimal model from the three niche models (MaxEnt, BIOCLIM, and DOMAIN) to estimate the potential suitable habitat area of E. pleiosperma and to explore the pattern dynamics under climate change conditions. Our results suggested that the BIOCLIM model was the optimal model to estimate E. pleiosperma distribution and that temperature was the most critical factor restricting the geographical distribution pattern of E. pleiosperma, followed by precipitation and altitude. However, more research is needed to determine the specific contribution of each factor in order to determine the influencing factors more accurately, especially in methods using multiple SDM-model combinations. Under the current climate scenario, the potential suitable areas were mainly distributed in the central and southwestern areas. Under the future SSP126 scenario, the suitable habitat area showed expansion, and those under the other two emission scenarios exhibited shrinkage, with more fierce variation in the suitable habitat under the high-emission scenario. Under the medium- and high-emission scenarios, the potential suitable area for E. pleiosperma will migrate northward; under the low-emission scenario, the area will migrate southward. In the current high-suitability areas, the establishment of nature reserves and seed resource banks and the protection of wild populations can be carried out. Under the future climate scenarios, artificial guidance is recommended to ensure the smooth migration of E. pleiosperma to the expansion areas. Moreover, our research results can provide a reference for the protection and management of E. pleiosperma, which is of great benefit for sustainable development.
In future research work, the following four points need to be focused on: (i) the use of climate model groups composed of multiple climate models and improving data accuracy; (ii) the combination with other methods to screen the influencing variables, such as a random forest framework trained by the Boruta algorithm (B-RF); (iii) the incorporation of other influencing factors into the model; and (iv) further analysis of the specific response of individual trees or regional tree subpopulations to the environment and climate.

Author Contributions

Conceptualization, H.Z. and T.H.; methodology, S.Z.; software, S.Z.; writing—original draft preparation, H.Z., S.Z., T.H. and J.L.; writing—review and editing, T.H. and S.Z.; visualization, S.Z.; supervision, H.Z. and T.H.; funding acquisition, H.Z.; data curation, J.L. and J.Y.; project administration, T.H. All authors have read and agreed to the published version of the manuscript.

Funding

This research was funded by the National Science and Technology Major Project for Water Pollution Control and Treatment (2017ZX07101002).

Institutional Review Board Statement

Not applicable.

Informed Consent Statement

Not applicable.

Data Availability Statement

All links to input data are reported in the manuscript and all output data are available upon request to the authors.

Acknowledgments

The authors are grateful for funding support from the National Science and Technology Major Project for Water Pollution Control and Treatment.

Conflicts of Interest

The authors declare no conflict of interest.

Appendix A

Table A1. List of Relict Plants.
NumberCategoryNumberCategory
1Ginkgo biloba L.28Gnetum montanum Markgr.
2Glyptostrobus pensilis (Staunton ex D. Don) K. Koch29Pseudolarix amabilis (J. Nelson) Rehder
3Davidia involucrata Baill.30Tetraena mongolica Maxim.
4Metasequoia glyptostroboides Hu & W. C. Cheng31Lycopodium japonicum Thunb.
5Cryptomeria japonica var. sinensis Miq.32Dipteris conjugata (Kaulf.) Reinw.
6Cathaya argyrophylla Chun & Kuang33Equisetum hyemale L.
7Taxus wallichiana var. chinensis (Pilg.) Florin34Ceratopteris thalictroides (L.) Brongn.
8Pseudotaxus chienii (W. C. Cheng) W. C. Cheng35Brainea insignis (Hook.) J. Sm.
9Taiwania cryptomerioides Hayata36Thuja sutchuenensis Franch.
10Nothotsuga longibracteata (W. C. Cheng) Hu ex C. N. Page37Calocedrus macrolepis Kurz
11Abies yuanbaoshanensis Y. J. Lu & L. K. Fu38Fokienia hodginsii (Dunn) A. Henry & H. H. Thomas
12Abies ziyuanensis L. K. Fu & S. L. Mo39Cupressus chengiana S. Y. Hu
13Abies fanjingshanensis W. L. Huang, Y. L. Tu & S. Z. Fang40Taxodium distichum (L.) Rich.
14Keteleeria davidiana var. calcarea (C. Y. Cheng & L. K. Fu) Silba41Podocarpus macrophyllus (Thunb.) Sweet
15Keteleeria fortunei (A. Murray bis) Carrière42Nageia nagi (Thunb.) Kuntze
16Psilotum nudum (L.) P. Beauv.43Dacrycarpus imbricatus (Blume) de Laub.
17Alsophila spinulosa (Wall. ex Hook.) R. M. Tryon44Cyclocarya paliurus (Batalin) Iljinsk.
18Liriodendron chinense (Hemsl.) Sarg.45Bretschneidera sinensis Hemsl.
19Eucommia ulmoides Oliv.46Pteroceltis tatarinowii Maxim.
20Cercidiphyllum japonicum Siebold & Zucc.47Craigia yunnanensis W. W. Sm. & W. E. Evans
21Disanthus cercidifolius subsp. longipes (H. T. Chang) K. Y. Pan48Emmenopterys henryi Oliv.
22Perkinsiodendron macgregorii (Chun) P. W. Fritsch49Hamamelis mollis Oliv.
23Parashorea chinensis H. Wang50Shaniodendron subaequale (H. T. Chang) M. B. Deng & al.
24Liquidambar acalycina H. T. Chang51Litsea auriculata S. S. Chien & W. C. Cheng
25Ostrya rehderiana Chun52Torreya grandis Fortune ex Lindl.
26Aphananthe aspera (Thunb.) Planch.53Tsuga chinensis var. tchekiangensis
27Fagus longipetiolata Seemen54Nyssa sinensis Oliver

References

  1. Li, L.F.; Cao, R.Y.; Wei, K.C.; Wang, W.Z.; Chen, L. Adapting climate change challenge: A new vulnerability assessment framework from the global perspective. J. Clean. Prod. 2019, 217, 216–224. [Google Scholar] [CrossRef]
  2. IPCC. Climate Change 2022: Mitigation of Climate Change, the Working Group III Contribution; Sixth Assessment Report; IPCC: Geneva, Switzerland, 2022. [Google Scholar]
  3. Gillingham, P.K.; Palmer, S.C.F.; Huntley, B.; Kunin, W.E.; Chipperfield, J.D.; Thomas, C.D. The relative importance of climate and habitat in determining the distributions of species at different spatial scales: A case study with ground beetles in Great Britain. Ecography 2012, 35, 831–838. [Google Scholar] [CrossRef] [Green Version]
  4. Zhao, G.H.; Cui, X.Y.; Sun, J.J.; Li, T.T.; Wang, Q.; Ye, X.Z.; Fan, B.G. Analysis of the distribution pattern of Chinese Ziziphus jujuba under climate change based on optimized biomod2 and MaxEnt models. Ecol. Indic. 2021, 132, 108256. [Google Scholar] [CrossRef]
  5. Yang, Y.; Li, T.; Pokharel, P.; Liu, L.; Qiao, J.; Wang, Y.; An, S.; Chang, S.X. Global effects on soil respiration and its temperature sensitivity depend on nitrogen addition rate. Soil Biol. Biochem. 2022, 174, 108814. [Google Scholar] [CrossRef]
  6. Hartikainen, S.M.; Robson, T.M. The roles of species’ relatedness and climate of origin in determining optical leaf traits over a large set of taxa growing at high elevation and high latitude. Front. Plant Sci. 2022, 13, 1058162. [Google Scholar] [CrossRef]
  7. Khanum, R.; Mumtaz, A.S.; Kumar, S. Predicting impacts of climate change on medicinal asclepiads of Pakistan using Maxent modeling. Acta Oecologica-Int. J. Ecol. 2013, 49, 23–31. [Google Scholar] [CrossRef]
  8. Spurgeon, D. Global warming threatens extinction for many species. Nature 2000, 407, 121. [Google Scholar] [CrossRef] [Green Version]
  9. Kattel, G.R. Climate warming in the Himalayas threatens biodiversity, ecosystem functioning and ecosystem services in the 21st century: Is there a better solution? Biodivers. Conserv. 2022, 31, 2017–2044. [Google Scholar] [CrossRef]
  10. Wang, L.; Zhang, B.C.; Shi, Y.; Lu, Z.Y.; Lu, B. Interpretation of the IPCC AR6 on the impacts and risks of climate change. Clim. Chang. Res. 2022, 18, 389–394. [Google Scholar] [CrossRef]
  11. Urban, M.C. Accelerating extinction risk from climate change. Science 2015, 348, 571–573. [Google Scholar] [CrossRef] [Green Version]
  12. Mathes, G.H.; van Dijk, J.; Kiessling, W.; Steinbauer, M.J. Extinction risk controlled by interaction of long-term and short-term climate change. Nat. Ecol. Evol. 2021, 5, 304–310. [Google Scholar] [CrossRef]
  13. Wu, X.P.; Lin, X.; Zhang, Y.; Gao, J.J.; Guo, L.; Li, J.S. Impacts of climate change on ecosystem in Priority Areas of Biodiversity Conservation in China. Chin. Sci. Bull. 2014, 59, 4668–4680. [Google Scholar] [CrossRef]
  14. Li, Y.C.; Li, M.Y.; Li, C.; Liu, Z.Z. Optimized maxent model predictions of climate change impacts on the suitable distribution of Cunninghamia lanceolata in China. Forests 2020, 11, 302. [Google Scholar] [CrossRef] [Green Version]
  15. Maclean, I.M.D.; Wilson, R.J. Recent ecological responses to climate change support predictions of high extinction risk. Proc. Natl. Acad. Sci. USA 2011, 108, 12337–12342. [Google Scholar] [CrossRef]
  16. Roman-Palacios, C.; Wiens, J.J. Recent responses to climate change reveal the drivers of species extinction and survival. Proc. Natl. Acad. Sci. USA 2020, 117, 4211–4217. [Google Scholar] [CrossRef] [PubMed]
  17. Ying, L.X.; Liu, Y.; Chen, S.T.; Shen, Z.H. Simulation of the potential range of Pistacia weinmannifolia in Southwest China with climate change based on the maximum-entropy (Maxent) model. Biodivers. Sci. 2016, 24, 453–461. [Google Scholar] [CrossRef]
  18. Yang, Y.; Dou, Y.X.; Wang, B.R.; Xue, Z.J.; Wang, Y.Q.; An, S.S.; Chang, S.X. Deciphering factors driving soil microbial life-history strategies in restored grasslands. iMeta 2023, 2, e66. [Google Scholar] [CrossRef]
  19. Qiu, Y.X.; Lu, Q.X.; Zhang, Y.H.; Cao, Y.N. Phylogeography of East Asia’s tertiary relict plants: Current progress and future prospects. Biodivers. Sci. 2017, 25, 136–146. [Google Scholar] [CrossRef] [Green Version]
  20. Rotllan-Puig, X.; Traveset, A. Declining relict plants: Climate effect or seed dispersal disruption? A landscape-scale approach. Basic Appl. Ecol. 2016, 17, 81–91. [Google Scholar] [CrossRef]
  21. Yousefzadeh, H.; Amirchakhmaghi, N.; Naseri, B.; Shafizadeh, F.; Kozlowski, G.; Walas, L. The impact of climate change on the future geographical distribution range of the endemic relict tree Gleditsia caspica (Fabaceae) in Hyrcanian forests. Ecol. Inf. 2022, 71, 101773. [Google Scholar] [CrossRef]
  22. Wu, Q.; Zhang, F.; Zhang, J.H.; Wu, Y.Z. Genetic diversity of natural population in an endangered plant species Euptelea pleiosperma Hook.f.et Thoms.based on SCoT markers. Norther Hortic. 2020, 77–82. [Google Scholar] [CrossRef]
  23. Tang, S.Q.; Dai, W.J.; Li, M.S.; Zhang, Y.; Geng, Y.P.; Wang, L.; Zhong, Y. Genetic diversity of relictual and endangered plant Abies ziyuanensis (Pinaceae) revealed by AFLP and SSR markers. Genetica 2007, 133, 21–30. [Google Scholar] [CrossRef]
  24. Li, J.L.; Zhang, Y.J.; Ruhsam, M.; Milne, R.I.; Wang, Y.; Wu, D.Y.; Jia, S.Y.; Tao, T.Z.; Mao, K.S. Seeing through the hedge: Phylogenomics of Thuja (Cupressaceae) reveals prominent incomplete lineage sorting and ancient introgression for Tertiary relict flora. Cladistics 2021, 38, 187–203. [Google Scholar] [CrossRef] [PubMed]
  25. Chen, Y.S.; Deng, T.; Zhou, Z.; Sun, H. Is the East Asian flora ancient or not? Natl. Sci. Rev. 2018, 5, 920–932. [Google Scholar] [CrossRef] [Green Version]
  26. Milne, R.I.; Abbott, R.J. The origin and evolution of tertiary relict floras. Adv. Bot. Res. 2002, 38, 281–314. [Google Scholar] [CrossRef]
  27. Wang, X.Y.; Wang, T.; Xu, J.F.; Shen, Z.H.; Yang, Y.P.; Chen, A.P.; Wang, S.P.; Liang, E.Y.; Piao, S.L. Enhanced habitat loss of the Himalayan endemic flora driven by warming-forced upslope tree expansion. Nat. Ecol. Evol. 2022, 6, 890–899. [Google Scholar] [CrossRef]
  28. Lai, W.F.; Shi, C.; Wen, G.W.; Lü, Z.W.; Ye, L.Q.; Huang, Q.L.; Zhang, G.F. Potential impacts of climate change on the distribution of the relict plant Shaniodendron subaequale. Heliyon 2023, 9, e14402. [Google Scholar] [CrossRef]
  29. Shen, Y.F.; Tu, Z.H.; Zhang, Y.L.; Zhong, W.P.; Xia, H.; Hao, Z.Y.; Zhang, C.G.; Li, H.G. Predicting the impact of climate change on the distribution of two relict Liriodendron species by coupling the MaxEnt model and actual physiological indicators in relation to stress tolerance. J. Environ. Manag. 2022, 322, 116024. [Google Scholar] [CrossRef] [PubMed]
  30. Mahmoodi, S.; Ahmadi, K.; Heydari, M.; Karami, O.; Esmailzadeh, O.; Heung, B. Elevational shift of endangered European yew under climate change in Hyrcanian mountain forests: Rethinking conservation-restoration strategies and management. For. Ecol. Manag. 2023, 529, 120693. [Google Scholar] [CrossRef]
  31. Lin, H.Y.; Li, W.H.; Lin, C.F.; Wu, H.R.; Zhao, Y.P. International biological flora: Ginkgo biloba. J. Ecol. 2022, 110, 951–982. [Google Scholar] [CrossRef]
  32. Zhang, P.; Dong, X.H.; Grenouillet, G.; Lek, S.; Zheng, Y.C.; Chang, J.B. Species range shifts in response to climate change and human pressure for the world’s largest amphibian. Sci. Total Environ. 2020, 735, 139543. [Google Scholar] [CrossRef]
  33. Ayan, S.; Bugday, E.; Varol, T.; Ozel, H.B.; Thurm, E.A. Effect of climate change on potential distribution of oriental beech (Fagus orientalis Lipsky.) in the twenty-first century in Turkey. Theor. Appl. Climatol. 2022, 148, 165–177. [Google Scholar] [CrossRef]
  34. Chen, D.L.; Wang, Q.Y.; Li, Y.B.; Li, Y.D.; Zhou, H.; Fan, Y.L. A general linear free energy relationship for predicting partition coefficients of neutral organic compounds. Chemosphere 2020, 274, 125869. [Google Scholar] [CrossRef] [PubMed]
  35. Wang, F.; He, P.; Zheng, Y.F. Coenoecological research of Euptelea pleiospermum—An endangered plant species. J. Southwest Univ. 2015, 37, 65–70. [Google Scholar] [CrossRef]
  36. Wolfe, J.A. Tertiary climatic fluctuations and methods of analysis of tertiary floras Palaeogeogr. Palaeoclimatol. Palaeoecol. 1971, 9, 27–57. [Google Scholar] [CrossRef]
  37. Chen, C.A. Euptelea pleiospermum Cultivation Technology. Pract. For. Technol. 2011, 113, 51–52. [Google Scholar] [CrossRef]
  38. Wu, H.; Meng, H.J.; Wang, S.T.; Wei, X.Z.; Jiang, M.X. Geographic patterns and environmental drivers of seed traits of a relict tree species. For. Ecol. Manag. 2018, 422, 59–68. [Google Scholar] [CrossRef]
  39. Meng, H.J.; Wei, X.Z.; Jiang, M.X. Contrasting elevational patterns of genetic variation in Euptelea pleiospermum along mountains at the core and edges of its latitudinal range. Plant Ecolog. 2019, 220, 13–28. [Google Scholar] [CrossRef]
  40. Wei, X.Z.; Meng, H.J.; Jiang, M.X. Landscape genetic structure of a streamside tree species Euptelea pleiospermum (Eupteleaceae): Contrasting roles of river valley and mountain ridge. PLoS ONE 2013, 8, e66928. [Google Scholar] [CrossRef] [Green Version]
  41. Hong, S.; Jang, I.; Kim, D.; Kim, S.; Park, H.S.; Lee, K. Predicting potential habitat changes of two Invasive Alien Fish species with climate change at a Regional Scale. Sustainability 2022, 14, 6093. [Google Scholar] [CrossRef]
  42. Leroy, B. Choosing presence-only species distribution models. J. Biogeogr. 2023, 50, 247–250. [Google Scholar] [CrossRef]
  43. Lembrechts, J.J.; Nijs, I.; Lenoir, J. Incorporating microclimate into species distribution models. Ecography 2019, 42, 1267–1279. [Google Scholar] [CrossRef]
  44. Kaky, E.; Nolan, V.; Alatawi, A.; Gilbert, F. A comparison between Ensemble and MaxEnt species distribution modelling approaches for conservation: A case study with Egyptian medicinal plants. Ecol. Inf. 2020, 60, 101150. [Google Scholar] [CrossRef]
  45. Padalia, I.; Srivastava, V.; Kushwaha, S.P.S. Modeling potential invasion range of alien invasive species, Hyptis suaveolens (L.) Poit. in India: Comparison of MaxEnt and GARP. Ecol. Inf. 2014, 22, 36–43. [Google Scholar] [CrossRef]
  46. Li, Z.J.; Liu, Y.M.; Zeng, H. Application of the MaxEnt model in improving the accuracy of ecological red line identification: A case study of Zhanjiang, China. Ecol. Indic. 2022, 137, 108767. [Google Scholar] [CrossRef]
  47. Kumar, P. Assessment of impact of climate change on Rhododendrons in Sikkim Himalayas using Maxent modelling: Limitations and challenges. Biodivers. Conserv. 2012, 21, 1251–1266. [Google Scholar] [CrossRef]
  48. Akpan, G.E.; Adepoju, K.A.; Oladosu, O.R.; Adelabu, S.A. Dominant malaria vector species in Nigeria: Modelling potential distribution of Anopheles gambiae sensu lato and its siblings with MaxEnt. PLoS ONE 2018, 13, 0204233. [Google Scholar] [CrossRef] [PubMed]
  49. Zhang, H.T.; Wang, W.T. Prediction of the potential distribution of the endangered species meconopsis punicea maxim under future climate change based on four species distribution models. Plants 2023, 12, 1376. [Google Scholar] [CrossRef]
  50. Wang, G.Z.; Gen, Q.F.; Xiao, M.Y.; Zhang, M.Y.; Zhang, Y.Y.; Wang, Z.S. Predicting Pseudolarix amabilis potential habitat based on four Niche models. Acta Ecol. Sin. 2020, 40, 6096–6104. [Google Scholar] [CrossRef]
  51. Lee, W.H.; Song, J.W.; Yoon, S.H.; Jung, J.M. Spatial evaluation of machine learning-based species distribution models for prediction of invasive Ant species distribution. Appl. Sci. 2022, 12, 10260. [Google Scholar] [CrossRef]
  52. Tsoar, A.; Allouche, O.; Steinitz, O.; Rotem, D.; Kadmon, R. A comparative evaluation of presence-only methods for modelling species distribution. Divers. Distrib. 2007, 13, 397–405. [Google Scholar] [CrossRef]
  53. Walter, M.; Brugger, K.; Rubel, F. Usutu virus induced mass mortalities of songbirds in Central Europe: Are habitat models suitable to predict dead birds in unsampled regions? Prev. Vet. Med. 2018, 159, 162–170. [Google Scholar] [CrossRef]
  54. Duan, R.Y.; Kong, X.Q.; Huang, M.Y.; Fan, W.Y.; Wang, Z.G. The predictive performance and stability of six species distribution models. PLoS ONE 2014, 9, e112764. [Google Scholar] [CrossRef] [PubMed] [Green Version]
  55. Kumar, P.; Sarthi, P.P. Intraseasonal variability of Indian Summer Monsoon Rainfall in CMIP6 models simulation. Theor. Appl. Climatol. 2021, 145, 687–702. [Google Scholar] [CrossRef]
  56. Wu, T.W.; Lu, Y.X.; Fang, Y.J.; Xin, X.G.; Li, L.; Li, W.; Jie, W.; Zhang, J.; Liu, Y.; Zhang, L.; et al. The Beijing Climate Center Climate System Model (BCC-CSM): The main progress from CMIP5 to CMIP6. Geosci. Model Dev. 2019, 12, 1573–1600. [Google Scholar] [CrossRef] [Green Version]
  57. Liu, L.; Guan, L.L.; Zhao, H.X.; Huang, Y.; Mou, Q.Y.; Liu, K.; Chen, T.T.; Wang, X.Y.; Zhang, Y.; Wei, B.; et al. Modeling habitat suitability of Houttuynia cordata Thunb (Ceercao) using MaxEnt under climate change in China. Ecol. Inf. 2021, 63, 101324. [Google Scholar] [CrossRef]
  58. Yang, Q.J.; Li, R. Predicting the Potential Suitable Habitats of Alsophila spinulosa and their Changes. Chin. J. Appl. Ecol. 2021, 32, 538–548. [Google Scholar] [CrossRef]
  59. Zhao, H.X.; Zhang, H.; Xu, C.G. Study on Taiwania cryptomerioides Under Climate Change: MaxEnt Modeling for Predicting the Potential Geographical Distribution. Glob. Ecol. Conserv. 2020, 24, e01313. [Google Scholar] [CrossRef]
  60. Graham, M.H. Confronting multicollinearity in ecological multiple regression. Ecology 2003, 84, 2809–2815. [Google Scholar] [CrossRef] [Green Version]
  61. Sheng, Q.Q.; Wang, C.; Wang, L.F.; Liu, Y.C.; Geng, X.M.; Zhu, Z.L. Prediction of Suitable Habitat of Paeonia suffruticosa Andr. in China by DIVA-GIS. Non-Wood For. Res. 2022, 40, 205–213+248. [Google Scholar] [CrossRef]
  62. Yang, X.Q.; Kushwaha, S.P.S.; Saran, S.; Xu, J.C.; Roy, P.S. Maxent modeling for predicting the potential distribution of medicinal plant, Justicia adhatoda L. in Lesser Himalayan foothills. Ecol. Eng. 2013, 51, 83–87. [Google Scholar] [CrossRef]
  63. Zhai, X.Y.; Shen, Y.F.; Zhu, S.H.; Tu, Z.H.; Zhang, C.G.; Li, H.G. Potential impacts of climate change in future on the geographical distributions of Relic Liriodendron chinense. J. Trop. Subtrop. Bot. 2021, 29, 151–161. [Google Scholar] [CrossRef]
  64. Hernandez, P.A.; Graham, C.H.; Master, L.L.; Albert, D.L. The effect of sample size and species characteristics on performance of different species distribution modeling methods. Ecography 2006, 29, 773–785. [Google Scholar] [CrossRef]
  65. Allouche, O.; Tsoar, A.; Kadmon, R. Assessing the accuracy of species distribution models: Prevalence, kappa and the true skill statistic (TSS). J. Appl. Ecol. 2006, 43, 1223–1232. [Google Scholar] [CrossRef]
  66. Swets, J.A. Measuring the accuracy of diagnostic systems. Science 1988, 240, 1285–1293. [Google Scholar] [CrossRef] [Green Version]
  67. Qazi, A.W.; Saqib, Z.; Zaman-ul-Haq, M. Trends in species distribution modelling in context of rare and endemic plants: A systematic review. Ecol. Process. 2022, 11, 1–11. [Google Scholar] [CrossRef]
  68. Zhang, X.Y.; Zhao, J.; Li, Z.P.; Wang, M.M.; Chen, H. Prediction of the Potential Suitable Areas of Amaranthus palmeri in China Based on Four Ecological Niche Models. Plant Prot. 2023, 49, 73–82. [Google Scholar] [CrossRef]
  69. Duan, Y.Z.; Wang, C.; Wang, H.T.; Du, Z.Y.; He, Y.M.; Chai, G.Q. Predicting the Potential Distribution of Ammopiplanthus Species in China under Different Climales Using Ecological Niche Models. Acta Ecol. Sin. 2020, 40, 7668–7680. [Google Scholar] [CrossRef]
  70. Xie, C.X.; Zhang, Q.; Bai, G.Y. Ecological Characteristics and Regionalization of Xanthoceras sorbifolia Bunge, a Woody Energy Plant. Plant Sci. J. 2018, 36, 229–236. [Google Scholar] [CrossRef]
  71. Wu, J.G. The potential effects of climate change on the distributions of seven arbors plants in China. Plant Divers. Resour. 2011, 33, 335–349. [Google Scholar] [CrossRef]
  72. Ye, X.Z.; Zhang, M.Z.; Yang, Q.Y.; Ye, L.Q.; Liu, Y.P.; Zhang, G.F.; Chen, S.P.; Lai, W.F.; Wen, G.W.; Zheng, S.Q.; et al. Prediction of suitable distribution of a critically endangered plant Glyptostrobus pensilis. Forests 2022, 13, 257. [Google Scholar] [CrossRef]
  73. Wu, X.T.; Wang, M.Q.; Li, X.y.; Yan, Y.D.; Dai, M.J.; Xie, W.; Zhou, X.F.; Zhang, D.L.; Wen, Y.F. Response of distribution patterns of two closely related species in Taxus genus to climate change since last inter-glacial. Ecol. Evol. 2022, 12, e9302. [Google Scholar] [CrossRef] [PubMed]
  74. Tang, J.F.; Zhao, X.Z. Forecasting the combined effects of future climate and land use change on the suitable habitat of Davidia involucrata Baill. Ecol. Evol. 2022, 12, e9023. [Google Scholar] [CrossRef] [PubMed]
  75. Dong, P.B.; Wang, L.Y.; Wang, L.J.; Jia, Y.; Li, Z.H.; Bai, G.; Zhao, R.M.; Liang, W.; Wang, H.Y.; Guo, F.X.; et al. Distributional response of the rare and Endangered Tree Species Abies chensiensis to climate change in East Asia. Biology 2022, 11, 1659. [Google Scholar] [CrossRef]
  76. Su, Z.D.; Huang, X.J.; Zhong, Q.Y.; Liu, M.L.; Song, X.Y.; Liu, J.N.; Fu, A.G.; Tan, J.L.; Kou, Y.X.; Li, Z.H. Change of Potential Distribution Area of a Forest Tree Acer davidii in East Asia under the Context of Climate Oscillations. Forests 2021, 12, 689. [Google Scholar] [CrossRef]
  77. Choi, S.; Lee, W.K.; Son, Y.; Yoo, S.; Lim, J.H. Changes in the distribution of South Korean forest vegetation simulated using thermal gradient indices. Sci. China-Life Sci. 2010, 53, 784–797. [Google Scholar] [CrossRef]
  78. Hijmans, R.J.; Graham, C.H. The ability of climate envelope models to predict the effect of climate change on species distributions. Glob. Chang. Biol. 2006, 12, 2272–2281. [Google Scholar] [CrossRef]
  79. Naudiyal, N.; Wang, J.; Ning, W.; Gaire, N.P.; Peili, S.; Wei, Y.; Jiali, H.; Ning, S. Potential distribution of Abies, Picea, and Juniperus species in the sub-alpine forest of Minjiang headwater region under current and future climate scenarios and its implications on ecosystem services supply. Ecol. Indic. 2021, 121, 107131. [Google Scholar] [CrossRef]
  80. Yue, F.N.; Han, T.Y.; Zhang, Y.F. Investigation, protection and utilization of habitat conditions of Euptelea pleiosperm germplasm resources. Spec. Econ. Anim. Plants 2019, 22, 18–24. [Google Scholar]
  81. Thomas, C.D.; Cameron, A.; Green, R.E.; Bakkenes, M.; Beaumont, L.J.; Collingham, Y.C.; Erasmus, B.F.N.; de Siqueira, M.F.; Grainger, A.; Hannah, L.; et al. Extinction risk from climate change. Nature 2004, 427, 145–148. [Google Scholar] [CrossRef] [Green Version]
  82. Zhang, J.S.; Chen, X.D.; Peng, S.Z. Trend and Spatiotemporal Differences of Annual Mean Temperature in China from 2001 to 2100. J. South West Univ. 2022, 44, 112–124. [Google Scholar] [CrossRef]
  83. Hao, Z.Q.; Dai, L.M.; He, H.S.; Malandnoff, D.J.; Shao, F.G. Potential Response of Major Tree Species to Climate Warming in Changbai Mountain, Northeast China. Chin. J. Appl. Ecol. 2001, 12, 653–658. [Google Scholar] [CrossRef]
  84. Chen, H.; Jiang, M.X. Potential Impacts of Climate Warming on Distribution of Euptelea pleiospermum along Altitude: An Experimental Simulation. Plant Sci. J. 2011, 29, 655–661. [Google Scholar] [CrossRef]
  85. Delava, E.; Allemand, R.; Leger, L.; Fleury, F.; Gibert, P. The rapid northward shift of the range margin of a Mediterranean parasitoid insect (Hymenoptera) associated with regional climate warming. J. Biogeogr. 2014, 41, 1379–1389. [Google Scholar] [CrossRef]
  86. Celine, B.; Wilfried, T.; Boris, L.; Piero, G.; Michel, B.; Franck, C. Will climate change promote future invasions? Glob. Chang. Biol. 2013, 19, 3740–3748. [Google Scholar] [CrossRef]
  87. Chen, I.C.; Hill, J.K.; Ohlemueller, R.; Roy, D.B.; Thomas, C.D. Rapid range shifts of species associated with high levels of climate warming. Science 2011, 333, 1024–1026. [Google Scholar] [CrossRef]
  88. Queiros, A.M.; Huebert, K.B.; Keyl, F.; Fernandes, J.A.; Stolte, W.; Maar, M.; Kay, S.; Jones, M.C.; Hamon, K.G.; Hendriksen, G.; et al. Solutions for ecosystem-level protection of ocean systems under climate change. Glob. Chang. Biol. 2016, 22, 3927–3936. [Google Scholar] [CrossRef] [Green Version]
  89. Benito, B.M.; Montserrat Martinez-Ortega, M.; Munoz, L.M.; Lorite, J.; Penas, J. Assessing extinction-risk of endangered plants using species distribution models: A case study of habitat depletion caused by the spread of greenhouses. Biodivers. Conserv. 2009, 18, 2509–2520. [Google Scholar] [CrossRef]
  90. Kafaei, S.; Akmali, V.; Sharifi, M. Using the ensemble modeling approach to predict the potential distribution of the muscat Mouse-Tailed Bat, Rhinopoma muscatellum (Chiroptera: Rhinopomatidae), in Iran. Iran. J. Sci. Technol. Trans. A-Sci. 2020, 44, 1337–1348. [Google Scholar] [CrossRef]
  91. Zhang, S.; Liu, X.G.; Li, R.; Wang, X.L.; Cheng, J.H.; Yang, Q.L.; Kong, H. AHP-GIS and MaxEnt for delineation of potential distribution of Arabica coffee plantation under future climate in Yunnan, China. Ecol. Indic. 2021, 132, 108339. [Google Scholar] [CrossRef]
  92. Guga, S.; Xu, J.; Riao, D.; Li, K.W.; Han, A.; Zhang, J.Q. Combining MaxEnt model and landscape pattern theory for analyzing interdecadal variation of sugarcane climate suitability in Guangxi, China. Ecol. Indic. 2021, 131, 108152. [Google Scholar] [CrossRef]
  93. Shaffrey, L.C.; Stevens, I.; Norton, W.A.; Roberts, M.J.; Vidale, P.L.; Harle, J.D.; Jrrar, A.; Stevens, D.P.; Woodage, M.J.; Demory, M.E.; et al. U.K. HiGEM: The New U.K. High-Resolution Global Environment Model—Model Description and Basic Evaluation. J. Clim. 2009, 22, 1861–1896. [Google Scholar] [CrossRef] [Green Version]
  94. Hu, Y.Y.; Xu, Y.; Li, J.J.; Han, Z.Y. Evaluation on the performance of CMIP6 global climate models with different horizontal resolution in simulating the precipitation over China. Clim. Chang. Res. 2021, 17, 730–743. [Google Scholar] [CrossRef]
  95. Ly, A.; Marsman, M.; Wagenmakers, E.-J. Analytic posteriors for Pearson’s correlation coefficient. Stat. Neerl. 2018, 72, 4–13. [Google Scholar] [CrossRef] [Green Version]
  96. Elith, J.; Graham, C.H.; Anderson, R.P.; Dudik, M.; Ferrier, S.; Guisan, A.; Hijmans, R.J.; Huettmann, F.; Leathwick, J.R.; Lehmann, A.; et al. Novel methods improve prediction of species’ distributions from occurrence data. Ecography 2006, 29, 129–151. [Google Scholar] [CrossRef] [Green Version]
  97. Porfirio, L.L.; Harris, R.M.B.; Lefroy, E.C.; Hugh, S.; Gould, S.F.; Lee, G.; Bindoff, N.L.; Mackey, B. Improving the use of species distribution models in conservation planning and management under climate change. PLoS ONE 2014, 9, e113749. [Google Scholar] [CrossRef] [PubMed] [Green Version]
Figure 1. Distribution records of Euptelea pleiosperma.
Sustainability 15 11035 g001
Figure 2. The AUC and Kappa value of the three models for the estimation results of the current potential suitable areas.
Sustainability 15 11035 g002
Figure 3. Jackknife test of the importance of environmental variables in MaxEnt.
Sustainability 15 11035 g003
Figure 4. Response curves of main environmental variables.
Sustainability 15 11035 g004
Figure 5. Potential geographical distribution of E. pleiosperma under the current climate scenario based on MaxEnt (A), BIOCLIM (B), and DOMAIN (C).
Sustainability 15 11035 g005
Figure 6. Potential distribution of E. pleiosperma under future climate change scenarios based on BIOCLIM.
Sustainability 15 11035 g006
Figure 7. Changes in the potential distribution of E. pleiosperma based on BIOCLIM under different climate change conditions. (A) Change from present day to future (2041–2060) under SSP126; (B) change from future (2041–2060) to future (2081–2100) under SSP126; (C) change from present day to future (2041–2060) under SSP370; (D) change from future (2041–2060) to future (2081–2100) under SSP370; (E) change from present day to future (2041–2060) under SSP585; (F) change from future (2041–2060) to future (2081–2100) under SSP585.
Sustainability 15 11035 g007
Figure 8. Changes of the gravity center of the potential suitable region of E. pleiosperma and its moving tendency under different climate scenarios based on BIOCLIM.
Sustainability 15 11035 g008
Table 1. Environmental variables used in SDMs.
TypeCodeVariableUnit
Temperaturebio2Mean diurnal range°C
bio3Isothermality (×100)%
bio6Min temperature of coldest month°C
bio7Temperature annual range°C
bio10Mean temperature of warmest quarter°C
Precipitationbio12Annual precipitationmm
bio15Precipitation seasonality%
TerrainaltAltitudem
sloSlope°
aspAspect°
SoilphPondus hydrogenii-
Table 2. Accuracy represented by AUC and Kappa.
AccuracyAUCKappa
Excellent0.9–10.85–1
Good0.8–0.90.7–0.85
Average0.7–0.80.55–0.7
Poor0.6–0.70.4–0.55
Fail0.5–0.6<0.4
Table 3. The criteria for classification of suitable habitat grades.
Suitability GradesMaxEntBIOCLIMDOMAIN
High suitability0.49–1126–34888–100
Medium suitability0.25–0.4960–12680–88
Low suitability0.08–0.2517–6073–80
Unsuitable0–0.080–170–73
Table 4. Contribution rate of environmental variables based on MaxEnt.
CodeEnvironmental VariableContribution Rate (%)
bio6Min temperature of coldest month37.8
bio12Annual precipitation31.9
altAltitude13.5
sloSlope6.2
bio3Isothermality (×100)4.4
bio2Mean diurnal range1.6
phPondus hydrogenii1.2
bio10Mean temperature of warmest quarter1.1
bio7Temperature annual range0.9
aspAspect0.9
bio15Precipitation seasonality0.5
Table 5. Suitable areas for E. pleiosperma in China under the current climate scenario (103 km2).
Suitability GradesMaxEntBIOCLIMDOMAIN
High262.8964.22160.90
Medium422.25214.761805.13
Low783.30525.581894.79
Total1468.44804.545860.82
Table 6. Suitable area for E. pleiosperma in China based on BIOCLIM under different climate scenarios (103 km2).
Suitability
Grades
SSP126SSP370SSP585
1970–20002041–20602081–21002041–20602081–21002041–20602081–2100
High64.2057.6666.2069.3158.3676.1639.23
Medium214.76255.36196.05235.37271.10248.62102.82
Low525.58524.90566.69507.79454.89526.86412.18
Total804.54837.92828.94812.47784.35851.64554.23
Table 7. Suitable area for E. pleiosperma in China based on BIOCLIM under different climate scenarios (103 km2).
ChangeSSP126SSP370SSP585
2041–20602081–21002041–20602081–21002041–20602081–2100
Gain107.2595.6770.9046.47112.2980.46
Stable792.13794.77801.29795.71802.14512.69
Lost70.95104.6161.7976.4860.95401.74
Disclaimer/Publisher’s Note: The statements, opinions and data contained in all publications are solely those of the individual author(s) and contributor(s) and not of MDPI and/or the editor(s). MDPI and/or the editor(s) disclaim responsibility for any injury to people or property resulting from any ideas, methods, instructions or products referred to in the content.

