
Selection of Abies nephrolepis Materials for Restoration of Genetic Diversity in Mt. Gariwangsan Degraded Area

Forest Bioinformation Division, National Institute of Forest Science, Suwon 16631, Republic of Korea
*
Author to whom correspondence should be addressed.
Sustainability 2023, 15(10), 7749; https://doi.org/10.3390/su15107749
Submission received: 31 March 2023
/
Revised: 2 May 2023
/
Accepted: 3 May 2023
/
Published: 9 May 2023
(This article belongs to the Special Issue Sustainable Management of Forest Genetic Resources in Response to Climate Change)
Abstract
:This study proposes a strategy for selecting materials for Abies nephrolepis, a key subalpine species, to restore damaged forests in Mt. Gariwangsan while considering genetic diversity. The genetic diversity distribution of A. nephrolepis in Korea was evaluated using nuclear simple-sequence repeat (nSSR) markers and the genetic differences between populations were analyzed. A suitable genetic restoration population was selected and a strategy for selecting restoration materials was presented. The genetic diversity indices of 326 individuals across 10 populations, and the genetic relationships between populations, were analyzed using AMOVA, principal coordinate analysis, UPGMA, and STRUCTURE analysis. The genetic diversity of A. nephrolepis populations averaged 0.791, indicating relatively high genetic diversity. The results showed that the genetic differentiation pattern of A. nephrolepis was divided into two groups: Mt. Jungwangsan and other populations. Therefore, genetically diverse restoration materials can be secured from the Mt. Gariwangsan population to restore damaged areas. We found that individuals distributed within approximately 10 m were autocorrelated due to their high genetic similarity, whereas they were randomly distributed in the range of 15 m or more. The optimal sampling strategy involved collecting seeds from a minimum of 25 individuals within 10 m. This study suggests that genetic diversity in restoration material selection is necessary to enhance adaptability to environmental changes.
1. Introduction
Genetic diversity is critical for the long-term survival of species and provides the raw materials for their adaptation, evolution, and survival, especially under changing environmental conditions [1]. Therefore, the maintenance and conservation of genetic diversity are essential for responding to rapid changes in environmental conditions, such as recent climate change [2,3,4]. Genetic diversity is reduced by the effects of genetic drift or inbreeding, owing to decreased distribution area and habitat fragmentation [5,6,7]. A reduced genetic diversity in populations reduces the adaptability and resilience of species to long-term environmental changes, leading to population declines [8,9]. Strategies that consider genetic resource conservation are needed, especially for rare species with small populations, as they may lose genetic resources specifically needed for environmental adaptation [1]. According to a previous study, Gapare et al. (2008) proposed sampling 150 individuals at 30 m intervals as the optimal sampling strategy to secure the genetic diversity of Picea sitchensis [10]. Furthermore, Blanc-Jolivet and Degen (2014) reported that 25 individuals should be sampled to ensure the genetic diversity of Prunus avium [11]. Iwaizumi et al. (2021) reported that a collection of seeds from 30 mother trees of Abies veitchii var. shikokiana contained almost all of the genetic variability observed in adult tree populations [12]. Chae et al. (2022) reported that sampling 35 individuals at 10 m intervals was the most effective in a study on selecting restoration materials for Abies koreana considering genetic diversity [13]. However, measures to protect genetic diversity are still lacking [14].
The Food and Agriculture Organization of the United Nations (FAO) [15] noted that when restoring degraded or disturbed forests, it is important to use genetically appropriate restoration materials to increase adaptability to future environmental conditions. Furthermore, the introduction of nonlocal genotypes results in genetic pollution resulting in the loss of locally adapted genotypes [13,16]. Therefore, it is important to use restoration materials that ensure the preservation of genetic traits within the native population [8,13,16,17].
Alpine and subalpine forest ecosystems are highly sensitive to external environmental changes due to harsh climatic conditions and low productivity. Therefore, when disturbed or destroyed, it is difficult or may take a long time to recover [18]. Subalpine conifers have experienced a rapid decline in both population and distribution, which can be attributed to a range of environmental factors, including low temperatures, dry soils, and strong winds. Additionally, human activities and climate change have significantly contributed to this decline [19,20]. Species or populations in subalpine areas are experiencing habitat fragmentation, making them vulnerable to extinction as climate change progresses [21].
Among the subalpine areas in Korea, Mt. Gariwangsan (1561 m) has a high conservation value due to the distribution of many specialties and rare plants, especially subalpine plants, such as Abies nephrolepis, A. holophylla, Taxus cuspidata, and Betula ermanii, and was designated as a forest genetic resource conservation area (totaling 2475 ha) in 2008 for protection [22]. However, in 2018, 78.3 ha (approximately 3% of the total area) was artificially damaged due to the construction of ski slopes [23]. The development of mountainous areas has negative effects on forest ecosystems, such as environmental costs incurred for recovery [24], decreased greenhouse gas uptake and additional emissions [25], forest fragmentation [26], and habitat loss [27]. In addition, areas with damaged vegetation are at risk of landslides caused by heavy rainfall in the summer; therefore, urgent restoration is required [28].
Khingan fir (Abies nephrolepis (Trautv. ex Masim.) Maxim.), one of the core tree species of the subalpine region of Mt. Gariwangsan, is an evergreen coniferous tree distributed in the subalpine regions of northern China, eastern Russia, and the Gyeonggi and Gangwon provinces of Korea, and that reaches a height of 25 m. It is an economic species used for building materials, pulpwood, and as an ornamental tree [20,29]. It is a major timber resource in Northeast Asia; its overall population is decreasing owing to logging, and its distribution area is continuously decreasing due to the difficulty of young tree renewal [20]. As a result, it was assessed as a Least Concern (LC) species on the International Union for Conservation of Nature (IUCN) Red List in 2013 [30], has been receiving increasing attention, and has been selected as a plant targeted for climate change adaptation on the Korean Peninsula [31]. Recently, the vulnerability of A. nephrolepis was recognized through research on the development and implementation of conservation strategies for subalpine conifer species in Korea [20].
The aim of this study was to develop a strategy for selecting appropriate materials for restoring damaged areas on Mt. Gariwangsan using A. nephrolepis, while considering the preservation and maintenance of genetic diversity. To achieve this, the genetic diversity of A. nephrolepis distributed across Korea was assessed and compared among populations using nuclear simple-sequence repeat (nSSR) markers. We aimed to identify genetically appropriate populations of A. nephrolepis on Mt. Gariwangsan and determine the spatial genetic structure of these populations, with the aim of proposing strategies for selecting appropriate materials for restoration. We believe that this study will be useful in establishing a rare plant species restoration strategy considering genetic diversity.
2. Materials and Methods
2.1. Study Site and Plant Materials
The study sites were subalpine, above 1200 m and on 10 mountains in Republic of Korea where A. nephrolepis are distributed, including Mt. Gariwangsan (1561 m), Mt. Joongwangsan (1376 m), Mt. Seoraksan (1708 m), Mt. Taebaeksan (1567 m), Mt. Odeasan (1565 m), Mt. Hwaaksan (1468 m), Mt. Sobaeksan (1440 m), Mt. Jangsan (1408 m), Mt. Balwangsan (1458 m), and Mt. Bangtaesan (1436 m) [20]. Approximately 30 individual trees (ranging from 18 to 35 trees) were sampled per site by needle collection (Figure 1, Table 1). Needles were collected from trees located more than 30 m apart to avoid selecting closely related individuals in all populations.
2.2. DNA Extraction and nSSR Marker Analysis
Genomic DNA was extracted from the fresh needles of mature trees using a Plasmid SV mini kit (GeneAll Biotechnology, Seoul, Republic of Korea). Concentration and purity of the extracted DNA were measured using a NanoDrop 2000 spectrophotometer (Thermo Scientific, Wilmington, DE, USA).
Nuclear simple-sequence repeat (nSSR) markers are located in the nuclear genome and are commonly used to analyze genetic variation in populations due to their co-dominant characteristics [32,33,34]. For this study, ten markers (AK087, AK240, AK246, AK252, As13, As20, NFF7, NFH15, Aat04, and Aat12) that were stably amplified in A. nephrolepis were selected by referring to A. koreana [35], A. sachalinensis [36], A. nordmanniana [37], and A. alba [38]. The results were checked for genotyping errors using a Micro-Checker program [39]. Seven primers (without the occurrence of null alleles, large allele dropouts, or stutter bands) were selected (Table 2). Each primer was labeled with the JOE or FAM fluorescent dye.
Polymerase chain reaction (PCR) for DNA amplification was performed with 15 μL reaction mixtures, containing 20 ng of genomic DNA template, 1× reaction buffer, 0.2 μM primers, 0.2 mM dNTPs, 2.5 mM MgCl2, and 2.5 Unit Taq DNA polymerase (Biofact, Daejeon, Republic of Korea). PCR amplification was performed by initial denaturation at 94 °C for 5 min, followed by 35 cycles of denaturation at 94 °C for 1 min, annealing at 55–63 °C for 1 min (for the annealing temperatures see Table 2), extension at 72 °C for 1 min, and a final extension at 72 °C for 8 min. The PCR products were run on an ABI 3730 xl Genetic Analyzer (Applied Biosystems, Thermo Fisher Scientific, Foster City, CA, USA). Gene Mapper v5.0 (Applied Biosystems, Thermo Fisher Scientific) was used to identify alleles and determine genotypes.
2.3. Genetic Diversity Analysis
GeneAIEx 6.5 [40] was used to analyze genetic diversity indices, such as the average allele number (A), effective allele number (Ae), observed heterozygosity (Ho), expected heterozygosity (He), and fixed index (F) for each population.
Analysis of Molecular Variance (AMOVA) was performed to examine differences in genetic variance among populations. Principal coordinates analysis (PCoA) using Nei’s genetic distance was performed to determine genetic relationships between populations. Cluster analysis using the UPGMA method was performed with the POPTREE2 software to show the genetic relationships between populations in a dendrogram [41]. Bayesian cluster analysis was performed to determine the genetic structure of the population. A pre-specified number of gene clusters (∆K) was calculated using StructureSelector software [42]. The optimal K value was analyzed using STRUCTURE v2.3 [43,44] In addition, the study assumed a prespecified number of gene clusters (K) ranging from 1 to 10, and each simulation was conducted 10 times for each K value. To ensure accuracy, all runs comprised 300,000 Markov chain Monte Carlo samplings with a burn-in period of 300,000 iterations. StructureSelector software was used to visualize the results [43].
2.4. Genetic Spatial Autocorrelation Analysis
To select genetically suitable restoration materials based on the genetic spatial structure of the population, spatial autocorrelation analysis was performed using GeneAIEx v.6.5 [40]. Analysis was conducted on 99 A. nephrolepis individuals from Mt. Gariwangsan, and their location and genetic information were used (Figure 2). The distance class was performed using 10 classes at intervals of 5 m, and 999 permutations were performed for each class. The significance of the autocorrelation was verified by calculating a 95% confidence interval [45].
2.5. Comparison between Sampling Strategies
Inter-individual spacing for sampling was based on the target distance inferred from the spatial genetic structure. Using a Python script, individuals were randomly selected according to seven sampling units at intervals of the target distance. The number of alleles with frequencies greater than 0.05 were analyzed and compared according to the sampling strategy [13]. Mean comparisons were performed using Duncan’s test at p ≤ 0.05 using the agricolae package in R [46].
3. Results
3.1. Genetic Diversity
The genetic diversity of A. nephrolepis populations showed that the number of alleles (A) in each population ranged from 7.9 (JW) to 13.4 (OD), with an average of 11.1, and the number of effective alleles (Ae) ranged from 4.417 (JW) to 7.055 (JA), with an average of 6.259 (Table 3). The expected heterozygosity (He), which can be used to assess genetic diversity, averaged 0.791, whereas observed heterozygosity (Ho) averaged 0.794. The three populations (JA, SB, and TB) located in the southern region, exhibited relatively high levels of genetic diversity (Figure 1). The fixation coefficient (F), which indicates the degree of inbreeding within a population, ranged from −0.061 (SB) to 0.069 (JW), and was low, with an average of −0.002.
3.2. Genetic Relationships among Populations
AMOVA analysis to determine the degree of genetic differentiation between A. nephrolepis populations showed that only 3% of the total genetic variation was among populations (p < 0.01), whereas the remaining 97% was within populations (Table 4). The genetic differentiation between populations had an FST value of 0.034.
Principal Coordinate Analysis (PCoA) was performed to visualize the relationships among A. nephrolepis populations. We found that 75.67% of the total genetic variation could be explained by 3 principal components (PC 1 = 41.41%, PC 2 = 18.70%, PC 3 = 15.56%). The distributions of principal components 1 and 2 can be divided into two groups (Figure 3). The JW is separated from the right side.
To investigate the genetic relationships between A. nephrolepis populations, we performed UPGMA to build a dendrogram and found that JW and the other populations were divided into two genetic groups (Figure 4). The overall patterns of gene differentiation revealed by PCoA and UPGMA were consistent.
Figure 4.
Dendrogram using the UPGMA method for ten Abies nephrolepis populations. Detailed information on each populations is presented in Table 1. The best number of genetic clusters (K), calculated using StructureSelector, was found to be two (Figure 5). Bayesian clustering analysis with ∆K = 2 showed that the proportions of the two clusters in each population were similar except for JW (Figure 6).

Figure 5.
The best number of genetic clusters (K) calculated by StructureSelector. (a) The mean log-likelihood value (± standard deviation) for each K value; (b) the delta K value for each K value.
Figure 5.
The best number of genetic clusters (K) calculated by StructureSelector. (a) The mean log-likelihood value (± standard deviation) for each K value; (b) the delta K value for each K value.

Figure 6.
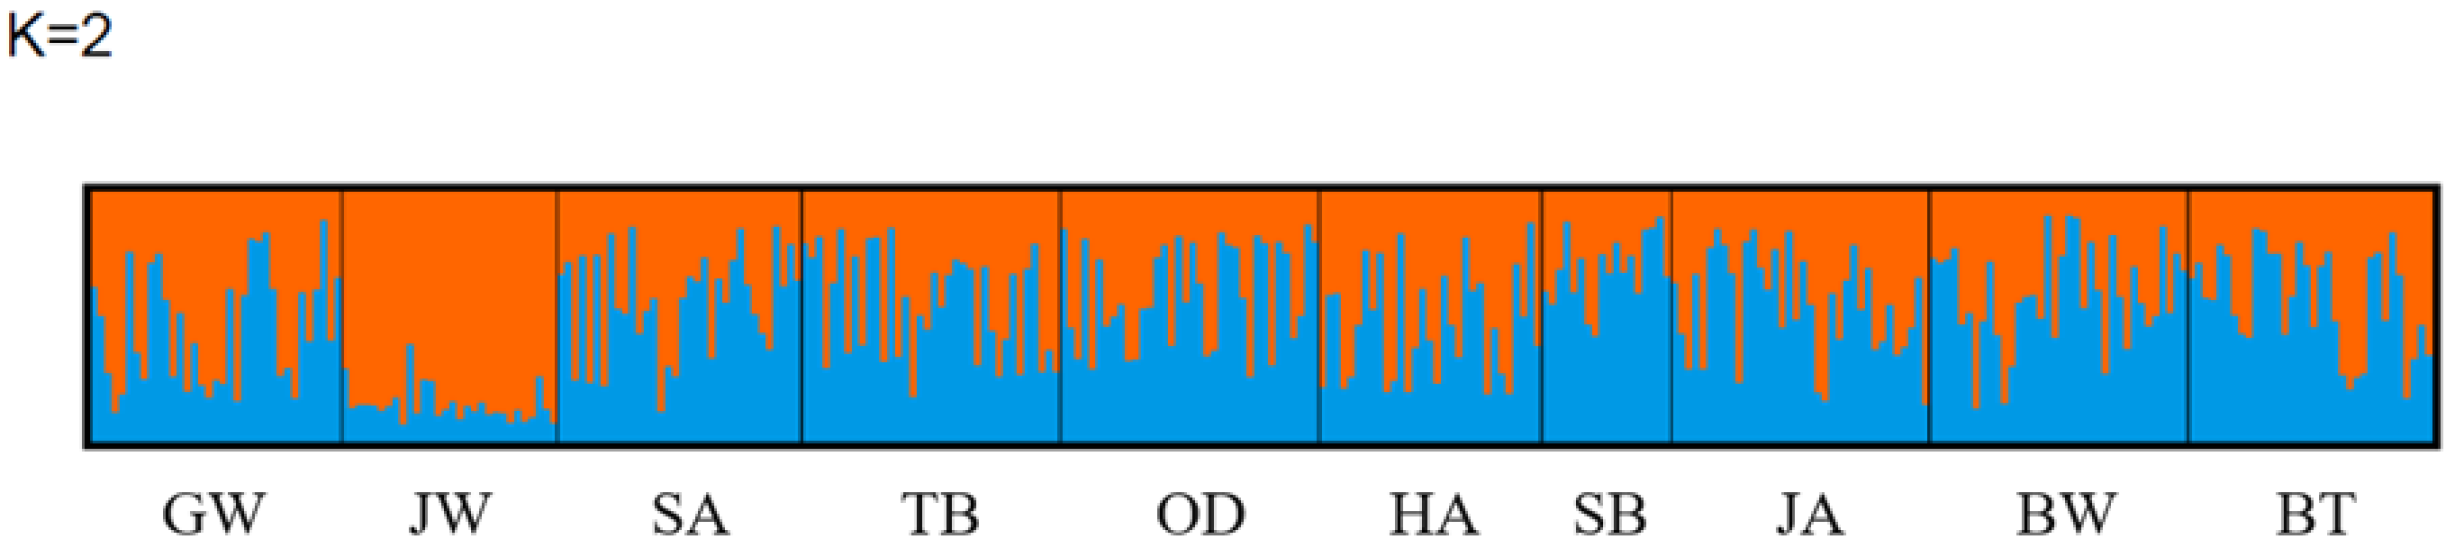
Bayesian clustering analysis to detect population genetic structure using STRUCTURE (K = 2). Orange and blue shades represent a genetic cluster. Detailed information on each populations is presented in Table 1.
Figure 6.
Bayesian clustering analysis to detect population genetic structure using STRUCTURE (K = 2). Orange and blue shades represent a genetic cluster. Detailed information on each populations is presented in Table 1.

3.3. Genetic Spatial Structure
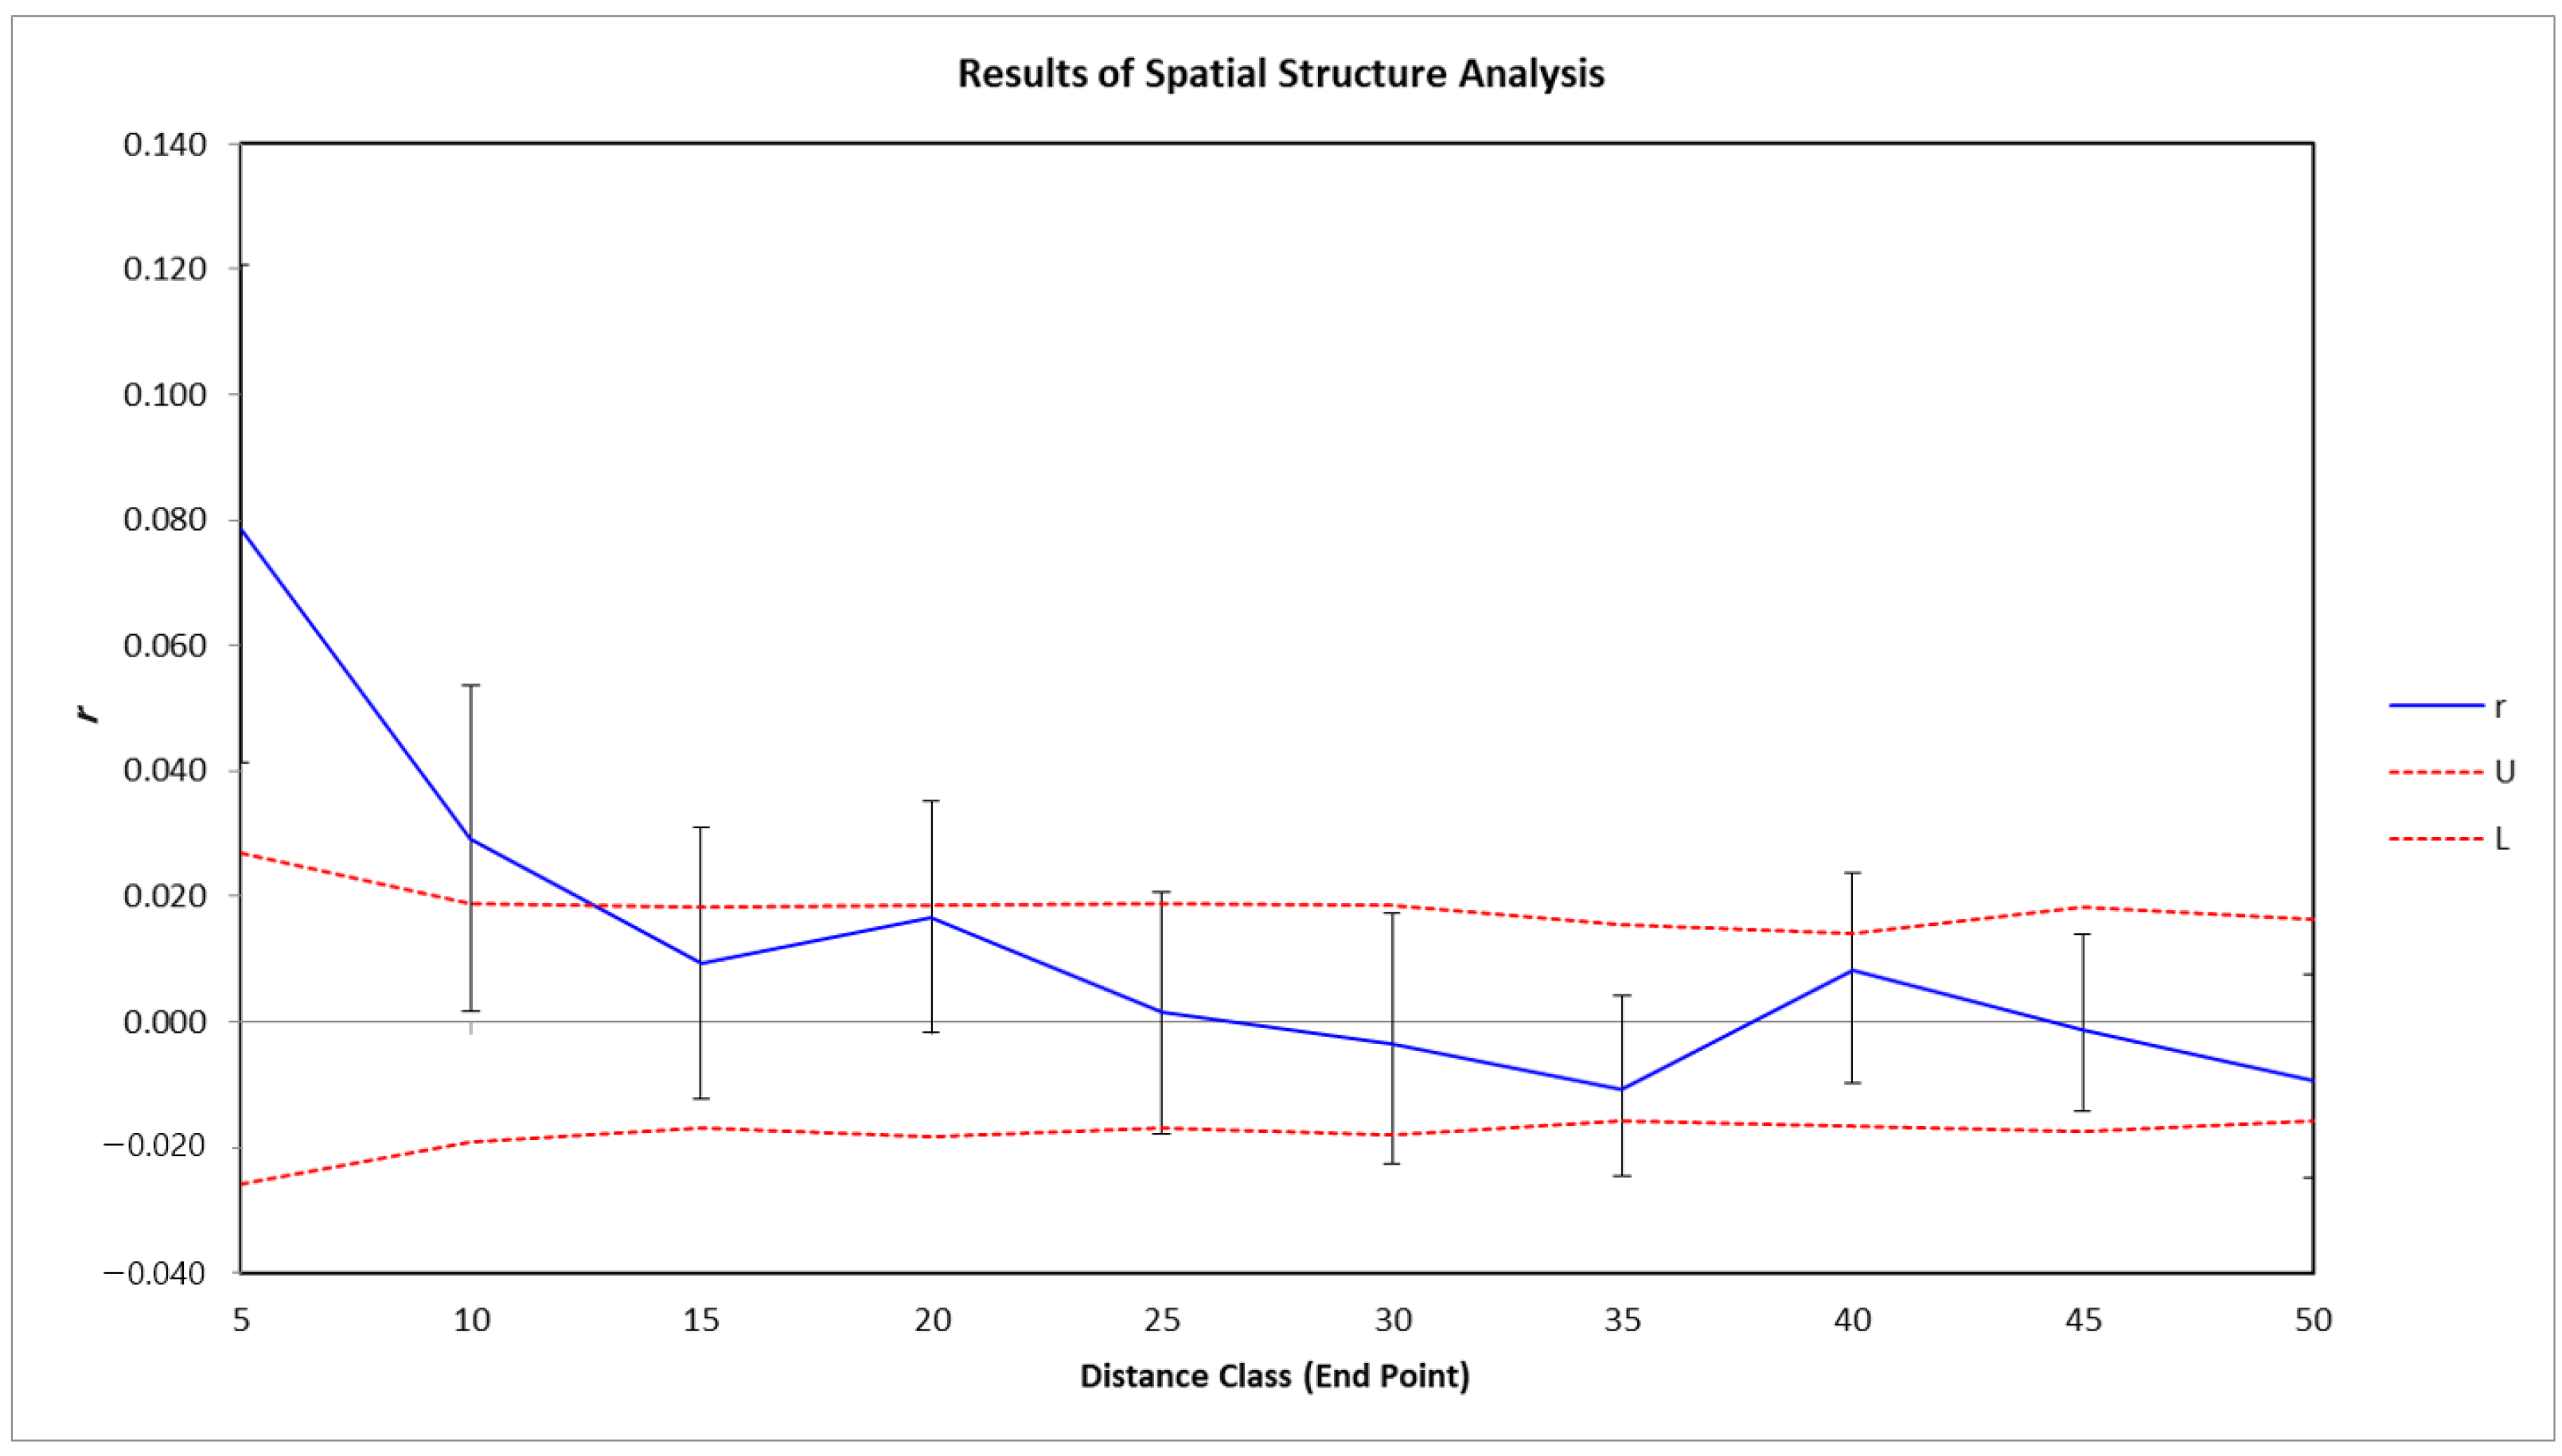
To avoid genetically similar samples when selecting restoration materials, a spatial autocorrelation analysis was performed on the genetic variation of the A. nephrolepis population on Mount Gariwangsan (Figure 7). The results of the spatial autocorrelation analysis showed that individuals distributed within approximately 10 m were autocorrelated due to their high genetic similarity, whereas they were randomly distributed in the range of 15 m or more.
3.4. Comparison between Sampling Strategies
To identify the minimum sampling required to secure the genetic diversity of A. nephrolepis on Mt. Gariwangsan, samples were randomly extracted at a distance of 10 m to analyze the genetic diversity of alleles with frequencies greater than 0.05. When more than 15 individuals were sampled from the population, more than 95% of all alleles were available, and when more than 25 individuals were sampled, more than 99% of all alleles were available (Table 5).
4. Discussion
4.1. Genetic Diversity of A. nephrolepis Populations
According to the results of the present study, the genetic diversity (He) of A. nephrolepis was found to be 0.791 on average, which was higher than that of A. koreana (He = 0.759) [47]. Compared to other Abies species, such as A. firma (0.747) [48], A. alba (0.724) [49], A. cilicica (0.689) [50], A. pinsapo (0.596) [51], A. fraseri (0.442) [52], and A. ziyuanensis (0.337) [6], A. nephrolepis showed relatively high genetic diversity. Additionally, the genetic diversity of coniferous species analyzed using nSSR markers was reported to be 0.815 for Picea abies [53], 0.79 for Pinus sylvestris [54], 0.704 for Nothotsuga longibracteata [55], 0.652 for Picea omorika [56], 0.610 for Pinus koraiensis [57], and 0.406 for Picea jezoensis [58]. Therefore, the genetic diversity of A. nephrolepis is relatively high compared to that of other coniferous species. Breeding systems are an important factor in determining the genetic diversity of plant species [59]. A. nephrolepis is thought to maintain a high level of genetic diversity, since its seeds are dispersed by wind and undergo outcrossing [60].
4.2. Genetic Relationship between A. nephrolepis Populations
Genetic differentiation and gene flow are important indicators for evaluating the genetic structure of species [61]. AMOVA, which was performed to determine genetic differentiation among populations, showed that only 3% of the total genetic variation was due to differences among populations (Table 3). These results are consistent with those of previous studies on long-lived woody species that have shown that genetic differences among populations are generally less than 10% and that most genetic variation is shared among populations [33,62]. Moreover, studies have shown that species with wide geographical ranges, outcrossing mating systems, and wind-assisted seed dispersal have high genetic diversity within species and populations, but low genetic differentiation among populations [62,63]. A study on A. koreana, which has physiological characteristics similar to A. nephrolepis, showed a 3.7% difference in genetic variation among 6 populations, similar to the results for A. nephrolepis [47].
The UPGMA and PCoA results showed that the genetic differentiation pattern of A. nephrolepis was divided into two groups: the JW group and other populations (Figure 3 and Figure 4). If natural populations have a common founder and have undergone stable evolutionary processes, geographically closer populations should exhibit closer genetic relationships [64]. However, in the present study, the overall genetic relationships among the ten populations did not match their geographical relationships. For example, TB and OD, as well as JA and BT, showed close genetic relationships, but were geographically distant. Particularly, JW, which is geographically close to GW and BW, exhibited the most distant genetic relationships. Such discrepancies between genetic relationships and the geographic distribution of populations could be due to human interference or disturbances caused by the regeneration processes following devastation [64].
Bayesian clustering analysis was conducted to determine the genetic patterns of A. nephrolepis (Figure 6). The optimal number of clusters (K) calculated using StructureSelector was 2, and Bayesian cluster analysis revealed that the genetic pattern of A. nephrolepis was represented by the ratio of the 2 clusters. This distribution pattern of Bayesian clusters was similar to the distribution of populations observed in UPGMA and PCoA.
Analyses of the genetic diversity, genetic differentiation, relationships, and patterns of A. nephrolepis showed that the genetic diversity of A. nephrolepis was relatively stable, and the genetic variation among populations was small. However, JW showed a lower effective allele number (Ae = 4.417) and expected heterozygosity (He = 0.725) than other populations, indicating a relatively different genetic characteristic from GW, which is the restoration target area. The appropriate selection of candidate populations for conservation is necessary to preserve genetic characteristics in natural habitats [64]. Although JW is geographically close (approximately 3.5 km) to GW, it is more appropriate to select restoration materials from populations other than JW in order to maintain the unique genetic diversity of Mt. Gariwangsan.
4.3. Spatial Genetic Structure of A. nephrolepis on Mt. Gariwangsan
Our results show that there is no large genetic variation (3%) among populations, and that GW displays stable genetic diversity (He = 0.786). Therefore, genetically diverse restoration materials can be secured from the population of Mt. Gariwangsan to restore damaged areas. To establish a strategy for selecting restoration materials, 99 A. nephrolepis individuals were selected from the natural habitat of Mt. Gariwangsan (Figure 2). The spatial autocorrelation of the population was analyzed to avoid similar genetic samples. It was found that individuals distributed within approximately 10 m were autocorrelated due to their high genetic similarity, whereas they were randomly distributed in the range of 15 m or more. According to previous studies, the spatial genetic structure of A. koreana, a species closely related to A. nephrolepis, in the Hallasan population, was found to be 5–10 m, which is lower than the findings of this study [13]. The spatial size and distribution of a population are strongly influenced by seed dispersal mechanisms and tree density [65,66]. Additionally, a greater plant height is more likely to disperse seeds over greater distances [67]. Species of Abies, such as A. koreana and A. nephrolepis, have seed dispersal mechanisms that utilize wind [60]. Owing to its lower tree density (201.7) than that of A. koreana on Hallasan (647.9), A. nephrolepis on Mt. Gariwangsan is thought to have a larger genetic structure size [20]. Moreover, the average height of A. nephrolepis on Mt. Gariwangsan is 5.2 m, while that of A. koreana on Hallasan is approximately 4.2 m [13]. Differences in height are also considered one of the causes of spatial genetic structural differences.
4.4. Selection Strategy for Restoration Materials
An analysis of the genetic diversity of A. nephrolepis collected at various sample sizes with 10 m spacing in the Mt. Gariwangsan population showed that if more than 15 individuals were sampled, over 95% of all alleles (with frequencies greater than 0.05) could be obtained. Additionally, when more than 25 individuals were sampled, over 99% of all alleles (with frequencies greater than 0.05) were identified (Table 5). Therefore, seeds were collected from a minimum of 25 individuals to determine the genetic diversity of the A. nephrolepis population on Mt. Gariwangsan. In a study on the selection of restoration materials for A. koreana that considered genetic diversity, 35 restoration materials were suitable for the efficient detection of various alleles in the target population [13]. A. nephrolepis was capable of obtaining all alleles (with frequencies greater than 0.05) with a relatively small sample size. According to a previous study, the optimal sampling strategy to secure the genetic diversity of Picea sitchensis is to sample 150 individuals at 30 m intervals [10]. To ensure the genetic diversity of Abies veitchii var. shikokiana, the collection of at least 30 mother trees is suggested [12] and, to secure the genetic diversity of Prunus avium, a broad-leaved tree, it has been reported that it is most appropriate to collect seeds from 25 individuals [11]. As a result, the optimal sampling strategy for obtaining genetic diversity restoration materials for A. nephrolepis in the damaged area of Mt. Gariwangsan was to collect seeds from a minimum of 25 individuals with a 10 m spacing. Restoration materials collected using this sampling strategy can be used not only for restoring damaged habitats but also for ex situ conservation.
Author Contributions
Methodology, H.-I.L.; Formal analysis, H.-N.S.; Investigation, H.-N.S. and H.-I.L.; Writing—original draft, H.-N.S.; Writing—review & editing, J.-H.P. and H.-I.L.; Supervision, H.-I.L. All authors have read and agreed to the published version of the manuscript.
Funding
This study was funded by the National Institute of Forest Science (NIFoS) (grant number FG0802-2023-01-2023) of the Republic of Korea.
Institutional Review Board Statement
Not applicable.
Informed Consent Statement
Not applicable.
Data Availability Statement
Not applicable.
Conflicts of Interest
The authors declare no conflict of interest.
References
- Rajora, O.P.; Mosseler, A. Challenges and opportunities for conservation of forest genetic resources. Euphytica 2001, 118, 197–212. [Google Scholar] [CrossRef]
- Ledig, F.T. Conservation of diversity in forest trees: Why and how should genes be conserved? BioScience 1988, 38, 471–479. [Google Scholar] [CrossRef]
- St. Clair, J.B.; Howe, G.T. Strategies for conserving forest genetic resources in the face of climate change. Turk. J. Bot. 2011, 35, 403–409. [Google Scholar] [CrossRef]
- Wehenkel, C.; Mariscal-Lucero, S.D.R.; Jaramillo-Correa, J.P.; López-Sánchez, C.A.; Vargas-Hernández, J.J.; Sáenz-Romero, C. Genetic diversity and conservation of Mexican forest trees. In Biodiversity and Conservation of Woody Plants; Springer: Berlin/Heidelberg, Germany, 2017; pp. 37–67. [Google Scholar] [CrossRef]
- Li, X.; Ding, X.; Chu, B.; Zhou, Q.; Ding, G.; Gu, S. Genetic diversity analysis and conservation of the endangered Chinese endemic herb Dendrobium officinale Kimura et Migo (Orchidaceae) based on AFLP. Genetica 2008, 133, 159–166. [Google Scholar] [CrossRef]
- Tang, S.; Dai, W.; Li, M.; Zhang, Y.; Geng, Y.; Wang, L.; Zhong, Y. Genetic diversity of relictual and endangered plant Abies ziyuanensis (Pinaceae) revealed by AFLP and SSR markers. Genetica 2008, 133, 21–30. [Google Scholar] [CrossRef]
- Xiao, M.; Li, Q.; Guo, L.; Luo, T.; Duan, W.X.; He, W.X.; Wang, L.; Chen, F. AFLP analysis of genetic diversity of the endangered species Sinopodophyllum hexandrum in the Tibetan Region of Sichuan Province, China. Biochem. Genet. 2006, 44, 47–60. [Google Scholar] [CrossRef] [PubMed]
- Ahn, J.Y.; Lim, H.I.; Ha, H.W.; Han, J.; Han, S.H. Genetic variation in Korean fir subpopulations in Mt. Jiri for the restoration of genetic diversity. J. Korean For. Soc. 2017, 106, 417–423. [Google Scholar] [CrossRef]
- Broadhurst, L.; Boshier, D. Seed provenance for restoration and management: Conserving evolutionary potential and utility. In Genetic Considerations in Ecosystem Restoration Using Native Tree Species. A Thematic Study for the State of the World’s Forest Genetic Resources; United Nations Rome, Ed.; Food and Agriculture Organization: Rome, Italy, 2014; pp. 27–37. [Google Scholar]
- Gapare, W.J.; Yanchuk, A.D.; Aitken, S.N. Optimal sampling strategies for capture of genetic diversity differ between core and peripheral populations of Picea sitchensis (Bong.). Carr. Conserv. Genet. 2008, 9, 411–418. [Google Scholar] [CrossRef]
- Blanc-Jolivet, C.; Degen, B. Using simulations to optimize genetic diversity in Prunus avium seed harvests. Tree Genet. Genomes 2014, 10, 503–512. [Google Scholar] [CrossRef]
- Iwaizumi, M.G.; Nasu, J.; Miyamoto, N.; Isoda, K. Genetic variation of seed pools in two mast years and a genetic preservation strategy for a population of the endemic conifer Abies veitchii var. Shikokiana. J. Jpn. Soc. 2021, 103, 172–179. (In Japanese) [Google Scholar] [CrossRef]
- Chae, S.B.; Lim, H.I.; Kim, Y.Y. Selection of restoration material for Abies koreana based on its genetic diversity on Mt. Hallasan. Forests 2022, 13, 24. [Google Scholar] [CrossRef]
- Laikre, L.; Allendorf, F.W.; Aroner, L.C.; Baker, C.S.; Gregovich, D.P.; Hansen, M.M.; Jackson, J.A.; Kendall, K.C.; McKelvey, K.; Neel, M.C.; et al. Neglect of genetic diversity in the implementation of the Convention on Biological Diversity. Conserv. Biol. 2010, 24, 86–88. [Google Scholar] [CrossRef]
- FAO. Global Plan of Action for the Conservation, Sustainable Use and Development of Forest Genetic Resources; Food and Agriculture Organization of the United Nations: Rome, Italy, 2014; p. 31. [Google Scholar]
- McKay, J.K.; Christian, C.E.; Harrison, S.; Rice, K.J. “How local is local?”—A review of practical and conceptual issues in the genetics of restoration. Restor. Ecol. 2005, 13, 432–440. [Google Scholar] [CrossRef]
- Bischoff, A.; Steinger, T.; Müller-Schärer, H. Iimportance of plant provenance and genotypic diversity of seed materials used for ecological restoration. Restor. Ecol. 2008, 18, 338–348. [Google Scholar] [CrossRef]
- Cho, H.J.; Bae, K.H.; Lee, C.S.; Lee, C.H. Species composition and structure of the evergreen coniferous forest vegetation of the subalpine area (South Korea). J. Korean Soc. For. Sci. 2004, 93, 372–379. (In Korean) [Google Scholar]
- Lim, J.H.; Woo, S.Y.; Kwon, M.J.; Chun, J.H.; Shin, J.H. Photosynthetic capacity and water use efficiency under different temperature regimes on healthy and declining Korean fir in Mt. Halla. J. Korean Soc. For. Sci. 2006, 95, 705–710. (In Korean) [Google Scholar]
- Lim, J.H.; Kim, E.S.; Park, G.E.; Kim, Y.S.; Jang, G.C.; Han, J.K.; Jung, S.C.; Lim, H.I.; Song, W.K.; Cho, N.H.; et al. Current Status and Conservation Strategy of Vulnerable Conifer Species in Subalpine Zone in Korea; National Institute of Forest Science: Seoul, Republic of Korea, 2019; p. 194. (In Korean) [Google Scholar]
- Ceriani, R.M.; Pierce, S.; Cerabolini, B. The survival strategy of the alpine-endemic Primula glaucescens is fundamentally unchanged throughout its climate envelope, despite superficial phenotypic variability. Plant Ecol. 2009, 204, 1–10. [Google Scholar] [CrossRef]
- Byun, J.G.; Jang, J.W.; Yang, J.C.; Lee, Y.M.; Jung, S.Y.; Ji, S.J.; Jang, J.; Lee, H.J.; Hwang, H.S.; Oh, S.H. Flora of vascular plants in the Mt. Gariwang protected area for forest genetic resource conservation in South Korea. Korean J. Plant Resour. 2013, 26, 566–588. [Google Scholar] [CrossRef]
- Jeon, D.U.; Chon, J.H. System thinking in the resilience of the ecosystem and ecotourism of Mt. Gariwang based on the controversy around venue construction for the Pyeongchang 2018 Olympic. Korean Syst. Dyn. Rev. 2014, 15, 61–79. (In Korean) [Google Scholar]
- Lee, H.J.; Kim, Y.K.; Yoon, T.Y. Estimation of Environmental Costs for Deforestation: Focusing on the Case of Limestone Mine Development Projects. J. Environ. Policy Adm. 2022, 30, 63–91. [Google Scholar] [CrossRef]
- Chung, J.D.; Kim, J.H. A comparative study of greenhouse gas absorption in the forestry sector before and after the construction of golf courses. J. Korean Soc. Urban Environ. 2010, 10, 231–235. (In Korean) [Google Scholar]
- Kim, E.; Song, W.; Lee, D.K. Forest fragmentation and its impacts: A review. J. Korean Soc. Environ. Restor. Technol. 2012, 15, 149–162. [Google Scholar] [CrossRef]
- Sung, C.Y.; Cho, W. Landscape analysis of habitat fragmentation in the North and South Korean border. Korean J. Environ. Ecol. 2012, 26, 952–959. (In Korean) [Google Scholar]
- Choe, G. Status and Causes of Landslides in South Korea. Mag. Korean Soc. Hazard Mitig. 2001, 1, 7–14. (In Korean) [Google Scholar]
- Son, D.C.; Yang, J.C.; Cho, Y.C.; Choi, K.; Chang, K.S.; Oh, S.H. Silvics of Korea, 3rd ed.; Korea National Arboretum: Pocheon, Republic of Korea, 2019; pp. 31–37. (In Korean)
- Zhang, D.; Katsuki, T.; Rushforth, K. Abies nephrolepis. The IUCN Red List of Threatened Species 2013. e.T42292A76095986. Available online: https://doi.org/10.2305/IUCN.UK.2013-1.RLTS.T42292A76095986.en (accessed on 31 March 2023).
- Oh, B.U.; Jo, D.G.; Ko, S.C.; Choi, B.H.; Paik, W.K.; Chung, G.Y.; Jang, C.G. Target Plants Adaptable to Climate Change in the Korean Peninsula; Korea National Arboretum: Pocheon, Republic of Korea, 2010; Volume 300. (In Korean)
- Altukhov, Y.P.; Salmenkova, E.A. DNA polymorphism in population genetics. Russ. J. Genet. 2002, 38, 1173–1195. [Google Scholar] [CrossRef]
- Hong, Y.P.; Ahn, J.Y.; Kim, Y.M.; Yang, B.H.; Song, J.H. Genetic variation of nSSR markers in natural populations of Abies koreana and Abies nephrolepis in South Korea. J. Korean Soc. Forest Sci. 2011, 100, 577–584. (In Korean) [Google Scholar]
- Struss, D.; Plieske, J. The use of microsatellite markers for detection of genetic diversity in barley populations. Theor. Appl. Genet. 1998, 97, 308–315. [Google Scholar] [CrossRef]
- Hong, J.K.; Lim, J.; Lee, B.Y.; Kwak, M. Isolation and characterization of novel microsatellites for Abies koreana and A. nephrolepis (Pinaceae). Genet. Mol. Res. 2016, 15, gmr-15027542. [Google Scholar] [CrossRef] [PubMed]
- Lian, C.; Goto, S.; Hogetsu, T. Microsatellite markers for sacchalin fir (Abies sachalinensis Masters). Mol. Ecol. Notes 2007, 7, 896–898. [Google Scholar] [CrossRef]
- Hansen, O.K.; Vendramin, G.G.; Sebastiani, F.; Edwards, K.J. Development of Microsatellite Markers in Abies Nordmanniana (Stev.) Spach and cross-species amplification of the Abies genus. Mol. Ecol. Notes 2005, 5, 784–787. [Google Scholar] [CrossRef]
- Postolache, D.; Leonarduzzi, C.C.; Piotti, A.A.; Spanu, I.; Roig, A.; Fady, B.; Roschanski, A.; Liepelt, S.; Vendramin, G.G. Transcriptome versus Genomic Microsatellite Markers: Highly Informative Multiplexes for Genotyping Abies alba Mill. and Congeneric Species. Plant Mol. Biol. Report. 2014, 32, 750–760. [Google Scholar] [CrossRef]
- Van Oosterhout, C.; Hutchinson, W.F.; Wills, D.P.M.; Shipley, P. MICRO-CHECKER: Software for identifying and correcting genotyping errors in microsatellite data. Mol. Ecol. Notes 2004, 4, 535–538. [Google Scholar] [CrossRef]
- Peakall, R.O.D.; Smouse, P.E. GenAlEx 6: Genetic analysis in Excel. Population Genetics Software for Teaching and Research. Mol. Ecol. Notes 2006, 6, 288–295. [Google Scholar] [CrossRef]
- Takezaki, N.; Nei, M.; Tamura, K. POPTREE2: Software for constructing population trees from allele frequency data and computing other population statistics using a Windows interface. Mol. Biol. Evol. 2010, 27, 747–752. [Google Scholar] [CrossRef]
- Li, Y.L.; Liu, J.X. Structure selector: A web-based software to select and visualize the optimal number of clusters using multiple methods. Mol. Ecol. Resour. 2018, 18, 176–177. [Google Scholar] [CrossRef] [PubMed]
- Evanno, G.; Regnaut, S.; Goudet, J. Detecting the number of clusters of individuals using the software STRUCTURE: A simulation study. Mol. Ecol. 2005, 14, 2611–2620. [Google Scholar] [CrossRef] [PubMed]
- Pritchard, J.K.; Stephens, M.; Donnelly, P. Inference of population structure using multi-locus genotype data. Genetics 2000, 155, 945–959. [Google Scholar] [CrossRef]
- Smouse, P.E.; Peakall, R.O.D. Spatial autocorrelation analysis of individual multi-allele and multi-locus genetic structures. Heredity 1999, 82, 561–573. [Google Scholar] [CrossRef]
- De Mendiburu, F.; de Mendiburu, M.F. Package “Agricolae”; R Package Version 1,2019, 2–8. Available online: https://cran.r-project.org/web/packages/agricolae/agricolae.pdf (accessed on 2 May 2023).
- Kwak, M.; Hong, J.K.; Park, J.H.; Lee, B.Y.; Suh, M.H.; Kim, C.S. Genetic assessment of Abies koreana (Pinaceae), the endangered Korean fir, and conservation implications. Conserv. Genet. 2017, 18, 1165–1176. [Google Scholar] [CrossRef]
- Iwaizumi, M.G.; Ohtani, M.; Nasu, J.Y.; Takahashi, M. Development of highly polymorphic genomic microsatellite markers and their application to gene flow in a natural population of Abies firma. J. For. Res. 2019, 24, 330–334. [Google Scholar] [CrossRef]
- Belletti, P.; Ferrazzini, D.; Ducci, F.; De Rogatis, A.A.; Mucciarelli, M. Genetic diversity of Italian populations of Abies alba. Dendrobiology 2017, 77, 147–159. [Google Scholar] [CrossRef]
- Sękiewicz, K.; Dering, M.; Sękiewicz, M.; Boratyńska, K.; Iszkuło, G.; Litkowiec, M.; Ok, T.; Dagher-Kharrat, M.B.; Boratyński, A. Effect of geographic range discontinuity on species diferentiation—East-Mediterranean Abies cilicica: A case study. Tree Genet. Genomes 2015, 11, 810. [Google Scholar] [CrossRef]
- Cobo-Simón, I.; Méndez-Cea, B.; Jump, A.S.; Seco, J.; Gallego, F.J.; Linares, J.C. Understanding the Genetic Diversity of Relict Forests. Linking long-term isolation legacies and current habitat fragmentation in the Abies pinsapo boiss. For. Ecol. Manag. 2020, 461, 117947. [Google Scholar] [CrossRef]
- Potter, K.M.; Frampton, J.; Josserand, S.A.; Nelson, C.D. Genetic variation and population structure in Fraser fir (Abies fraseri): A microsatellite assessment of young trees. Can. J. For. Res. 2008, 38, 2128–2137. [Google Scholar] [CrossRef]
- Maghuly, F.; Pinsker, W.; Praznik, W.; Fluch, S. Genetic diversity in managed subpopulations of Norway spruce [Picea abies (L.) Karst.]. For. Ecol. Manag. 2006, 222, 266–271. [Google Scholar] [CrossRef]
- Pazouki, L.; Shanjani, P.S.; Fields, P.D.; Martins, K.; Suhhorutšenko, M.; Viinalass, H.; Niinemets, Ü. Large within-population genetic diversity of the widespread conifer Pinus sylvestris at its soil fertility limit, characterized by nuclear and chloroplast microsatellite markers. Eur. J. For. Res. 2016, 135, 161–177. [Google Scholar] [CrossRef]
- Qiu, Y.; Liu, Y.; Kang, M.; Yi, G.; Huang, H. Spatial and temporal population genetic variation and structure of Nothotsuga longibracteata (Pinaceae), a relic conifer species endemic to subtropical China. Genet. Mol. Biol. 2013, 36, 598–607. [Google Scholar] [CrossRef]
- Aleksić, J.M.; Piotti, A.; Geburek, T.; Vendramin, G.G. Exploring and conserving a “microcosm”: Whole-population genetic characterization within a refugial area of the endemic, relict conifer Picea omorika. Conserv. Genet. 2017, 18, 777–788. [Google Scholar] [CrossRef]
- Tong, Y.W.; Lewis, B.J.; Zhou, W.M.; Mao, C.R.; Wang, Y.; Zhou, L.; Yu, D.P.; Dai, L.M.; Qi, L. Genetic diversity and population structure of natural Pinus koraiensis populations. Forests 2019, 11, 39. [Google Scholar] [CrossRef]
- Moriguchi, Y.; Kang, K.S.; Lee, K.Y.; Lee, S.W.; Kim, Y.Y. Genetic variation of Picea jezoensis populations in South Korea revealed using chloroplast, mitochondrial, and nuclear DNA markers. J. Plant Res. 2009, 122, 153–160. [Google Scholar] [CrossRef]
- Hamrick, J.L.; Godt, M.W. Effects of life history traits on genetic diversity in plant species. Phil. Trans. R. Soc. Lond. B Biol. Sci. 1996, 351, 1291–1298. [Google Scholar] [CrossRef]
- Kim, M.; Lee, S.; Lee, S.; Yi, K.; Kim, H.S.; Chung, S.; Chung, J.; Kim, H.S.; Yoon, T.K. Seed dispersal models for natural regeneration: A review and prospects. Forests 2022, 13, 659. [Google Scholar] [CrossRef]
- Song, Z.; Li, X.; Wang, H.; Wang, J. Genetic diversity and population structure of Salvia miltiorrhiza Bge. in China revealed by ISSR and SRAP. Genetica 2010, 138, 241–249. [Google Scholar] [CrossRef] [PubMed]
- Hamrick, J.L.; Godt, M.J.W.; Sherman-Broyles, S.L. Factors influencing levels of genetic diversity in woody plant species. In Population Genetics of Forest Trees: Proceedings of the International Symposium on Population Genetics of Forest Trees, Corvallis, OR, USA, 31 July–2 August 1990; Springer: Dordrecht, The Netherlands, 1992; pp. 95–124. [Google Scholar]
- Nybom, H. Comparison of different nuclear DNA markers for estimating intraspecific genetic diversity in plants. Mol. Ecol. 2004, 13, 1143–1155. [Google Scholar] [CrossRef] [PubMed]
- Hong, Y.P.; Kwon, H.Y.; Kim, I.S. The I-SSR markers revealed inconsistent phylogeographic patterns among Japanese red pine populations in Korea. Silvae Genet. 2007, 56, 22–26. [Google Scholar] [CrossRef]
- Doligez, A.; Joly, H.I. Genetic diversity and spatial structure within a natural stand of a tropical forest tree species, Carapa procera (Meliaceae) in French Guiana. Heredity 1997, 79, 72–82. [Google Scholar] [CrossRef]
- Hamrick, J.L.; Murawski, D.A.; Nason, J.D. The Influences of Seed Dispersal Mechanisms on the Genetic Structure of tropical tree populations. Vegetatio 1993, 107, 281–297. [Google Scholar] [CrossRef]
- Thomson, F.J.; Moles, A.T.; Auld, T.D.; Kingsford, R.T. Seed dispersal distance is more strongly correlated with plant height than with seed mass. J. Ecol. 2011, 99, 1299–1307. [Google Scholar] [CrossRef]
Figure 1.
Locations at which ten Abies nephrolepis populations were sampled in Republic of Korea. 1: Mt. Gariwangsan; 2: Mt. Joongwangsan; 3: Mt. Seoraksan; 4: Mt. Taebaeksan; 5: Mt. Odeasan; 6: Mt. Hwaaksan; 7: Mt. Sobaeksan; 8: Mt. Jangsan; 9: Mt. Balwangsan; 10: Mt. Bangtaesan.
Figure 1.
Locations at which ten Abies nephrolepis populations were sampled in Republic of Korea. 1: Mt. Gariwangsan; 2: Mt. Joongwangsan; 3: Mt. Seoraksan; 4: Mt. Taebaeksan; 5: Mt. Odeasan; 6: Mt. Hwaaksan; 7: Mt. Sobaeksan; 8: Mt. Jangsan; 9: Mt. Balwangsan; 10: Mt. Bangtaesan.

Figure 2.
Locations at which 99 Abies nephrolepis were sampled in the study site on Mt. Gariwangsan.
Figure 2.
Locations at which 99 Abies nephrolepis were sampled in the study site on Mt. Gariwangsan.

Figure 3.
Principal coordinate analysis (PCoA) of the genetic distances among ten Abies nephrolepis populations. Detailed information on each populations is presented in Table 1.
Figure 3.
Principal coordinate analysis (PCoA) of the genetic distances among ten Abies nephrolepis populations. Detailed information on each populations is presented in Table 1.

Figure 7.
Spatial autocorrelation analysis of Abies nephrolepis populations on Mt. Gariwangsan. The solid line represents the value of r, which is the autocorrelation coefficient. The dotted lines represent 95% confidence intervals.
Figure 7.
Spatial autocorrelation analysis of Abies nephrolepis populations on Mt. Gariwangsan. The solid line represents the value of r, which is the autocorrelation coefficient. The dotted lines represent 95% confidence intervals.


Table 1.
Sampling information of ten Abies nephrolepis populations in Republic of Korea.
| No. | Populations | Abbreviation | Latitude (°) | Longitude (°) | Altitude (m) | Number of Samples | Height (m) | DBH (cm) |
|---|---|---|---|---|---|---|---|---|
| 1 | Mt. Gariwangsan | GW | 37.46111 | 128.56313 | 1423 | 35 | 5.2 1 | 12.7 1 |
| 2 | Mt. Joongwangsan | JW | 37.46390 | 128.52214 | 1252 | 30 | 9.5 | 18.8 |
| 3 | Mt. Seoraksan | SA | 38.11941 | 128.46472 | 1550 | 34 | 10.8 | 18.6 |
| 4 | Mt. Taebaeksan | TB | 37.09839 | 128.91628 | 1375 | 36 | 10.6 | 22.0 |
| 5 | Mt. Odeasan | OD | 37.79536 | 128.54371 | 1276 | 36 | 12.0 | 18.9 |
| 6 | Mt. Hwaaksan | HA | 37.99501 | 127.50381 | 1350 | 31 | 8.8 | 20.8 |
| 7 | Mt. Sobaeksan | SB | 36.95816 | 128.48391 | 1320 | 18 | 7.6 | 19.9 |
| 8 | Mt. Jangsan | JA | 37.12484 | 128.86293 | 1350 | 36 | 14.3 | 25.4 |
| 9 | Mt. Balwangsan | BW | 37.60722 | 128.67102 | 1435 | 36 | 9.3 | 17.7 |
| 10 | Mt. Bangtaesan | BT | 37.89494 | 128.35559 | 1293 | 34 | 5.1 | 11.2 |
1 Mean. DBH: diameter at breast height.
Table 2.
Description of seven microsatellite markers used in the study, with primer labeling using JOE or FAM fluorescent dyes.
Table 2.
Description of seven microsatellite markers used in the study, with primer labeling using JOE or FAM fluorescent dyes.
| Primer | Dye | DNA Sequences (5′ → 3′) | Repeat Motif | Product Size | Tm (°C) | Reference | |
|---|---|---|---|---|---|---|---|
| Aat04 | JOE | F R | CCATGTATGGTGCTCCTCCT CCTTCATTGCAGAAAAGCAA | (CAG)11 | 158–191 | 63 (touchdown) | [38] |
| NFF07 | FAM | F R | CCCAAACTGGAAGATTGGAC ATCGCCATCCATCATCAGA | (GA)33 | 107–173 | 58 | [37] |
| As13 | FAM | F R | ATGCAAGCAACCATCGATATG GTTTCTTCCATAGAACACCTC | (TG)22 | 220–262 | 55 | [36] |
| As20 | FAM | F R | TCTTGCAACGAGGGGATCCATAACCTG CTAAGCATTGAGCCACATAATTC | (TG)9 | 172–226 | 55 | [36] |
| AK087 | FAM | F R | GCAGCCTTATCTTCATTTTGTC CACTTGAGCCACACTTGAACTA | (TG)15 | 263–294 | 58 | [35] |
| AK240 | FAM | F R | AGAGAAGGGTCGAGGAATTATC TGAAAGTAGCAAGTGTAACTTATGC | (CA)12 | 177–212 | 58 | [35] |
| AK246 | FAM | F R | TAGATTGGCATATTGGACATCA ATAGGTTGTTGAGCTGGATGTT | (TG)11 | 135–155 | 58 | [35] |
Table 3.
Genetic diversity of ten Abies nephrolepis populations.
| Populations | N | A | Ae | Ho | He | F |
|---|---|---|---|---|---|---|
| GW | 35.0 | 11.4 | 6.726 | 0.792 | 0.786 | −0.008 |
| JW | 30.0 | 7.9 | 4.417 | 0.671 | 0.725 | 0.069 |
| SA | 33.7 | 10.6 | 5.980 | 0.768 | 0.780 | 0.021 |
| TB | 36.0 | 10.9 | 6.321 | 0.813 | 0.808 | −0.009 |
| OD | 35.9 | 13.4 | 6.672 | 0.817 | 0.802 | −0.022 |
| HA | 30.6 | 10.4 | 5.987 | 0.794 | 0.777 | −0.014 |
| SB | 18.0 | 10.6 | 6.673 | 0.865 | 0.812 | −0.061 |
| JA | 35.9 | 12.1 | 7.055 | 0.824 | 0.823 | −0.005 |
| BW | 35.4 | 12.4 | 6.325 | 0.780 | 0.789 | 0.016 |
| BT | 34.0 | 11.4 | 6.438 | 0.815 | 0.805 | −0.013 |
| Total | 1 32.4 ± 0.63 | 11.1 ± 0.50 | 6.259 ± 0.394 | 0.794 ± 0.016 | 0.791 ± 0.013 | −0.002 ± 0.010 |
1 Mean ± SE. N: number of samples; A: number of alleles; Ae: number of effective alleles; Ho: observed heterozygosity; He: expected heterozygosity; F: fixation index. Detailed information on each populations is presented in Table 1.
Table 4.
Molecular variance analysis (AMOVA) evaluating the genetic differentiation of ten Abies nephrolepis populations.
Table 4.
Molecular variance analysis (AMOVA) evaluating the genetic differentiation of ten Abies nephrolepis populations.
| Degrees of Freedom | Sum of Squares | Mean Squares | Estimated Variation | Percent of Variation (%) | p | |
|---|---|---|---|---|---|---|
| Among populations | 9 | 110.64 | 12.294 | 0.203 | 3 | 0.001 |
| Within populations | 316 | 1802.39 | 5.704 | 5.704 | 97 | |
| Total | 325 | 1913.03 | 5.906 | 100 |
Table 5.
Comparison of the genetic diversity of alleles with frequencies greater than 0.05 in the Abies nephrolepis population on Mt. Gariwangsan according to the sample size extracted.
Table 5.
Comparison of the genetic diversity of alleles with frequencies greater than 0.05 in the Abies nephrolepis population on Mt. Gariwangsan according to the sample size extracted.
| No. of Samples | Mean ± SD |
|---|---|
| 5 | 65.52 ± 9.82 c |
| 10 | 84.51 ± 6.79 b |
| 15 | 94.45 ± 3.89 a |
| 20 | 97.38 ± 1.86 a |
| 25 | 99.27 ± 1.01 a |
| 30 | 99.64 ± 0.94 a |
| 35 | 99.87 ± 0.34 a |
Different letters mean significantly different according to Duncan’s test at p ≤ 0.05.
Disclaimer/Publisher’s Note: The statements, opinions and data contained in all publications are solely those of the individual author(s) and contributor(s) and not of MDPI and/or the editor(s). MDPI and/or the editor(s) disclaim responsibility for any injury to people or property resulting from any ideas, methods, instructions or products referred to in the content. |
© 2023 by the authors. Licensee MDPI, Basel, Switzerland. This article is an open access article distributed under the terms and conditions of the Creative Commons Attribution (CC BY) license (https://creativecommons.org/licenses/by/4.0/).
Share and Cite
MDPI and ACS Style
Seo, H.-N.; Park, J.-H.; Lim, H.-I. Selection of Abies nephrolepis Materials for Restoration of Genetic Diversity in Mt. Gariwangsan Degraded Area. Sustainability 2023, 15, 7749. https://doi.org/10.3390/su15107749
AMA Style
Seo H-N, Park J-H, Lim H-I. Selection of Abies nephrolepis Materials for Restoration of Genetic Diversity in Mt. Gariwangsan Degraded Area. Sustainability. 2023; 15(10):7749. https://doi.org/10.3390/su15107749
Chicago/Turabian StyleSeo, Han-Na, Jae-Hyun Park, and Hyo-In Lim. 2023. "Selection of Abies nephrolepis Materials for Restoration of Genetic Diversity in Mt. Gariwangsan Degraded Area" Sustainability 15, no. 10: 7749. https://doi.org/10.3390/su15107749
Note that from the first issue of 2016, this journal uses article numbers instead of page numbers. See further details here.