Article

Comparative Chloroplast Genome Analyses of Six Hemlock Trees in East Asia: Insights into Their Genomic Characterization and Phylogenetic Relationship

1
Co-Innovation Center for the Sustainable Forestry in Southern China, Nanjing Forestry University, Nanjing 210037, China
2
College of Life Sciences, Nanjing Forestry University, Nanjing 210037, China
3
Tropical Biodiversity and Bioresource Utilization Laboratory, Qiongtai Normal University, Haikou 571127, China
*
Authors to whom correspondence should be addressed.
These authors contributed equally to this work.
Forests 2023, 14(11), 2136; https://doi.org/10.3390/f14112136
Submission received: 16 September 2023 / Revised: 24 October 2023 / Accepted: 25 October 2023 / Published: 26 October 2023

Abstract

:
Hemlocks (Pinaceae: Tsuga) are widely distributed in North America and East Asia, forming a reticulate evolutionary structure in East Asia with significant ecological importance. To clarify the chloroplast genome characteristics and phylogenetic relationships among Tsuga species, we analyzed the chloroplast genomes of T. chinensis var. tchekiangensis, T. chinensis, T. diversifolia, T. dumosa, T. forrestii, and T. sieboldii, performing associated phylogenetic analyses. The results reveal that the chloroplast genome lengths among the six Tsuga species vary from 120,520 to 121,010 bp, encompassing about 108 to 112 genes, including 35/32 tRNA genes and 4 rRNA genes. A codon usage analysis highlighted a preference for A/U-ending codons, and all six nucleotide types have A/T bases and a prevalence of mononucleotides. Notably, all Tsuga species exhibit inverted repeat (IR) contractions and possess unique hexanucleotides absent in the other species of Pinaceae, potentially making them more susceptible to gene recombination or rearrangement during evolution. While most variations are observed in non-coding regions, particularly in intergenic fragments, substantial variation sites are also present within the genes. The phylogenetic tree, constructed using chloroplast genomes, substantiates the sister taxa relationship between Tsuga and Nothotsuga. Furthermore, it confirms that T. chinensis var. tchekiangensis exhibits a closer relationship with T. forrestii than with T. chinensis. These findings not only provide partial evidence that T. chinensis may not constitute a monophyletic species but also underscore the necessity of reevaluating the taxonomic status of T. chinensis var. tchekiangensis. In addition, while the RSCU cluster analysis is basically consistent with the phylogenetic analysis, it also highlights a distinct differentiation between Nothotsuga and Tsuga. This study not only provides molecular-level phylogenetic classification evidence of Pinaceous genera via chloroplast genome analyses but also offers compelling evidence for further exploring the relationships and species delimitation among the hemlocks of East Asia.

1. Introduction

Hemlocks, a group of evergreen coniferous trees belonging to Tsuga of Pinaceae, play a crucial role in subalpine and lowland forests in both East Asia and North America [1]. Tsuga is a genus with a typical disjunctive distribution, with six species distributed in East Asia and four in North America [1]. There are many controversies about the origin and spread of this genus. Fossil and pollen records of Tsuga suggest an approximate origin in Western Europe during the Late Cretaceous, with subsequent expansions to China and North America through Eurasia and the North Atlantic Bridge, respectively [2]. In contrast, molecular data indicate a late-Oligocene origin in North America with a subsequent spread to East Asia via the Beringian Corridor during the mid-Miocene [3]. As a monophyletic genus, a division of the species of Tsuga into two sections has been commonplace, but interspecific relationships and taxonomic treatments were not consistent in different research studies, especially with respect to the delimitation of species in East Asia [4]. Farjon’s taxonomic system is the most widely recognized system for Tsuga in the past decade and has two sections, with T. mertensiana in Sect. Hesperopeuce and others in Sect. Tsuga; a further division of the genus would, in his opinion, rest on a too-narrow basis and is unlikely to be corroborated via a phylogenetic analysis [5]. However, this unnatural division was not consistent with the division based on molecular phylogeny, which grouped T. heterophylla and T. mertensiana into the western North American clade, while the others were grouped into the Asian clade [1,6]. In addition, considering the introgression and difficulty delimiting in eastern Asian hemlocks [4], it can be seen that the determination of the intraspecific and interspecific relationships of Tsuga still needs more molecular evidence and further exploration.
In East Asia, hemlocks display a complex reticulate evolutionary pattern, and the Chinese hemlock (T. chinensis) has been validated as a species complex [3]. Extensive genetic exchanges have led to significant variations in the relationships between different geographical populations within T. chinensis and between T. chinensis and other Tsuga species [3,7]. Endemic to China, Chinese hemlock ranges broadly from the eastern Hengduan Mountains eastward to the Huang/Tianmu and Yandang/Wuyi Mountains [7], displaying important ecological significance. The southern Chinese hemlock (T. chinensis var. tchekiangensis), a rare and endangered hemlock now incorporated into T. chinensis, is an endemic coniferous species distributed in mountain forests across central subtropical to northern tropical regions in southern China [8,9]. As ecologically significant forest trees in the middle- and high-altitude evergreen forests of subtropical mountains in China, these hemlocks raise concerns regarding conservation due to threats posed by environmental degradation and excessive anthropogenic disturbance [10]. The phylogeny and historical biogeography of Tsuga were studied preliminary using nuclear and chloroplast fragments [6,7], but more molecular-level investigations are needed to better understand the evolution and phylogeny of Tsuga [11], especially the T. chinensis species complex.
Chloroplast DNA (cpDNA) is typically a double-stranded circular molecule with a tetrameric structure that is highly conserved. This structure includes a large single-copy region (LSC), a small single-copy region (SSC), and two inverted repeat regions (IRa and IRb) [12]. In Pinaceae, a previous study suggested that chloroplasts, mitochondria, and nuclear genomes are primarily inherited though paternal, maternal, and biparental modes, respectively [13]. However, recent research revealed the presence of biparental inheritance in the chloroplast genomes of Pinaceae plants [14]. The chloroplast genome, in contrast to the mitochondrial and nuclear genomes, exhibits a high degree of structural and coding conservation, is minimally impacted by genetic recombination, and undergoes moderate evolutionary change [15]. The advent of molecular biology and second-generation high-throughput sequencing technologies has led to the widespread utilization of chloroplast genomes in plant phylogenetics, phylogeography, population genetics, and related fields. Several specialists and academics have already employed the chloroplast genome to resolve phylogenetic problems in angiosperms, while less research has been undertaken for gymnosperms, including Tsuga.
In this study, the cp genomes of six Tsuga species in East Asia, i.e., T. chinensis var. tchekiangensis, T. chinensis, T. diversifolia, T. dumosa, T. forrietii, and T. sieboldii, were compared. The objectives of this study were to (1) characterize the structures of the six chloroplast genomes of Tsuga, (2) conduct a comparative analysis of the cp genomes among Tsuga species, and (3) explore the phylogenetic relationships within Tsuga and among related genera. The results of this study will enrich the genetic information database of East Asian hemlock species and provide more basic data for future genomics research and hemlock conservation.

2. Materials and Methods

2.1. Sampling, DNA Extraction and Sequencing

Fresh leaves of Tsuga chinensis var. tchekiangensis were collected from a single individual in Guangdong Nanling National Nature Reserve (113°1′10″ E, 24°53′49″ N). Total genomic DNA was extracted using the DNeasy Plant Mini Kit (Qiagen, Valencia, CA, USA). After quality testing and purification, the fragmented DNA was subjected to library preparation, and the qualified library was sequenced using the Hiseq4000 Sequencing System (Illumina, San Diego, CA, USA) via 150 bp paired-end reads at Nanjing Genepioneer Biotechnologies Inc. (Nanjing, China). The voucher specimen was deposited at the Herbarium of Nanjing Forestry University (NF) with the accession number NF20190176.
In addition, a total of 22 complete chloroplast genomes available in the NCBI GenBank were downloaded with annotations (Supplementary Table S1) for the subsequent analyses, including five Tsuga species: T. chinensis, T. diversifolia, T. dumosa, T. forrestii, and T. sieboldii. Notably, the cp genome of Nothotsuga longibracteata, which was initially classified as a Tsuga species, was acquired in our previous study [16].

2.2. Genome Assembly, Annotation, and Sequence Analyses

Raw reads were trimmed using CLC Genomics Workbench v9 (CLC Bio, Aarhus, Denmark), using the default parameters. The resultant clean reads were then employed to assemble the chloroplast genome using the program NOVOPlasty [17], using the chloroplast genome of its congener, T. chinensis (LC095866.1), as a reference. The resultant genome was annotated using CpGAVAS [18], and the circular chloroplast genome map was visualized using OGDRAW [19]. The annotated sequence was submitted to GenBank (accession number MT041770).
All the maintained sequences were aligned using MAFFT v.7.520 [20], and the cp genomes of the Tsuga species and N. longibracteata were selected for genome comparison and a sequence divergence analysis. The boundaries of the IR regions were detected using Repeat Finder [21], implemented in Geneious 9.0.2 [22], and visualized using the JSHYCloud platform (http://cloud.genepioneer.com:9929, accessed on 18 May 2023).

2.3. Genome Comparison and Polymorphic Region Identification

The software CodonW v.1.4.2. [23] was used to estimate the codon usage patterns of protein-coding genes based on relative synonymous codon usage (RSCU) values and the effective number of codons (ENCs). The software EMBOSS (https://www.bioinformatics.nl/emboss-explorer/, accessed on 27 May 2023) was used to calculate the overall GC content and the GC content at the first, second, and third codon positions (GC1, GC2, and GC3, respectively), as well as the average GC content of the first and second codon positions (GC12). The neutral (GC12 vs. GC3) and ENC (ENC vs. GC3s) maps were plotted using ggplot2 in R 4.0.1 [24].
The identification of polymorphic regions of significant variation in the sequences of Tsuga and N. longibracteata was performed using the Shuffle-LAGAN model [25] from the mVISTA website (https://genome.lbl.gov/cgi-bin/VistaInput?num_seqs=4, accessed on 10 June 2023) [26]. To identify highly variable loci, nucleotide diversity (Pi) was analyzed using DnaSP v6.12.03, setting a window length of 600 bp’s and a step size of 200 bp’s [27].
Additionally, the numbers and distributions of SSRs were detected using the MISA online website (https://webblast.ipk-gatersleben.de/misa/index.php?action=1, accessed on 18 June 2023) [28,29], with repeat units of mono-, di-, tri-, tetra-, penta- and hexa-nucleotides, each specified with 10, 5, 4, 3, 3, and 3 replicates, respectively.

2.4. Phylogenetic Analysis

To further infer the phylogenetic relationships among the genera of Pinaceae, 23 representative species of 11 genera were selected to construct the phylogenetic trees based on the RSCU values and complete cp genomes, respectively. A clustering analysis based on the RSCU values of 59 codons, excluding AUG, UGG, UAA, UAG, and UGA, was performed in SPSS 22.0 [30], using the Euclidean distance method [31].
The complete chloroplast genomes were used to construct a Maximum Likelihood (ML) tree in MEGA X with 1000 bootstrap replications [32]. The general-time nucleotide substitution reversible model (GTR + G + I) was applied, and gaps/missing data were treated using complete deletion. Additionally, a Bayesian Inference (BI) tree was also generated under the GTR + G model using MrBayes v.3.2.7 [33]. This involved 10,000,000 generations, with samples collected every 1000 generations via the Markov chain (MCMC) algorithm. To ensure robust results, 25% of the trees were discarded as burn-in samples, and the remaining samples were used to generate consistent trees. All phylogenetic trees were refined using the tv(BOT) online web tool (https://www.chiplot.online/tvbot.html, accessed on 27 June 2023) [34].

3. Results

3.1. Genome Structure and Characteristics

The complete chloroplast genome characteristics of Tsuga chinensis var. tchekiangensis (GeneBank accession No. MT041770) were basically consistent with the relative species in Tsuga (Figure 1 and Table 1). The total genome length of Tsuga chinensis var. tchekiangensis was 120,817 bp’s in size compared with the range of 120,520 to 121,010 bp’s in all the Tsuga species. The lengths of the LSC, SSC and IR were intermediate within the ranges of 64,843–65,219 bp’s, 52,002–59,246 bp’s, and 334–418 bp’s, respectively.
Each of the genomes encoded approximately 111 unique genes, including 72 protein-coding genes (PCGs), 35 tRNA genes (tRNAs), and four rRNA genes (rRNAs). Notably, the ycf68 gene was unique to T. chinensis, while the trnG-UCC gene and two trnT-GGU genes were absent in T. dumosa and T. forrestii. In total, there were two PCGs (ycf3 and rps12) containing two introns, while six PCGs (atpF, petB, petD, rpl16, rpl2, and rpoC1) and six tRNAs (trnA-UGC, trnG-UCC, trnI-GAU, trnK-UUU, trnL-UAA, and trnV-UAC) contained one intron. Most of the genes occurred as a single copy; however only four tRNAs (trnH-GUG, trnI-CAU, trnS-GCU, and trnT-GGU) and ycf12 are totally duplicated (Supplementary Table S2). The total GC content was 38.1% across all the species except for T. dumosa (38.2%), and the corresponding values in the LSC, SSC and IR regions varied from 37.4% to 37.5%, from 38.9% to 39.1%, and from 35.9% to 37.5%, respectively.

3.2. Codon Usage Bias Analysis

A total of 59 synonymous codons excepting UGG, AUG, UAA, UAG, and UGA were analyzed for codon bias. All 18 amino acids, excluding methionine (Met) and tryptophan (Trp), were encoded with two or more codons (Figure 2A). Among them, arginine (Arg), leucine (Leu), and serine (Ser) were encoded by six codons. Leucine (Leu), with 9.8% of total codons, was the most common amino acid, whereas cysteine (Cys) was the least common amino acid (1.1%). There were thirty-two high-frequency codons (RSCU > 1), which ended with A/U, including eight codons with an RSCU > 1.6 (AGA, GCU, UUA, UCU, GAU, ACU, GGA, and CCU) (Figure 2B, Supplementary Table S3).
The correlation coefficients between GC3 and GC12 of the six Tsuga species were 0.1990, 0.1900, 0.1775, 0.1926, 0.2131, and 0.2015, while the regression coefficients were 0.2139, 0.2029, 0.1683, 0.1835, 0.2201, and 0.2122, respectively (Figure 3). There was a weak correlation between GC12 and GC3, and the first two bases of the codon were significantly different from the third base. Furthermore, the small slope observed in the neutrality plot indicated a low proportion of mutation pressure in each species, implying that the preference for codon usage in Tsuga is primarily determined by natural selection [36].
The ENC values ranged from 38.35 to 59.98 (Supplementary Table S4), indicating that codon bias was not universally high across all species. Notably, T. diversifolia exhibited the highest ENC value, while T. dumosa displayed the lowest. It is worth mentioning that the petD and rps12 genes had ENC values of less than 40, indicating a low codon usage bias. Overall, the ENC values did not exhibit a substantial variation, and there were no significant disparities in the ENC values of individual genes between the two species. Although some of the genes in the ENC-GC3s plots (Figure 4) were situated along the standard curve, others were dispersed on both sides, implying the presence of notable deviations in certain codons.
Based on the ratio of the ENC values to the ENC expectation values across the six species, it was determined that the ratios of the exhibited genes ranging from 0.05 to 0.15 accounted for the same proportion of 47.73% except for T. diversifolia, with 46.52% (Table 2), which suggests that mutation pressure significantly impacted these genes. Nevertheless, about half of the genes were situated outside this interval, and the rest were more influenced by natural selection. In summary, both natural selection and mutation pressure impacted the codon usage preference of Tsuga’s chloroplast genome, with natural selection playing a major role.

3.3. SSR Analysis

A total of 277 SSRs with six types were identified from the chloroplast genomes of each species (Figure 5, Supplementary Table S5). The number of SSRs ranged from 39 to 50 in each Tsuga species. Among all the SSRs identified, mononucleotide repeats were the most common SSRs (18–24, with average proportion of 46.57%), followed by dinucleotide (19.49%), tetranucleotide (15.52%), and trinucleotide (10.47%) repeats, while pentanucleotide and hexanucleotide repeats occurred with a lower frequency of 3.97%. The SSRs of the species were exclusively found in the LSC and SSC regions, with the LSC region having the most SSRs (25–31, accounting for 60.65%), followed by the SSC region (14–20, accounting for 39.35%). Moreover, the SSRs identified across all species were predominately composed of A and T, indicating a notable bias towards these bases. Mononucleotide repeats constating solely of A or T accounted for 86.82%, while the most prevalent dinucleotide repeats were AT or TA.

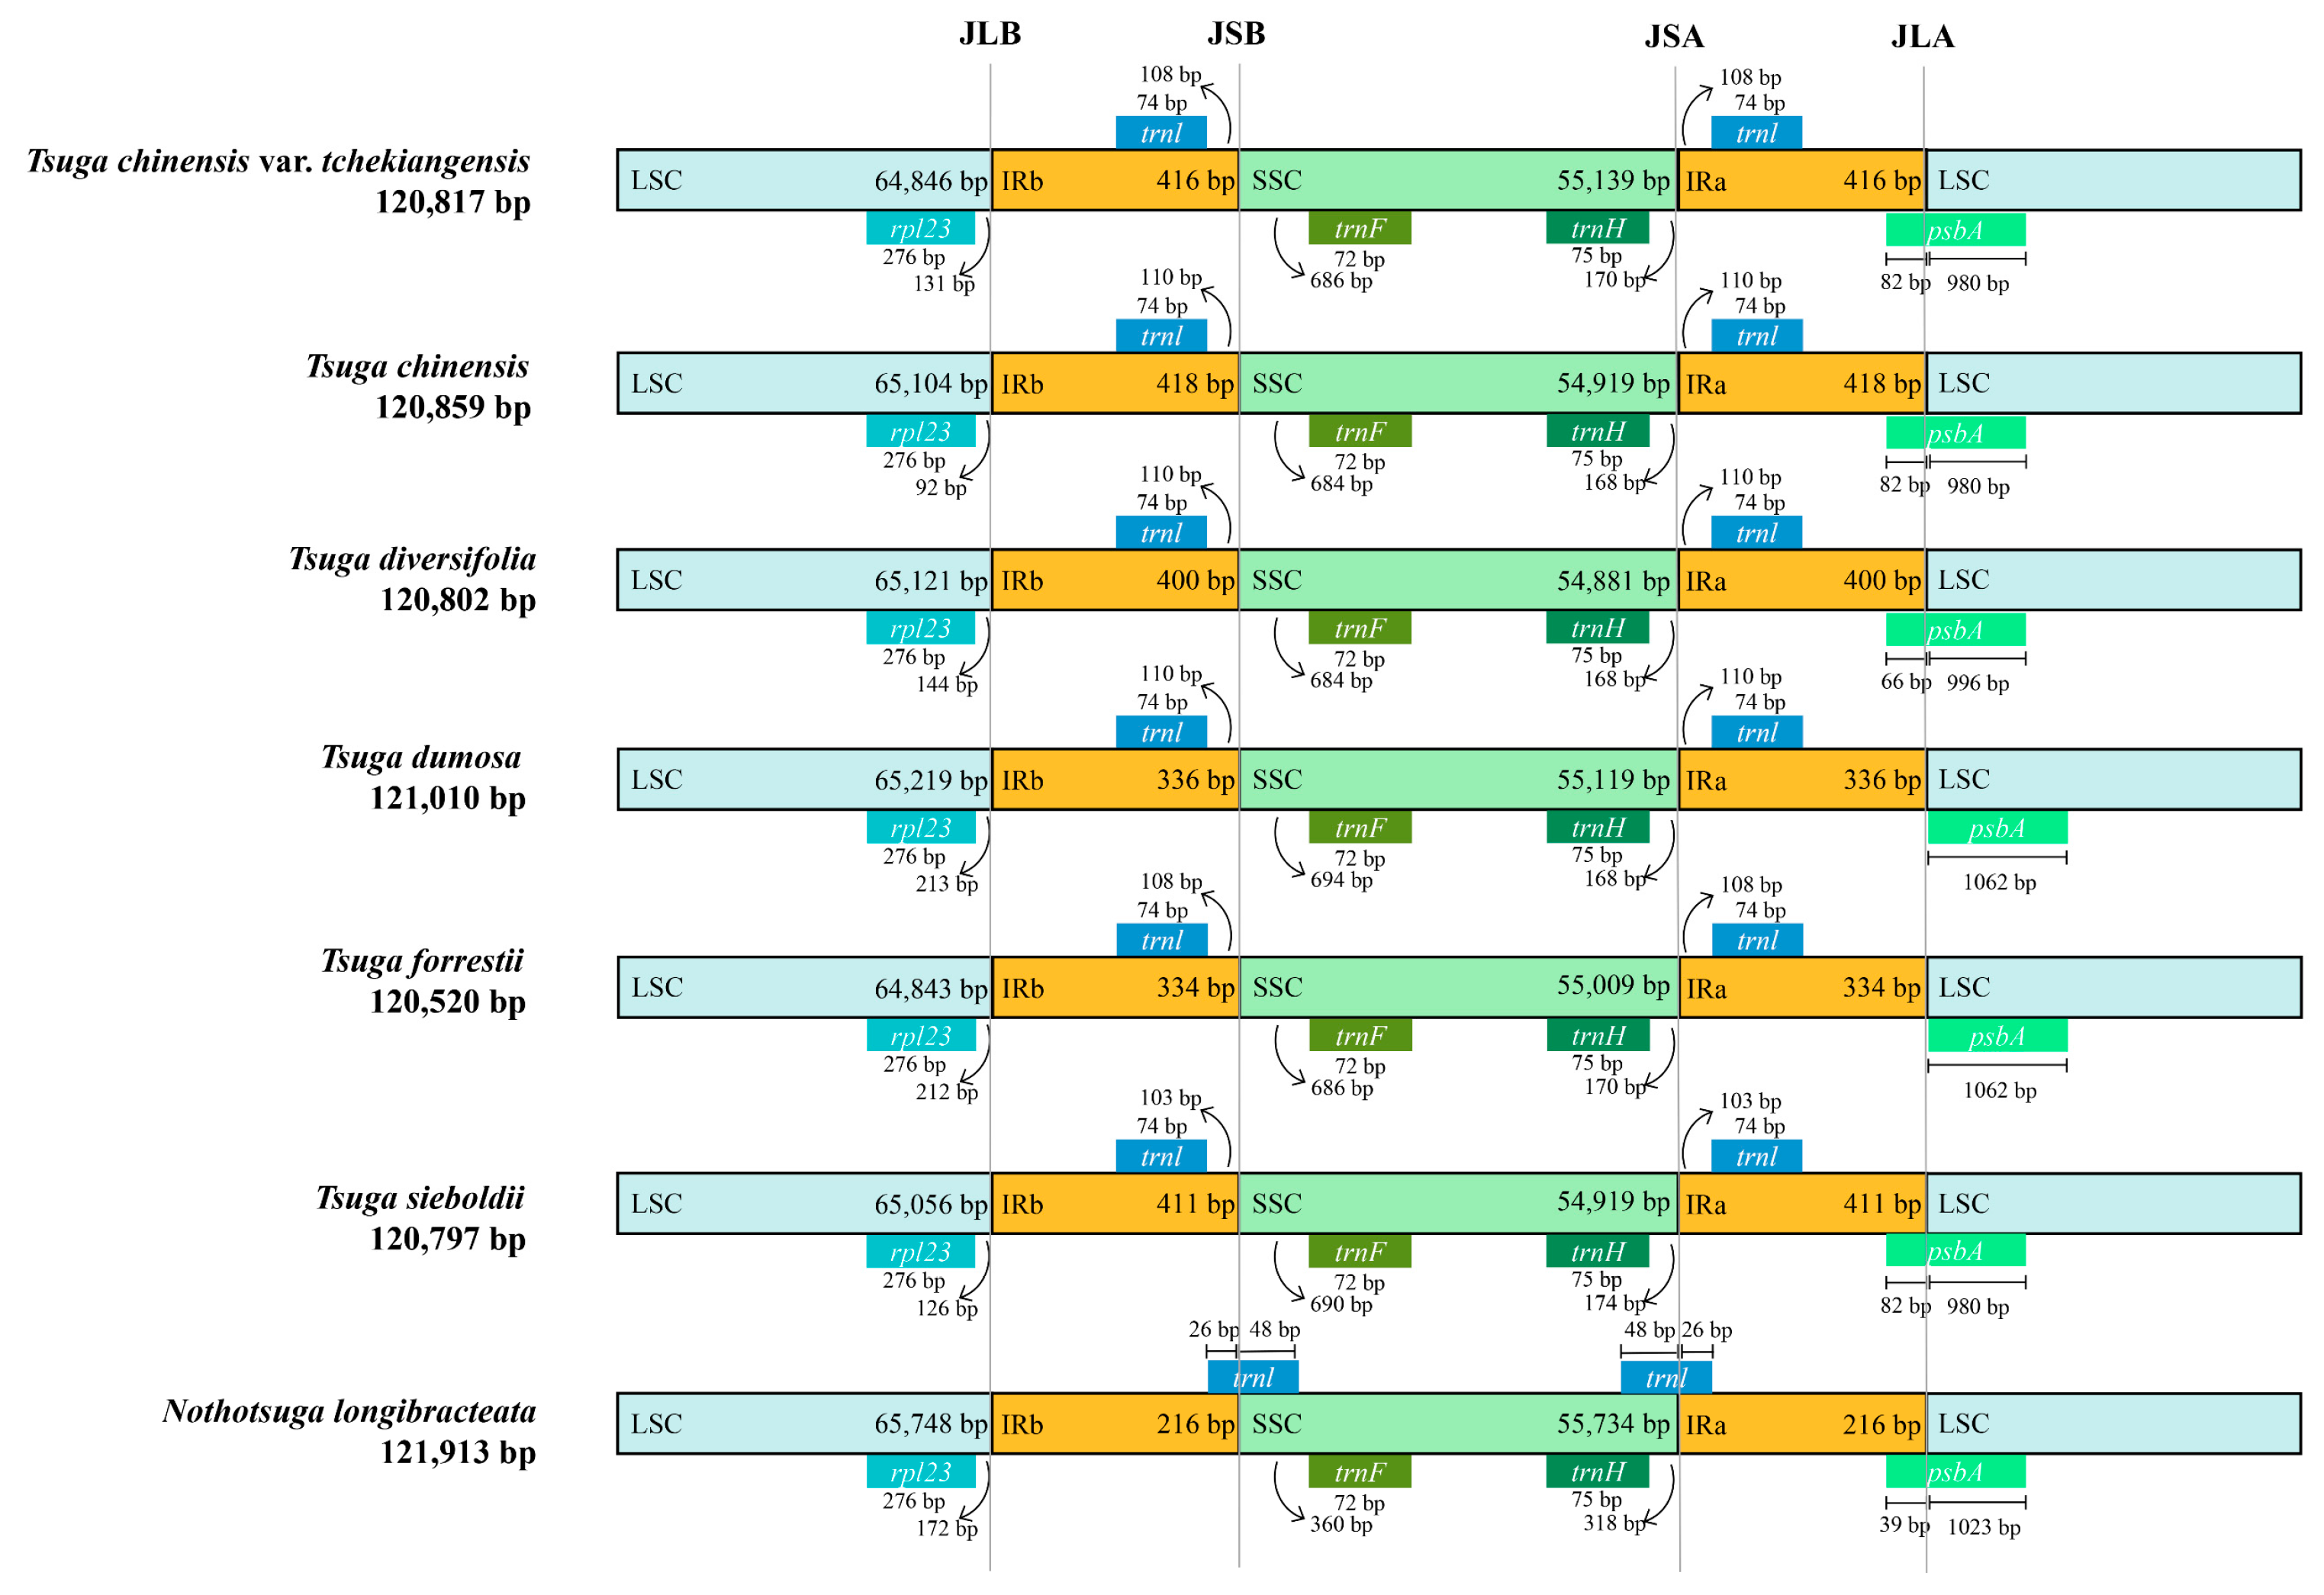
3.4. Comparison of IR Boundaries

To assess the dynamics of the inverted repeat (IR) regions within and among the Tsuga and Nothotsuga species, we conducted a comparative analysis of IR boundaries in the chloroplast genomes of these seven species (Figure 6). Notably, the IR region of N. longibracteata was drastically reduced to 216 bp’s in contrast to the Tsuga species in which the IR sections ranged from 334 to 418 bp’s. The rpl23 gene consistently resided in the LSC region near the LSC/IRb borders, with variations of 92–213 bp’s from the boundary across different species. T. dumosa and T. forrestii in particular showed the greatest distances from the IR region. The trnL gene in the Tsuga species was positioned at the junction of the SSC/IR borders, approximately 103–110 bp’s away from the boundary. In contrast, within N. longibracteata, this gene traversed the SSC/IR borders due to IR shortening, resulting in only one-third of the gene extending into the IR region. The trnF and trnH genes were consistently located within the SSC region across all species, yet their distances from the SSC/IR boundary varied among genera. In comparison with the Tsuga species, trnF was notably closer to the SSC/IRb border while trnH was situated further from the SSC/IRa border in N. longibracteata. The psbA gene resided entirely in the LSC region near the LSC/IRa borders in T. dumosa and T. forrestii but spanned the boundary in other species. Particularly, the Tsuga species exhibited similar lengths in both the IR and LSC regions. However, N. longibracteata displayed a significant reduction in the IR region, accompanied by an expansion of the SSC region.

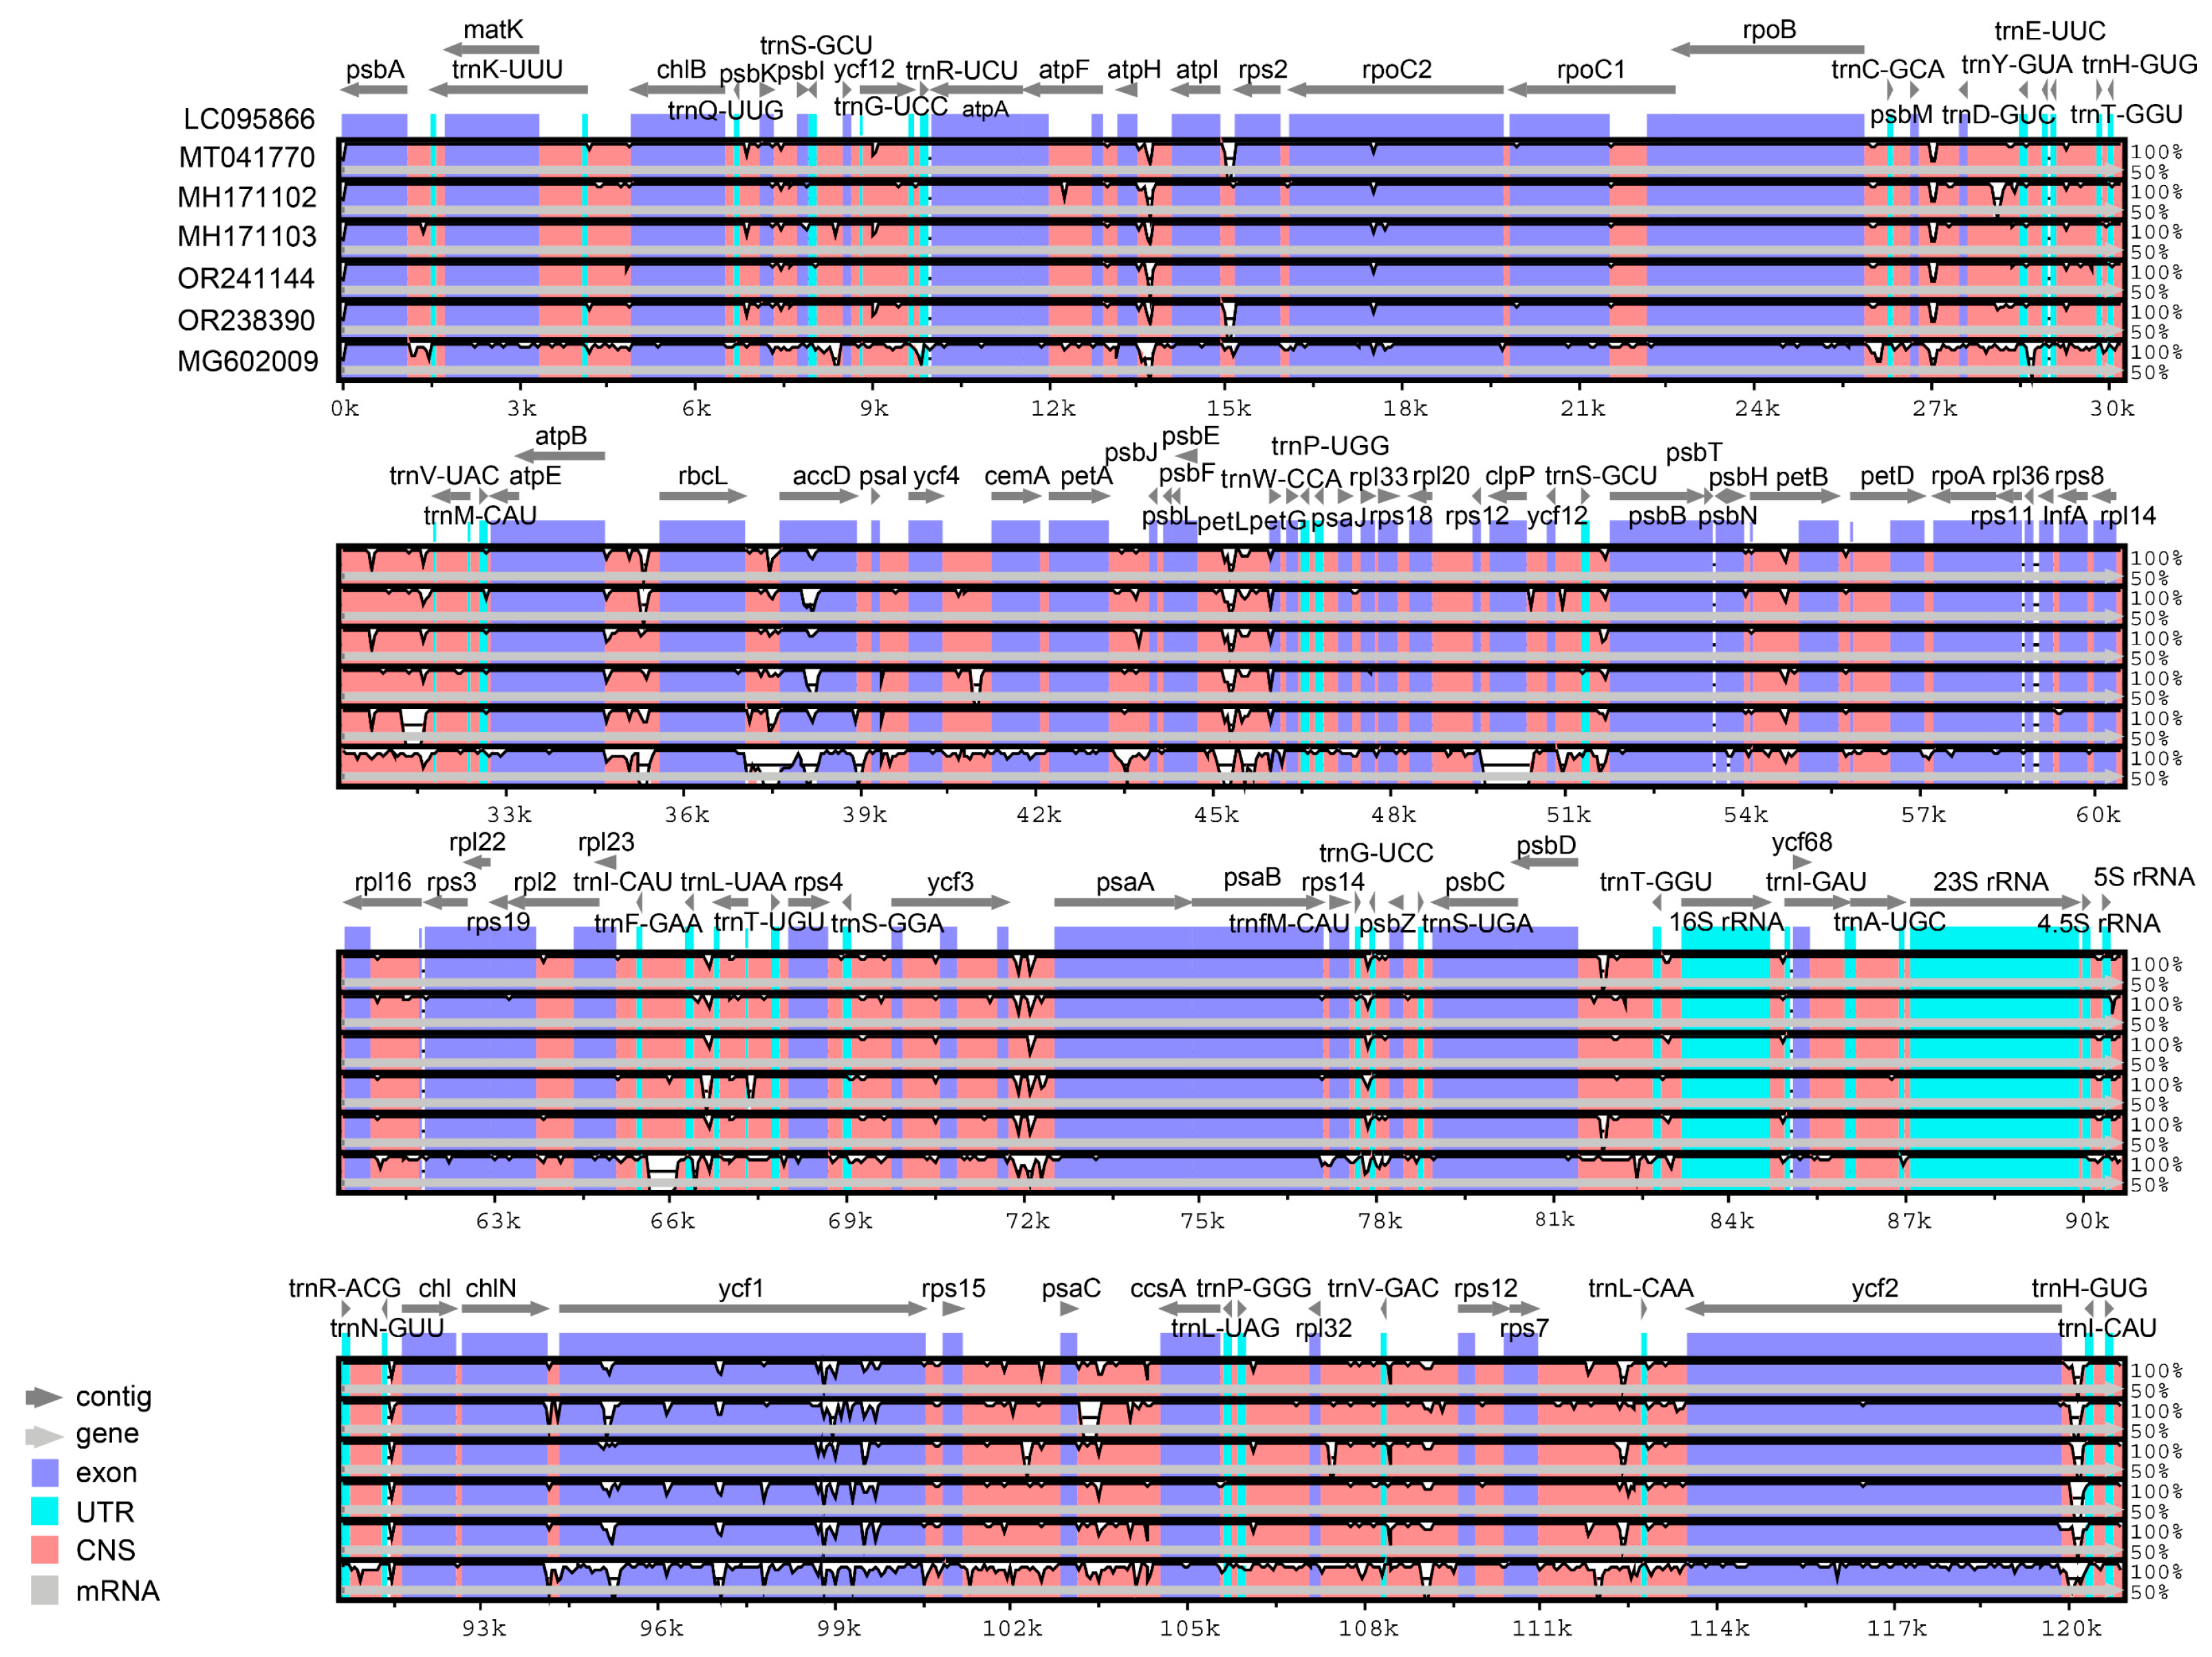
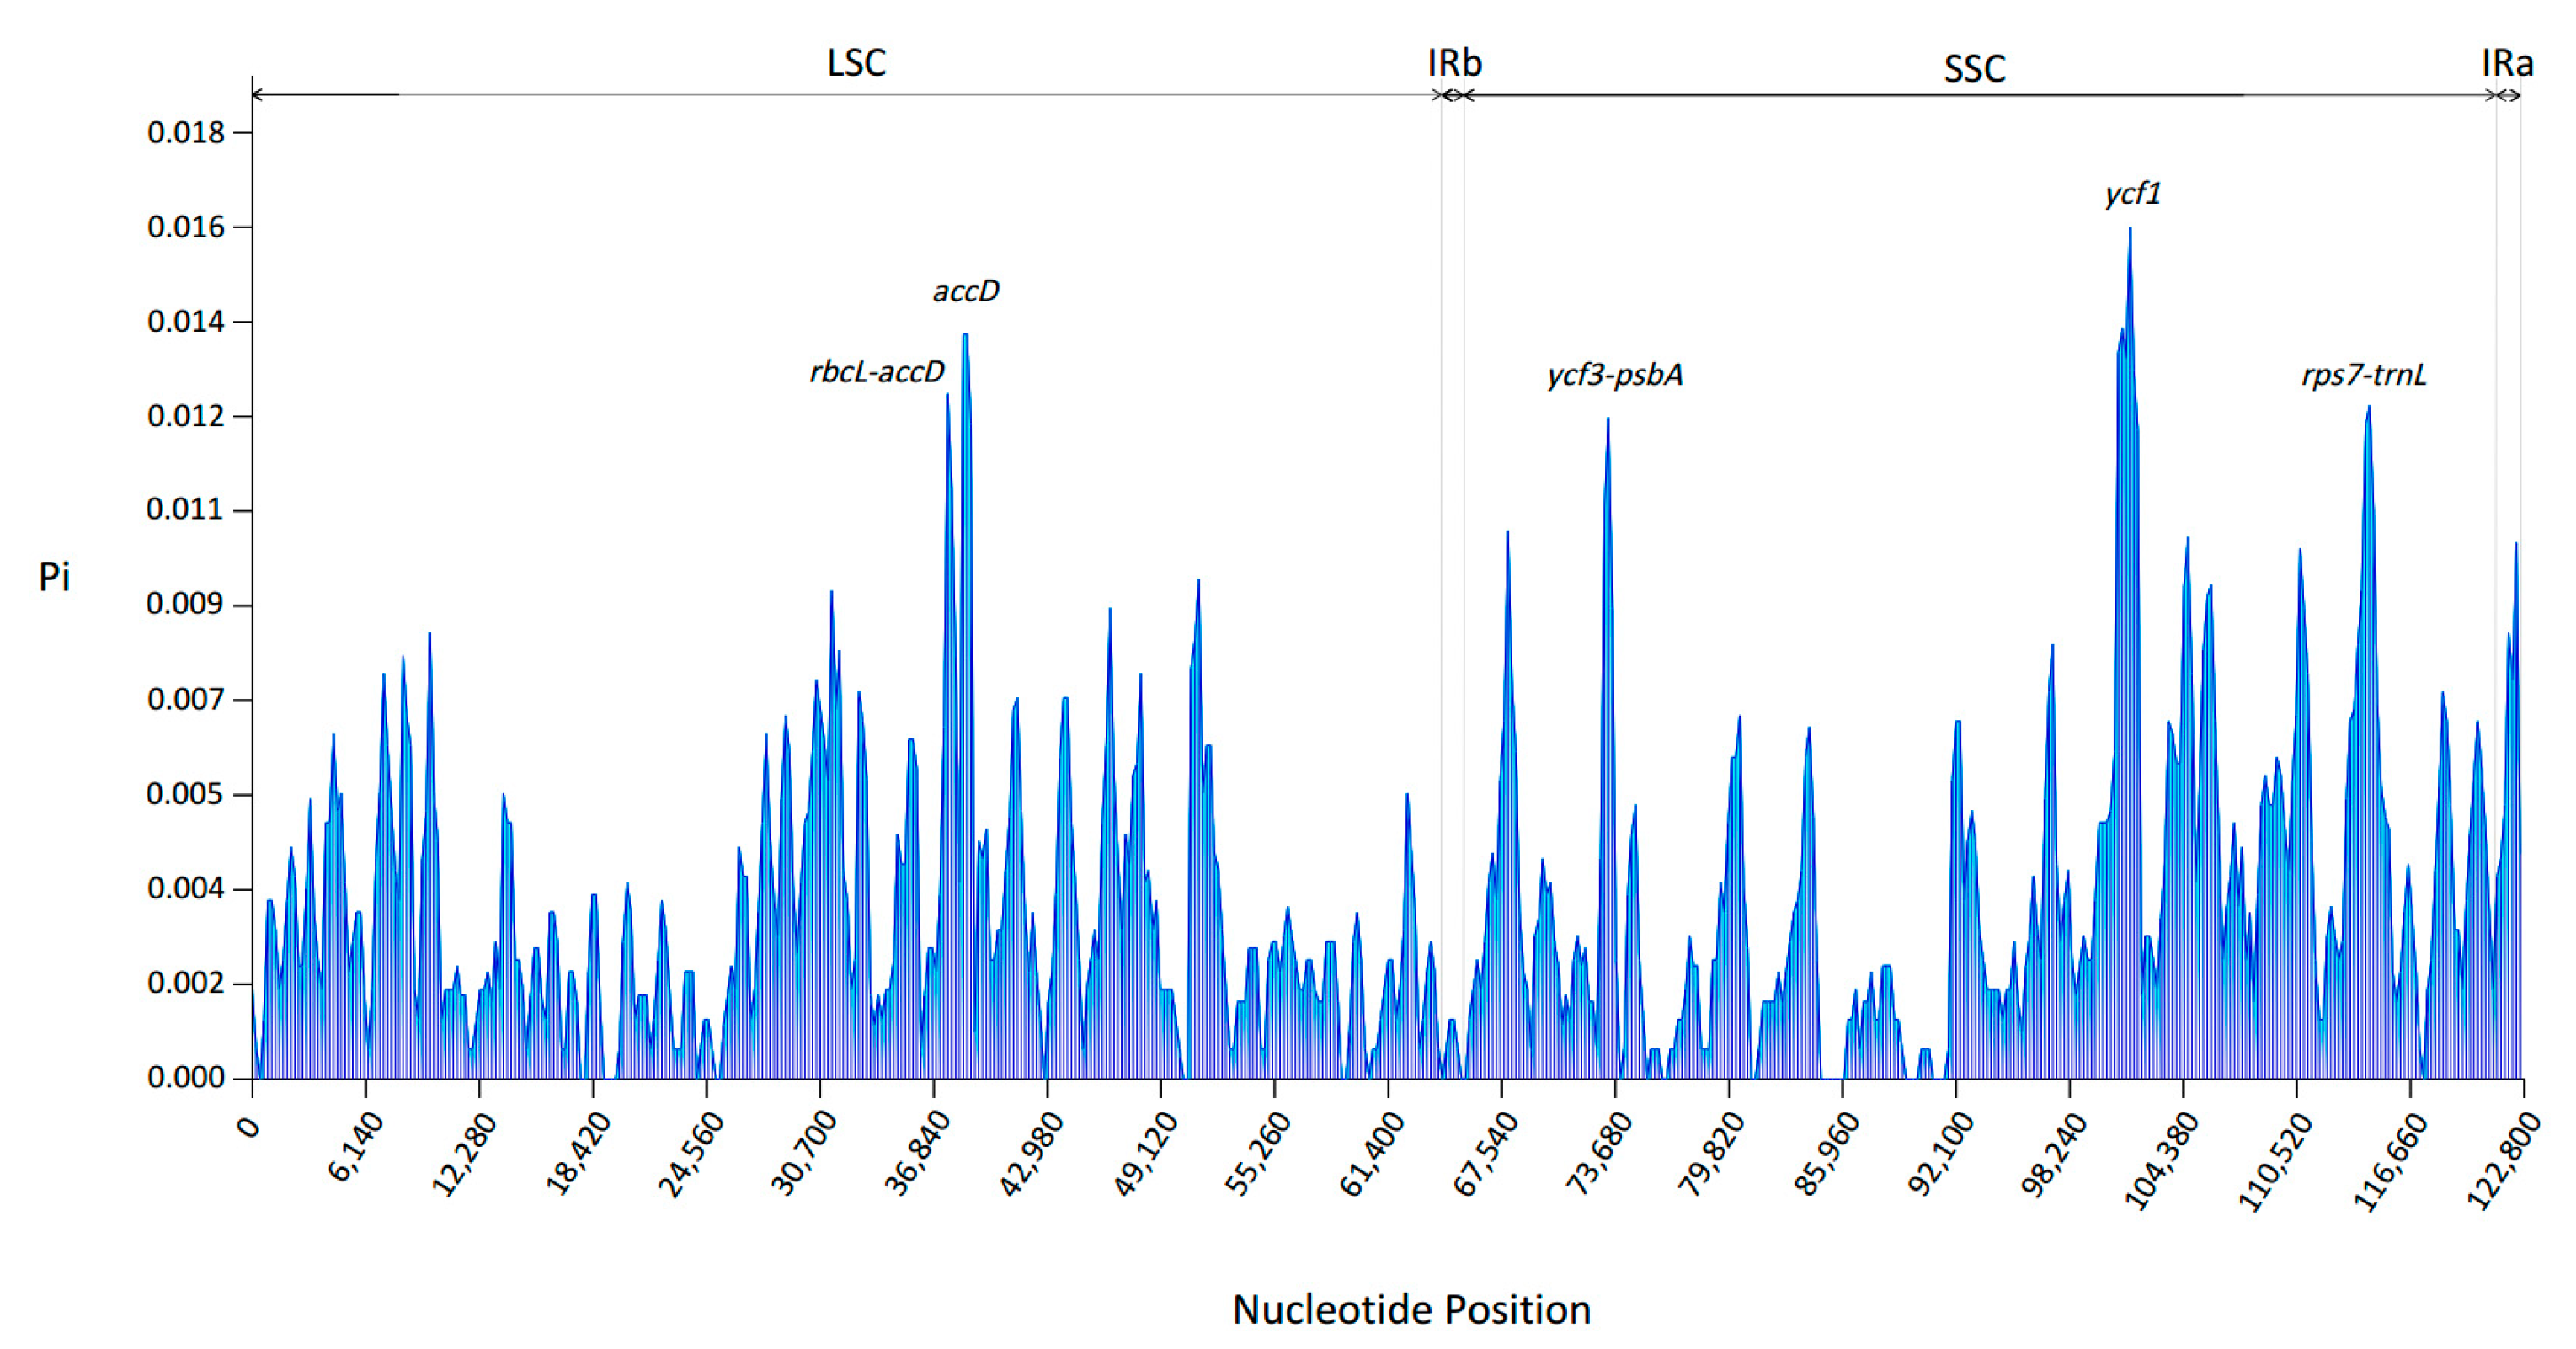
3.5. Sequence Divergence Analysis and Polymorphic Region Identification

To elucidate a differentiation in the Tsuga chloroplast genomes, we compared the cp genome sequences of six Tsuga species and N. longibracteata, using the T. chinensis sequence as a reference (Figure 7). The variation observed in Tsuga differed significantly from the variation observed in Nothotsuga. In total, sequence divergence was significantly higher in non-coding regions compared to coding regions, with the IR regions showing considerably more conservation than the LSC and SSC regions. Genes exhibiting greater divergence in the coding regions included ycf1 and accD, while sequence segments displaying substantial divergence within the non-coding region included rbcL-accD, ycf3-psaA, rps7-trnL, and trnH-trnI. This suggests that in comparison to other sequence regions, most of the gene variabilities occurred in intergenic sequences. These highly variable sequences could be further investigated for their evolutionary patterns in subsequent related molecular marker experiments.
Pi values were employed to identify the highly variable regions by calculating them within the six Tsuga species and N. longibracteata, ranging from 0 to 0.0159 (Figure 8). Generally, the IR region was more conserved than the SSC and LSC regions, with most highly variable loci located in the LSC region. Although a majority of variant loci were still situated in intergenic regions, the highly variant loci were prominently concentrated within genic regions, notably ycf1 (0.0159) and accD (0.0139). This is consistent with a genome-wide sequence alignment analysis in which ycf1 and the highly variant fragment between ycf3-psaA and rps7-trnL were situated in the SSC region. Additionally, the regions with the highest degrees of variation, accD and rbcL-accD, were positioned in the LSC region.

3.6. Phylogenetic Relationships

A total of 23 complete chloroplast genomes (Supplementary Table S1) of representative species of Tsuga and other genera in Pinaceae were employed for the construction of phylogenetic trees inferred from the Maximum Likelihood (ML) and Bayesian Inference (BI) methods (Figure 9A), along with a clustering analysis based on RSCU values (Figure 9B). Significant phylogenetic relationships were evident among the genera in Pinaceae. The topologies of the ML tree and RSCU clusters were highly consistent, with two notable exceptions: in the clustering diagram, Nothotsuga was distinctly separated from the closely related Tsuga species, and Cedrus showed a closer affinity with Pinoideae. Conversely, the BI tree exhibited substantial disparities in its intergeneric structures compared to the ML tree. However, within Tsuga and its closely related genera, the structures remained consistent. This suggests a certain correlation between codon usage bias and the phylogenetic relationships among species within Pinaceae. Within the ML tree, Cedrus, Abies, Pseudolarix, Keteleeria, Nothotsuga, and Tsuga formed a distinct clade, which is completely consistent with the taxonomic treatments of Yang et al. [37]. Tsuga and Nothotsuga were identified as the closest sister groups, followed by Pseudolarix, all with robust support exceeding 90%. Notably, within these three clustering diagrams, T. chinensis var. tchekiangensis exhibited a relatively insignificant genetic affinity with T. chinensis but showed a closer relationship with T. forrestii, supported by bootstrap values of 86% and 100% in the ML and BI trees, respectively. In contrast, T. diversifolia displayed the most distant relationship among the six species.

4. Discussion

4.1. Characteristics of the Hemlock Chloroplast Genomes

The chloroplast genomes of the gymnosperm species exhibited considerable variability, with the average chloroplast length of Pinaceae being notably shorter due to the loss of the reverse repeat region copy and ndh gene [38]. In this study, the chloroplast genome lengths of the six Tsuga species ranged from 120,520 to 121,010 bp’s, demonstrating a pronounced reduction in the IR region, a characteristic shared across Pinaceae [39]. The number, structure, and GC content of the Tsuga chloroplast genes remained relatively homogeneous and identical to the Abies chloroplast genome [40]. A distinctive characteristic of plant evolution involves the contraction and expansion of the IR region within the plant chloroplast genome [41]. Among the Tsuga species investigated here, genes near the species boundary and closely related species exhibited remarkable consistency, with the rpl23 gene in T. chinensis positioned closest to the LSC/IRb boundary, resulting in a larger IR region compared to other species. Furthermore, compared to previous studies on the chloroplast genomes of other Pinus species [42], in this study, the IR regions of Picea and Nothotsuga were considerably reduced to approximately 250 bp’s, underscoring the continuous contraction of IR regions in Pinus.
Codon preference is a complex outcome shaped by multiple factors across biological evolution. Among these factors, natural selection, mutation pressure, and genetic drift play pivotal roles. Exploring codon preference in plants provides compelling evidence for species evolution [43]. The RSCU value could reflect the genetic connections between or within species, with species that share closer genetic relationships usually displaying similar preferences in codon usage [44]. In each Tsuga species, the consistent presence of high-frequency codons (RSCU > 1) indicates a strong and uniform preference for codon usage. Genes containing these codons within the chloroplast genomes of six hemlock species may potentially demonstrate higher expression levels. Previous research demonstrated that in instances in which natural selection predominates in plant evolution, there exists a weak correlation between GC3 and GC12, with a small GC3 [45]. However, the results of our investigation deviate from this pattern, indicating a less prominent correlation between these factors. The observed GC content conservation is further supported by the ENC plot, underscoring the prevalence of natural selection over mutation pressure. Additionally, it is evident that the synonymous codon preference of Tsuga predominantly concludes with A/U in the third codon position. This is attributed to the low GC3 content and the prevalence of A or T enrichment. This is consistent with gymnosperms such as Ginkgo biloba [46], Metasequoia glyptostroboides [47], Cunninghamia lanceolata, and Cryptomeria japonica [48], as well as most angiosperms, implying that natural selection plays a prominent role in the evolutionary history of spermatophytes.
The chloroplast genome tends to possess a heightened A/T content and increased conservation due to the prevalent occurrence of short polyadenine (polyA) or polythymine (polyT) repeats, which constitute the principal elements of SSRs [49]. In our study, a predominant proportion of SSRs in Tsuga demonstrated an A/T composition and were concentrated in the LSC region, aligning with findings in Abies [40] and Pseudotsuga [42], although the total number of SSRs differed slightly. Moreover, the diversity of SSR repeats exhibited a tendency to decrease as the lengths of the SSR motifs increased. This trend indicates a high level of polymorphism within Tsuga species which could be further explored using SSR molecular markers. It is noteworthy that exclusively hexanucleotide repeats were identified in the chloroplast genome of Tsuga, differing from Abies and Pseudotsuga. This distinction suggests an elevated susceptibility of Tsuga to genome rearrangement or recombination processes.
In accordance with angiosperms, the heightened variability is commonly situated within non-coding regions, particularly in spacer sequences in the Tsuga chloroplast genomes, although the IR region is fairly conserved [50,51]. Highly variable fragments such as accD, ycf1, and psbE-petL, screened from whole-genome sequence comparisons, are consistent with previous findings in angiosperm chloroplast genomes [52] in which expansion mutations in the accD gene may result from the insertion of unique PD/H tandem repeats [35]. These highly variable genes and sequence fragments hold substantial promise for subsequent research involving molecular markers, genetic variation, and related studies.

4.2. The Phylogenetic Relationships of Tsuga and Related Genera

Multiple investigations have provided substantial evidence for the monophyletic evolution of Pinaceae, a representative family among gymnosperms. Nonetheless, the taxonomy within Pinaceae remains contentious, yielding divergent conclusions from various genetic perspectives and traditional morphological classifications [37,53]. In this study, the ML and BI trees are broadly consistent with the Bayesian tree constructed by Sudianto et al. (2016) using protein-coding genes [35]. Specifically, Nothotsuga emerges as sister taxon to Tsuga, exhibiting closer relationships with Pseudolarix according to both the Maximum Likelihood and Bayesian Inference methods, despite forming a single clade in the RSCU clustering analysis.
Earlier research categorized Pinaceae into four primary groups: P (Pinus), A (Cedrus, Keteleeria, Picea, Cathaya, Tsuga, Pseudotsuga), B (Pseudolarix, Abies), and C (Larix) [53]. Groups A and B are interchangeable, with several studies supporting that Group A represents the oldest lineage within Pinaceae. However, recent phylogenetic analyses based on plastomes and transcriptomes across various genera of Pinaceae predominantly resulted in two main topological categories [35,54] which align with the findings of this study. In addition, the slight discrepancies in the two topological trees within this study might be attributed to ancient radiation or molecular evolutionary homologies [54].
The phylogenetic tree derived from the chloroplast genomes in this study generally corresponds to the macro-classification mentioned before. The close relationship observed between Nothotsuga and Tsuga can be attributed to Nothotsuga’s initial classification within Tsuga [37]. Within the Tsuga genus, the evolutionary history of East Asian hemlock species exhibits a complex reticulate pattern, with all individuals of each species constituting a highly supported monophyletic group except for T. chinensis [3]. It has been proposed that T. chinensis is polyphyletic, with several varieties incorporated into T. chinensis, including T. chinensis var. tchekiangensis and T. chinensis var. formosana [9]. In this study, the different topologies indicate a consistent trend, with T. chinensis var. tchekiangensis being more closely related to T. forrestii, while T. chinensis is closer to T. sieboldii. This aligns with previous conclusions on the phylogenetic relationships of Tsuga species based on fossils, morphology, and other genomic data [3,6]. It is worth noting that the chloroplast genome of the T. chinensis used in this study came from Taiwan, China (i.e., T. chinensis var. formosana), which had introgression with T. sieboldii during its earlier evolutionary history [35]. Simultaneously, a cryptic genetic break formed between eastern and western populations of T. chinensis [7]. T. chinensis var. tchekiangensis, endemic to southern China [8], was sampled from the subtropical mountain evergreen forests in northern Guangdong, making it challenging to determine its population based on geographical distribution. However, the phylogenetic trees strongly suggest a closer affinity with the western population of T. chinensis and a sister relationship with T. forrestii. Although many current studies generally support the assimilation of T. chinensis var. tchekiangensis into T. chinensis [1,9], the classification of the variety remains a subject of debate, particularly as morphological differences between them may be linked to evolutionary or ecological factors that require further investigation. Most molecular evidence, including this study, actually implies a potential genetic recombination or mutation of Tsuga during the evolutionary process. Therefore, the complicated relationships and species delimitation of hemlocks warrant deep investigation and exploration, especially the taxonomy treatments of T. chinensis varieties.

5. Conclusions

The chloroplast genome is conserved within Tsuga, with natural selection significantly shaping its codon usage bias. Notably, Tsuga species possess unique hexanucleotides absent in the other species of Pinaceae, potentially making them more susceptible to gene recombination or rearrangement during evolution. Tsuga is closely related to Nothotsuga and Pseudolarix, all sharing a clade with Cedrus, an early diverging lineage in Pinaceae. We were surprised to discover that T. chinensis var. tchekiangensis, now incorporated into T. chinensis, has a closer relationship with T. forrestii. This finding partially validates that T. chinensis is not a monophyletic species and also indicates that the delimitation of T. chinensis var. tchekiangensis requires deeper and more comprehensive deliberation. Briefly, our results not only reshape our understanding of Tsuga species classification but also underscore the need for further taxonomy revision with some certain species and varieties.

Supplementary Materials

The following supporting information can be downloaded at https://www.mdpi.com/article/10.3390/f14112136/s1, Table S1: List of the chloroplast genomes of 23 species in Pinaceae involved in this study; Table S2: Composition of complete chloroplast genome of six Tsuga species; Table S3: RSCU values of chloroplast genome codons in six Tsuga species; Table S4: ENC values of chloroplast genome codons in six Tsuga species; Table S5: SSR types and locations of six Tsuga species.

Author Contributions

Conceptualization, L.C. and C.X.; methodology, L.C. and X.L.; software, X.L. and K.H.; validation, L.C., X.L. and C.X.; formal analysis, X.L., Z.W. and X.W.; writing—original draft preparation, L.C. and X.L.; writing—review and editing, L.C. and C.X.; visualization, L.C., X.L., C.X. and Z.W.; project administration, L.C.; funding acquisition, L.C. All authors have read and agreed to the published version of the manuscript.

Funding

This research was funded by the National Natural Science Foundation of China, grant numbers 31300558, 32071782, and 32360417; the Natural Science Foundation of Jiangsu Province, grant number BK20130972; and the Priority Academic Program Development of Jiangsu Higher Education Institutions (PAPD).

Data Availability Statement

All data generated or analyzed during this study are included in this published article and its Supplementary Materials.

Acknowledgments

We appreciate Yong Yang (Nanjing Forestry University) and Longna Li (Nanjing Agricultural University) for their constructive advice in revising the manuscript.

Conflicts of Interest

The authors declare no conflict of interest.

References

  1. Yang, Y.; Wang, Z.; Xu, X. Taxonomy and Distribution of Global Gymnosperms; Shanghai Scientific & Technical Publishers: Shanghai, China, 2017; pp. 638–650. [Google Scholar]
  2. Xiao, L.; Wang, H.; Guo, L.; Li, X.; Sun, N. Origin and spread of Tsuga (Endl.) Carrière based on fossil records. J. Earth Environ. 2023, 14, 9–26. [Google Scholar]
  3. Feng, Y.; Shen, T.; Shao, C.; Du, H.; Ran, J.; Wang, X. Phylotranscriptomics reveals the complex evolutionary and biogeographic history of the genus Tsuga with an East Asian-North American disjunct distribution. Mol. Phylogenet. Evol. 2021, 157, 107066. [Google Scholar] [CrossRef] [PubMed]
  4. Holman, G.; Del Tredici, P.; Havill, N.; Lee, N.S.; Cronn, R.; Cushman, K.; Mathews, S.; Raubeson, L.; Campbell, C.S. A new species and introgression in Eastern Asian hemlocks (Pinaceae: Tsuga). Syst. Bot. 2017, 42, 733–746. [Google Scholar] [CrossRef]
  5. Farjon, A. A Handbook of the World’s Conifers, 2nd ed.; Brill: Leiden-Boston, The Netherlands, 2017; pp. 1042–1055. [Google Scholar]
  6. Havill, N.P.; Campbell, C.S.; Vining, T.F.; Lepage, B.; Bayer, R.J.; Donoghue, M.J. Phylogeny and biogeography of Tsuga (Pinaceae) inferred from nuclear ribosomal ITS and chloroplast DNA sequence data. Syst. Bot. 2008, 33, 478–489. [Google Scholar] [CrossRef]
  7. Cun, Y.Z.; Wang, X.Q. Phylogeography and evolution of three closely related species of Tsuga (hemlock) from subtropical eastern Asia: Further insights into speciation of conifers. J. Biogeogr. 2015, 42, 315–327. [Google Scholar] [CrossRef]
  8. Cheng, W.C.; Fu, L.K. Tsuga. In Flora Reipublicae Popularis Sinicae; Science Press: Beijing, China, 1978; Volume 7, p. 119. [Google Scholar]
  9. Fu, L.; Li, N.; Mill, R.R. Pinaceae. In Flora of China; Wu, Z.Y., Raven, P.H., Hong, D.Y., Eds.; Science Press: Beijing, China; Missouri Botanical Garden Press: St. Louis, MO, USA, 1999; Volume 4, pp. 11–52. [Google Scholar]
  10. Liu, L.; Li, P.; Zhang, H.; Worth, J. Whole chloroplast genome sequences of the Japanese hemlocks, Tsuga diversifolia and T. sieboldii, and development of chloroplast microsatellite markers applicable to East Asian Tsuga. J. For. Res. 2018, 23, 318–323. [Google Scholar] [CrossRef]
  11. Mogensen, H.L. The Hows and Whys of cytoplasmic inheritance in seed plants. Am. J. Bot. 1996, 83, 383–404. [Google Scholar] [CrossRef]
  12. Jansen, R.K.; Raubeson, L.A.; Boore, J.L.; Depamphilis, C.W.; Chumley, T.W.; Haberle, R.C.; Wyman, S.K.; Alverson, A.J.; Peery, R.; Herman, S.J. Methods for obtaining and analyzing whole chloroplast genome sequences. Methods Enzymol. 2005, 395, 348–384. [Google Scholar]
  13. Wang, X.; Tank, D.C.; Sang, T. Phylogeny and divergence times in Pinaceae: Evidence from three genomes. Mol. Biol. Evol. 2000, 17, 773–781. [Google Scholar] [CrossRef]
  14. Kormutak, A.; Galgoci, M.; Manka, P.; Koubova, M.; Jopcik, M.; Sukenikova, D.; Bolecek, P.; Gőmőry, D. Field-based artificial crossings indicate partial compatibility of reciprocal crosses between Pinus sylvestris and Pinus mugo and unexpected chloroplast DNA inheritance. Tree Genet. Genomes 2017, 13, 68. [Google Scholar] [CrossRef]
  15. Zhao, Y. Progress in the application of chloroplast genome in botanical research. Biol. Teach. 2022, 47, 83–85. [Google Scholar]
  16. Chen, L.; Li, L.; Yang, G.; Qian, H.; Li, M. Characterization of the complete chloroplast genome sequence of Tsuga longibracteata W. C. Cheng (Pinaceae). Conserv. Genet. Resour. 2019, 11, 117–120. [Google Scholar] [CrossRef]
  17. Dierckxsens, N.; Mardulyn, P.; Smits, G. NOVOPlasty: De novo assembly of organelle genomes from whole genome data. Nucleic Acids. Res. 2016, w955. [Google Scholar] [CrossRef] [PubMed]
  18. Liu, C.; Shi, L.; Zhu, Y.; Chen, H.; Zhang, J.; Lin, X.; Guan, X. CpGAVAS, an integrated web server for the annotation, visualization, analysis, and GenBank submission of completely sequenced chloroplast genome sequences. BMC Genom. 2012, 13, 715. [Google Scholar] [CrossRef] [PubMed]
  19. Lohse, M.; Drechsel, O.; Kahlau, S.; Bock, R. OrganellarGenomeDRAW—A suite of tools for generating physical maps of plastid and mitochondrial genomes and visualizing expression data sets. Nucleic Acids. Res. 2013, 41, w575–w581. [Google Scholar] [CrossRef] [PubMed]
  20. Nakamura, T.; Yamada, K.D.; Tomii, K.; Katoh, K. Parallelization of MAFFT for large-scale multiple sequence alignments. Bioinformatics 2018, 34, 2490–2492. [Google Scholar] [CrossRef]
  21. Benson, G. Tandem repeats finder: A program to analyze DNA sequences. Nucleic Acids. Res. 1999, 27, 573–580. [Google Scholar] [CrossRef] [PubMed]
  22. Kearse, M.; Moir, R.; Wilson, A.; Stones-Havas, S.; Cheung, M.; Sturrock, S.; Buxton, S.; Cooper, A.; Markowitz, S.; Duran, C. Geneious Basic: An integrated and extendable desktop software platform for the organization and analysis of sequence data. Bioinformatics 2012, 28, 1647–1649. [Google Scholar] [CrossRef]
  23. Sharp, P.M.; Li, W. The codon adaptation index-a measure of directional synonymous codon usage bias, and its potential applications. Nucleic Acids. Res. 1987, 15, 1281–1295. [Google Scholar] [CrossRef] [PubMed]
  24. Wickham, H. ggplot2. Wires Comput. Stat. 2011, 3, 180–185. [Google Scholar] [CrossRef]
  25. Brudno, M.; Do, C.B.; Cooper, G.M.; Kim, M.F.; Davydov, E.; Green, E.D.; Sidow, A.; Batzoglou, S.; Program, N.C.S. LAGAN and Multi-LAGAN: Efficient tools for large-scale multiple alignment of genomic DNA. Genome Res. 2003, 13, 721–731. [Google Scholar] [CrossRef]
  26. Frazer, K.A.; Pachter, L.; Poliakov, A.; Rubin, E.M.; Dubchak, I. VISTA: Computational tools for comparative genomics. Nucleic Acids. Res. 2004, 32, W273–W279. [Google Scholar] [CrossRef] [PubMed]
  27. Rozas, J.; Ferrer-Mata, A.; Sánchez-Delbarrio, J.C.; Guirao-Rico, S.; Librado, P.; Ramos-Onsins, S.E.; Sánchez-Gracia, A. DnaSP 6: DNA sequence polymorphism analysis of large data sets. Mol. Biol. Evol. 2017, 34, 3299–3302. [Google Scholar] [CrossRef]
  28. Beier, S.; Thiel, T.; Münch, T.; Scholz, U.; Mascher, M. MISA-web: A web server for microsatellite prediction. Bioinformatics 2017, 33, 2583–2585. [Google Scholar] [CrossRef] [PubMed]
  29. Thiel, T.; Michalek, W.; Varshney, R.; Graner, A. Exploiting EST databases for the development and characterization of gene-derived SSR-markers in barley (Hordeum vulgare L.). Theor. Appl. Genet. 2003, 106, 411–422. [Google Scholar] [CrossRef] [PubMed]
  30. Tanner-Smith, E.E.; Tipton, E. Robust variance estimation with dependent effect sizes: Practical considerations including a software tutorial in Stata and SPSS. Res. Synth. Methods 2014, 5, 13–30. [Google Scholar] [CrossRef]
  31. Almutairi, M.M. Analysis of chromosomes and nucleotides in rice to predict gene expression through codon usage pattern. Saudi J. Biol. Sci. 2021, 28, 4569–4574. [Google Scholar] [CrossRef]
  32. Kumar, S.; Stecher, G.; Li, M.; Knyaz, C.; Tamura, K. MEGA X: Molecular evolutionary genetics analysis across computing platforms. Mol. Biol. Evol. 2018, 35, 1547–1549. [Google Scholar] [CrossRef]
  33. Ronquist, F.; Huelsenbeck, J.P. MrBayes 3: Bayesian phylogenetic inference under mixed models. Bioinformatics 2003, 19, 1572–1574. [Google Scholar] [CrossRef]
  34. Xie, J.; Chen, Y.; Cai, G.; Cai, R.; Hu, Z.; Wang, H. Tree Visualization By One Table (tvBOT): A web application for visualizing, modifying and annotating phylogenetic trees. Nucleic Acids. Res. 2023, 51, w587–w592. [Google Scholar] [CrossRef]
  35. Sudianto, E.; Wu, C.; Lin, C.; Chaw, S. Revisiting the plastid phylogenomics of Pinaceae with two complete plastomes of Pseudolarix and Tsuga. Genome Biol. Evol. 2016, 8, 1804–1811. [Google Scholar] [CrossRef]
  36. Sueoka, N. Directional mutation pressure and neutral molecular evolution. Proc. Natl. Acad. Sci. USA 1988, 85, 2653–2657. [Google Scholar] [CrossRef] [PubMed]
  37. Yang, Y.; Ferguson, D.K.; Liu, B.; Mao, K.; Gao, L.; Zhang, S.; Wan, T.; Rushforth, K.; Zhang, Z. Recent advances on phylogenomics of gymnosperms and a new classification. Plant Divers. 2022, 44, 340–350. [Google Scholar] [CrossRef] [PubMed]
  38. Ni, Z.; Ye, Y.; Bai, T.; Xu, M.; Xu, L. Complete chloroplast genome of Pinus massoniana (Pinaceae): Gene rearrangements, loss of ndh genes, and short inverted repeats contraction, expansion. Molecules 2017, 22, 1528. [Google Scholar] [CrossRef] [PubMed]
  39. Ping, J.; Hao, J.; Li, J.; Yang, Y.; Su, Y.; Wang, T. Loss of the IR region in conifer plastomes: Changes in the selection pressure and substitution rate of protein-coding genes. Ecol. Evol. 2022, 12, e8499. [Google Scholar] [CrossRef] [PubMed]
  40. Li, J.; Zhao, M.; Zhang, C.; Xiang, S.; Zheng, H.; He, Y. Comparative study on chloroplast genome and phylogenetic analysis of Abies. Biol. Chem. Eng. 2021, 7, 56–60. [Google Scholar]
  41. Huang, H.; Shi, C.; Liu, Y.; Mao, S.; Gao, L. Thirteen Camellia chloroplast genome sequences determined by high-throughput sequencing: Genome structure and phylogenetic relationships. BMC Evol. Biol. 2014, 14, 151. [Google Scholar] [CrossRef] [PubMed]
  42. Dong, X.; Wang, X.; Tang, X.; Zhang, C. Endangered species of Pseudotsuga brevifolia chloroplast genome characteristics and Pinaceae species phylogenetic analysis. Mol. Plant Breed. 2021, 21, 3917–3918. [Google Scholar]
  43. Bulmer, M. The selection-mutation-drift theory of synonymous codon usage. Genetics 1991, 129, 897–907. [Google Scholar] [CrossRef]
  44. Wu, P.; Xiao, W.; Luo, Y.; Xiong, Z.; Chen, X.; He, J.; Sha, A.; Gui, M.; Li, Q. Comprehensive analysis of codon bias in 13 Ganoderma mitochondrial genomes. Front. Microbiol. 2023, 14, 1170790. [Google Scholar] [CrossRef]
  45. Kawabe, A.; Miyashita, N.T. Patterns of codon usage bias in three dicot and four monocot plant species. Genes Genet. Syst. 2003, 78, 343–352. [Google Scholar] [CrossRef] [PubMed]
  46. He, B.; Dong, H.; Jiang, C.; Cao, F.; Tao, S.; Xu, L. Analysis of codon usage patterns in Ginkgo biloba reveals codon usage tendency from A/U-ending to G/C-ending. Sci. Rep. 2016, 6, 35927. [Google Scholar] [CrossRef] [PubMed]
  47. Wang, R.; Luo, Y.; Liu, X.; Lu, X.; Yin, G.; Deng, Z. Synonymous codon usage bias in the chloroplast genome of Metasequoia glyptostroboides. J. Hubei Minzu Univ. (Nat. Sci. Ed.) 2022, 40, 121–128. [Google Scholar]
  48. Zheng, W.; Chen, J.; Hao, Z.; Shi, J. Analysis on codon usage bias of chloroplast genes from five conifers including Cunninghamia lanceolata. Mol. Plant Breed. 2016, 14, 1091–1097. [Google Scholar]
  49. Kuang, D.; Wu, H.; Wang, Y.; Gao, L.; Zhang, S.; Lu, L. Complete chloroplast genome sequence of Magnolia kwangsiensis (Magnoliaceae): Implication for DNA barcoding and population genetics. Genome 2011, 54, 663–673. [Google Scholar] [CrossRef]
  50. Li, L.; Wu, Q.; Fang, L.; Wu, K.; Li, M.; Zeng, S. Comparative chloroplast genomics and phylogenetic analysis of Thuniopsis and closely related genera within Coelogyninae (Orchidaceae). Front. Genet. 2022, 13, 850201. [Google Scholar] [CrossRef]
  51. Moghaddam, M.; Ohta, A.; Shimizu, M.; Terauchi, R.; Kazempour-Osaloo, S. The complete chloroplast genome of Onobrychis gaubae (Fabaceae-Papilionoideae): Comparative analysis with related IR-lacking clade species. BMC Plant Biol. 2022, 22, 75. [Google Scholar] [CrossRef]
  52. Dong, W.; Liu, J.; Yu, J.; Wang, L.; Zhou, S. Highly variable chloroplast markers for evaluating plant phylogeny at low taxonomic levels and for DNA barcoding. PLoS ONE 2012, 7, e35071. [Google Scholar] [CrossRef]
  53. Wu, C.; Lin, C.; Hsu, C.; Wang, R.; Chaw, S. Comparative chloroplast genomes of Pinaceae: Insights into the mechanism of diversified genomic organizations. Genome Biol. Evol. 2011, 3, 309–319. [Google Scholar] [CrossRef]
  54. Ran, J.; Shen, T.; Wu, H.; Gong, X.; Wang, X. Phylogeny and evolutionary history of Pinaceae updated by transcriptomic analysis. Mol. Phylogenet. Evol. 2018, 129, 106–116. [Google Scholar] [CrossRef]
Figure 1. Gene map of the chloroplast genomes of six Tsuga species. Gray arrows inside and outside the circle indicate the direction of gene transcription; different colors represent genes with different functions; and in the inner circle, dark gray represents the GC content and light gray represents the AT content.
Forests 14 02136 g001
Figure 2. Relative synonymous codon usage (RSCU) analysis of six Tsuga species. (A) RSCU values of 18 amino acids and codons translated into each amino acid. The bar of each amino acid refers to T. chinensis var. tchekiangensis, T. chinensis, T. dumosa, T. forrestii, T. diversifolia, and T. sieboldii from left to right. (B) A heatmap based on the average RSCU values of the codons in the six Tsuga species. A gradient from dark blue to dark red indicates that the RSCU value increases from low to high.
Forests 14 02136 g002
Figure 3. Neutrality plot analysis showing GC12 values against GC3 values for the chloroplast genomes of (A) T. chinensis var. tchekiangensis; (B) T. chinensis; (C) T. diversifolia; (D) T. dumosa; (E) T. forrestii; and (F) T. sieboldii. The straight red line represents the line of best fit to the scatter plot.
Forests 14 02136 g003
Figure 4. ENC-GC3s plot analysis for the chloroplast genomes of (A) T. chinensis var. tchekiangensis; (B) T. chinensis; (C) T. diversifolia; (D) T. dumosa; (E) T. forrestii; and (F) T. sieboldii. The chloroplast genomes of the six species are generally scattered in small clusters, and the genes are distributed on the left side of the standard curve.
Forests 14 02136 g004
Figure 5. The type and distribution of chloroplast simple sequence repeats (cpSSRs) in the cp genomes of the six Tsuga species.
Forests 14 02136 g005
Figure 6. Comparison of tetrad boundaries among chloroplast genomes with large single-copy (LSC), small single-copy (SSC), and inverted repeat (IR) regions in six Tsuga species and N. longibracteata. JLB (LSC/IRb), JSB (IRb/SSC), JSA (SSC/IRa), and JLA (IRa/LSC) represent four junctions occurring between the two single-copy regions (LSC and SSC) and the two IRs (IRa and IRb). Genes are depicted using colored boxes. The numbers above or below the gene indicate the distance between the ends of the genes and the border sites.
Forests 14 02136 g006
Figure 7. Visualization alignment of six chloroplast genomes in Tsuga and its related species. The chloroplast genome of T. chinensis was used as the reference sequence (x-axis), and the consistency between the chloroplast genome of each species and the reference sequence ranged from 50% to 100% (y-axis). Arrows indicate genes and the direction of transcription.
Forests 14 02136 g007
Figure 8. Nucleotide diversity (Pi) values among the cp genomes of six Tsuga species.
Forests 14 02136 g008
Figure 9. Phylogenetic and cluster analysis of 23 representative species in Pinaceae. (A) Phylogenetic relationships based on cp genomes inferred from the ML/BI methods; (B) a cluster analysis based on RSCU values. The Sankey diagram illustrates the systematic position variations of 23 species between the ML phylogenetic tree and the clustering result.
Forests 14 02136 g009
Table 1. Basic information about the chloroplast genomes of six Tsuga species.
SpeciesT. chinensis var. tchekiangensisT. chinensisT. diversifoliaT. dumosaT. forrestiiT. sieboldii
GenBank No.MT041770LC095866 [35]MH171102 [10]OR241144 *OR238390 *MH171103 [10]
Size (bp’s)120,817120,859120,802121,010120,520120,797
LSC (bp’s)64,84665,10465,12165,21964,84365,056
SSC (bp’s)55,13954,91954,88155,11955,00954,919
IR (bp’s)416418400336334411
Coding (bp’s)68,75668,83762,45361,76461,65368,794
Noncoding (bp’s)52,06152,00258,34959,24658,86752,003
Number of genes111112111108108111
Protein-coding genes727372727272
tRNA genes353535323235
rRNA genes444444
Total GC (%)38.138.138.138.238.138.1
LSC (%)37.437.437.437.437.537.4
SSC (%)38.938.9393939.138.9
IR (%)37.237.337.337.535.936
* Data directly submitted to the NCBI without published references.
Table 2. The distribution of the ratio of the ENC value to the ENC expectation value for each of the six Tsuga species.
Class BoundaryT. chinensis var. tchekiangensisT. chinensisT. diversifoliaT. dumosaT. forrestiiT. sieboldii
No.F/(%)No.F/(%)No.F/(%)No.F/(%)No.F/(%)No.F/(%)
−0.15~−0.0512.2712.2712.3212.2712.2712.27
−0.05~0.051227.281227.281227.911227.281227.281227.28
0.05~0.152147.732147.732046.522147.732147.732147.73
0.15~0.25920.45920.45920.93920.45920.45920.45
0.25~0.3512.2712.2712.3212.2712.2712.27
Note: No.: ENC number; F: ENC frequency.
Disclaimer/Publisher’s Note: The statements, opinions and data contained in all publications are solely those of the individual author(s) and contributor(s) and not of MDPI and/or the editor(s). MDPI and/or the editor(s) disclaim responsibility for any injury to people or property resulting from any ideas, methods, instructions or products referred to in the content.

