Article

High Level of Phenotypic Differentiation of Common Yew (Taxus baccata L.) Populations in the North-Western Part of the Balkan Peninsula

1
Institute of Forest Genetics, Dendrology and Botany, Faculty of Forestry and Wood Technology, University of Zagreb, Svetošimunska Cesta 23, HR-10000 Zagreb, Croatia
2
Department of Biology, Faculty of Science, University of Zagreb, Marulićev Trg 9a, HR-10000 Zagreb, Croatia
3
Centre of Excellence for Biodiversity and Molecular Plant Breeding, Svetošimunska Cesta 25, HR-10000 Zagreb, Croatia
4
Department for Seed Science and Technology, Faculty of Agriculture, University of Zagreb, Svetošimunska Cesta 25, HR-10000 Zagreb, Croatia
5
Croatian Forest Research Institute, Cvjetno Naselje 41, HR-10450 Jastrebarsko, Croatia
6
Oikon, Institute of Applied Ecology, Trg Senjskih Uskoka 1-2, HR-10020 Zagreb, Croatia
7
Institute of Forest Ecology and Management, Faculty of Forestry and Wood Technology, University of Zagreb, Svetošimunska Cesta 23, HR-10000 Zagreb, Croatia
*
Author to whom correspondence should be addressed.
Forests 2022, 13(1), 78; https://doi.org/10.3390/f13010078
Submission received: 8 December 2021 / Revised: 29 December 2021 / Accepted: 5 January 2022 / Published: 7 January 2022
(This article belongs to the Special Issue Population Genetic and Morphological Diversity of Woody Plants)

Abstract

:
Common or English yew (Taxus baccata L., Taxaceae) is a conifer species, native to Europe, northern Africa, Asia Minor and Caucasus. It is a dioecious, wind-pollinated and animal-dispersed tree, known for its high-quality wood and medicinal properties, albeit poisonous. The species is rare and has been legally protected at the European and national levels. In addition, its low population density and disjunct character of distribution have reinforced the need for its protection as regeneration is mostly lacking. The aim of this study was to phenotypically characterise the north-western Balkan yew populations. Phenotypic diversity was examined for seven populations, using morphometric analysis of nine phenotypic traits of needles. Descriptive and multivariate statistical analyses were conducted to evaluate the inter- and intrapopulation variability. In addition, to test correlations between geographic, climatic and phenotypic data, Mantel test was used. We identified a geographic structure across studied populations that exhibited high levels of variability on intra- and interpopulation levels. Two groups of populations have been defined and are consistent with previously described genetic divergent lineages from separate refugia. In addition, a significant correlation between phenotypic and geographic data were revealed, i.e., isolation by distance (IBD). However, the Mantel test revealed no significant correlation between morphometric and environmental data. In conclusion, our data reveal that the historical events and persistent IBD acted in combination to produce the morphological patterns observed in common yew populations in the north-western part of the Balkan Peninsula. Finally, we suggested conservation measures to be implemented on a stand level, with habitat preservation as the main goal. In addition, ex situ conservation should be considered, both in the form of collections and urban planting, as both provide additional gene pool reserves.

1. Introduction

Data on the status of threatened species can be used as baseline information in the planning and management of protected areas [1]. One species that illustrates the complexity of conifer management and protection is the common or English yew (Taxus baccata L., Taxaceae). Despite its name, its distribution extends across much of temperate Europe, occurring also in North Africa, Asia Minor and the Caucasus [2]. It is a non-resinous, poisonous tree that grows up to 20 (−28) m, often with multiple trunks. It has thin, scaly, reddish-brown bark and glossy, dark green needles. It is one of the few dioecious conifers, producing seeds surrounded by bright red aril [3]. Although slow growing, the species is extremely long-lived, with individuals living up to 5000 years [4]. Yew is a relatively tolerant species, growing in a wide variety of soils and light conditions, although it prefers humic, well-drained soils and partial shade. It tolerates rainfall in the range of 500–1000 mm but truly thrives in a humid climate (>2000 mm). In an oceanic climate, it forms dense stands, while in more continental conditions it becomes increasingly an isolated understorey tree [3,4]. Yew is capable of photosynthesis over the broadest temperature range of any European species. It is particularly well adapted to low-light conditions of forest understory and winter months but remains sensitive to frost; prolonged harsh winters; and cold, dry winds [3,4,5,6]. However, it is resistant to smoke; fire; and air pollution, making it a good choice for urban trees [7]. As a tertiary relict, yew grows across eleven plant associations in Europe [8], in two divergent gene pools as a result of two separated refugia during glacial periods [9].
Used since ancient times for weapon-making and carving due to its high-quality wood, yew has also been a source of taxane, a drug compound used in chemotherapy [10]. Unfortunately, yew stands were overexploited and poorly managed in the 20th century, which, together with limited natural regeneration, has led to the current state of dwindling populations [2,11]. In addition, herbivory of seeds and seedlings, heavy grazing by deer [3], and seedling competition for light with other shade-tolerant species have contributed to the decline in the regeneration of existing stands [12,13]. This has led to the protection of woodlands hosting yew by the Habitats Directive of the European Community (Habitats Directive 92/43/EEC), and the species itself is categorised as “least concerning” or “LC” on the European Red List Category and Criteria [14]. In addition, the species has found its way into the Red Books of several European countries (e.g., in the Czech Republic, Croatia, Slovakia, Bulgaria, Romania, Russia and Iran) and is under varying degrees of nature conservation on national levels [8,14].
Although the species is long-lived, it is very rare and grows individually, forming small stands across the north-western Balkan Peninsula mountains. With very low population density, yew grows as a solitary tree or in small groups throughout beech forests, as well as mixed beech-spruce and beech-fir forests on limestone. Larger groups occur in only one forest association, Tilio platyphylli-Taxetum Glavač 1958 [15]. Covering small areas, this rare association is a permanent stage on steep limestone blocks, in the montane and high-montane beech belt limited to Dinaric canyons and mountains, in areas with higher air humidity and carbonate humic soils. In comparison to the central European associations, continental populations of Tilio-Taxetum boast a thermophilic character, which, in addition to skeletal soils, influences the admixture of thermophilic and lithophilic floral elements. The biodiversity of yew populations found in the north-western Balkan Peninsula result from their position in the contact zone between two divergent lines of origin. This area was the refugia for a number of species during the Last Glacial Period and thus enabled the survival of a larger number of yew populations [9].
By knowing the levels of genetic diversity, appropriate conservation programs can be implemented on a population level. The baseline genetic diversity can be revealed by investigating the phenotypic variability, i.e., by determining the differences between individual populations or regions. Leaves, as phenotypically plastic organs, are particularly well-suited for this, since they can reveal the development of adaptations to the local environment as the result of long-term selection since leaf morphology can reveal local adaptations [16].
In this study, we analysed morphological needle traits to investigate the diversity of yew populations from the north-western part of the Balkan Peninsula. Our main hypothesis was that the phenotypic diversity among common yew populations in the studied area was the result of past historical events, i.e., a consequence of the admixture of divergent lineages colonising Europe from separate refugia in the western and eastern part of the continent. The main aims of the present study were: (1) to conduct an morphological investigation of common yew populations in the north-western Balkan Peninsula; and (2) to verify the hypothesis that the intra- and interpopulation diversity at the phenotypic level corresponds to the differentiation previously described using molecular markers [9].

2. Materials and Methods

2.1. Plant Material

Due to the conservation status of the species, plant material for morphometric analysis could not be collected in the usual way (cutting the shoots). Therefore, shoots with needles were only carefully photographed with a millimetre ruler, without any damage done to the trees. The photographs were taken in July of 2016 and 2017 and later transferred to the computer as TIF files, which were used as a data source for the morphometric analysis software. Thirty needles from the middle of the two-year old shoots were selected for photography and measured afterwards. We included 15 individuals in each of the seven populations in the north-western part of the Balkan Peninsula, belonging to two different geographical regions—Dinaric and continental (Figure 1, Table S1). In both regions, yew grows in northern exposition on carbonate soils, often with protruding limestone blocks. The Dinaric region is also characterised by higher altitudes and a colder climate, with significant snowfall and shallow but humic soils. Here, yew competes with fir and beech, being equally shade-tolerant. In the continental region, however, the lower humidity and better drained soils favour beech and are generally less-suited for yew. The Dinaric group included the populations Učka (P01), Senj (P02) and Klek (P03), whereas populations Bistra (P04), Horvatove stube (P05), Tisova peć (P06) and Strahinščica (P07) represented the continental region (Table S1). The seven populations are well distributed over the total range of yew in the north-western Balkans as they grow disjunctly and in few stands.

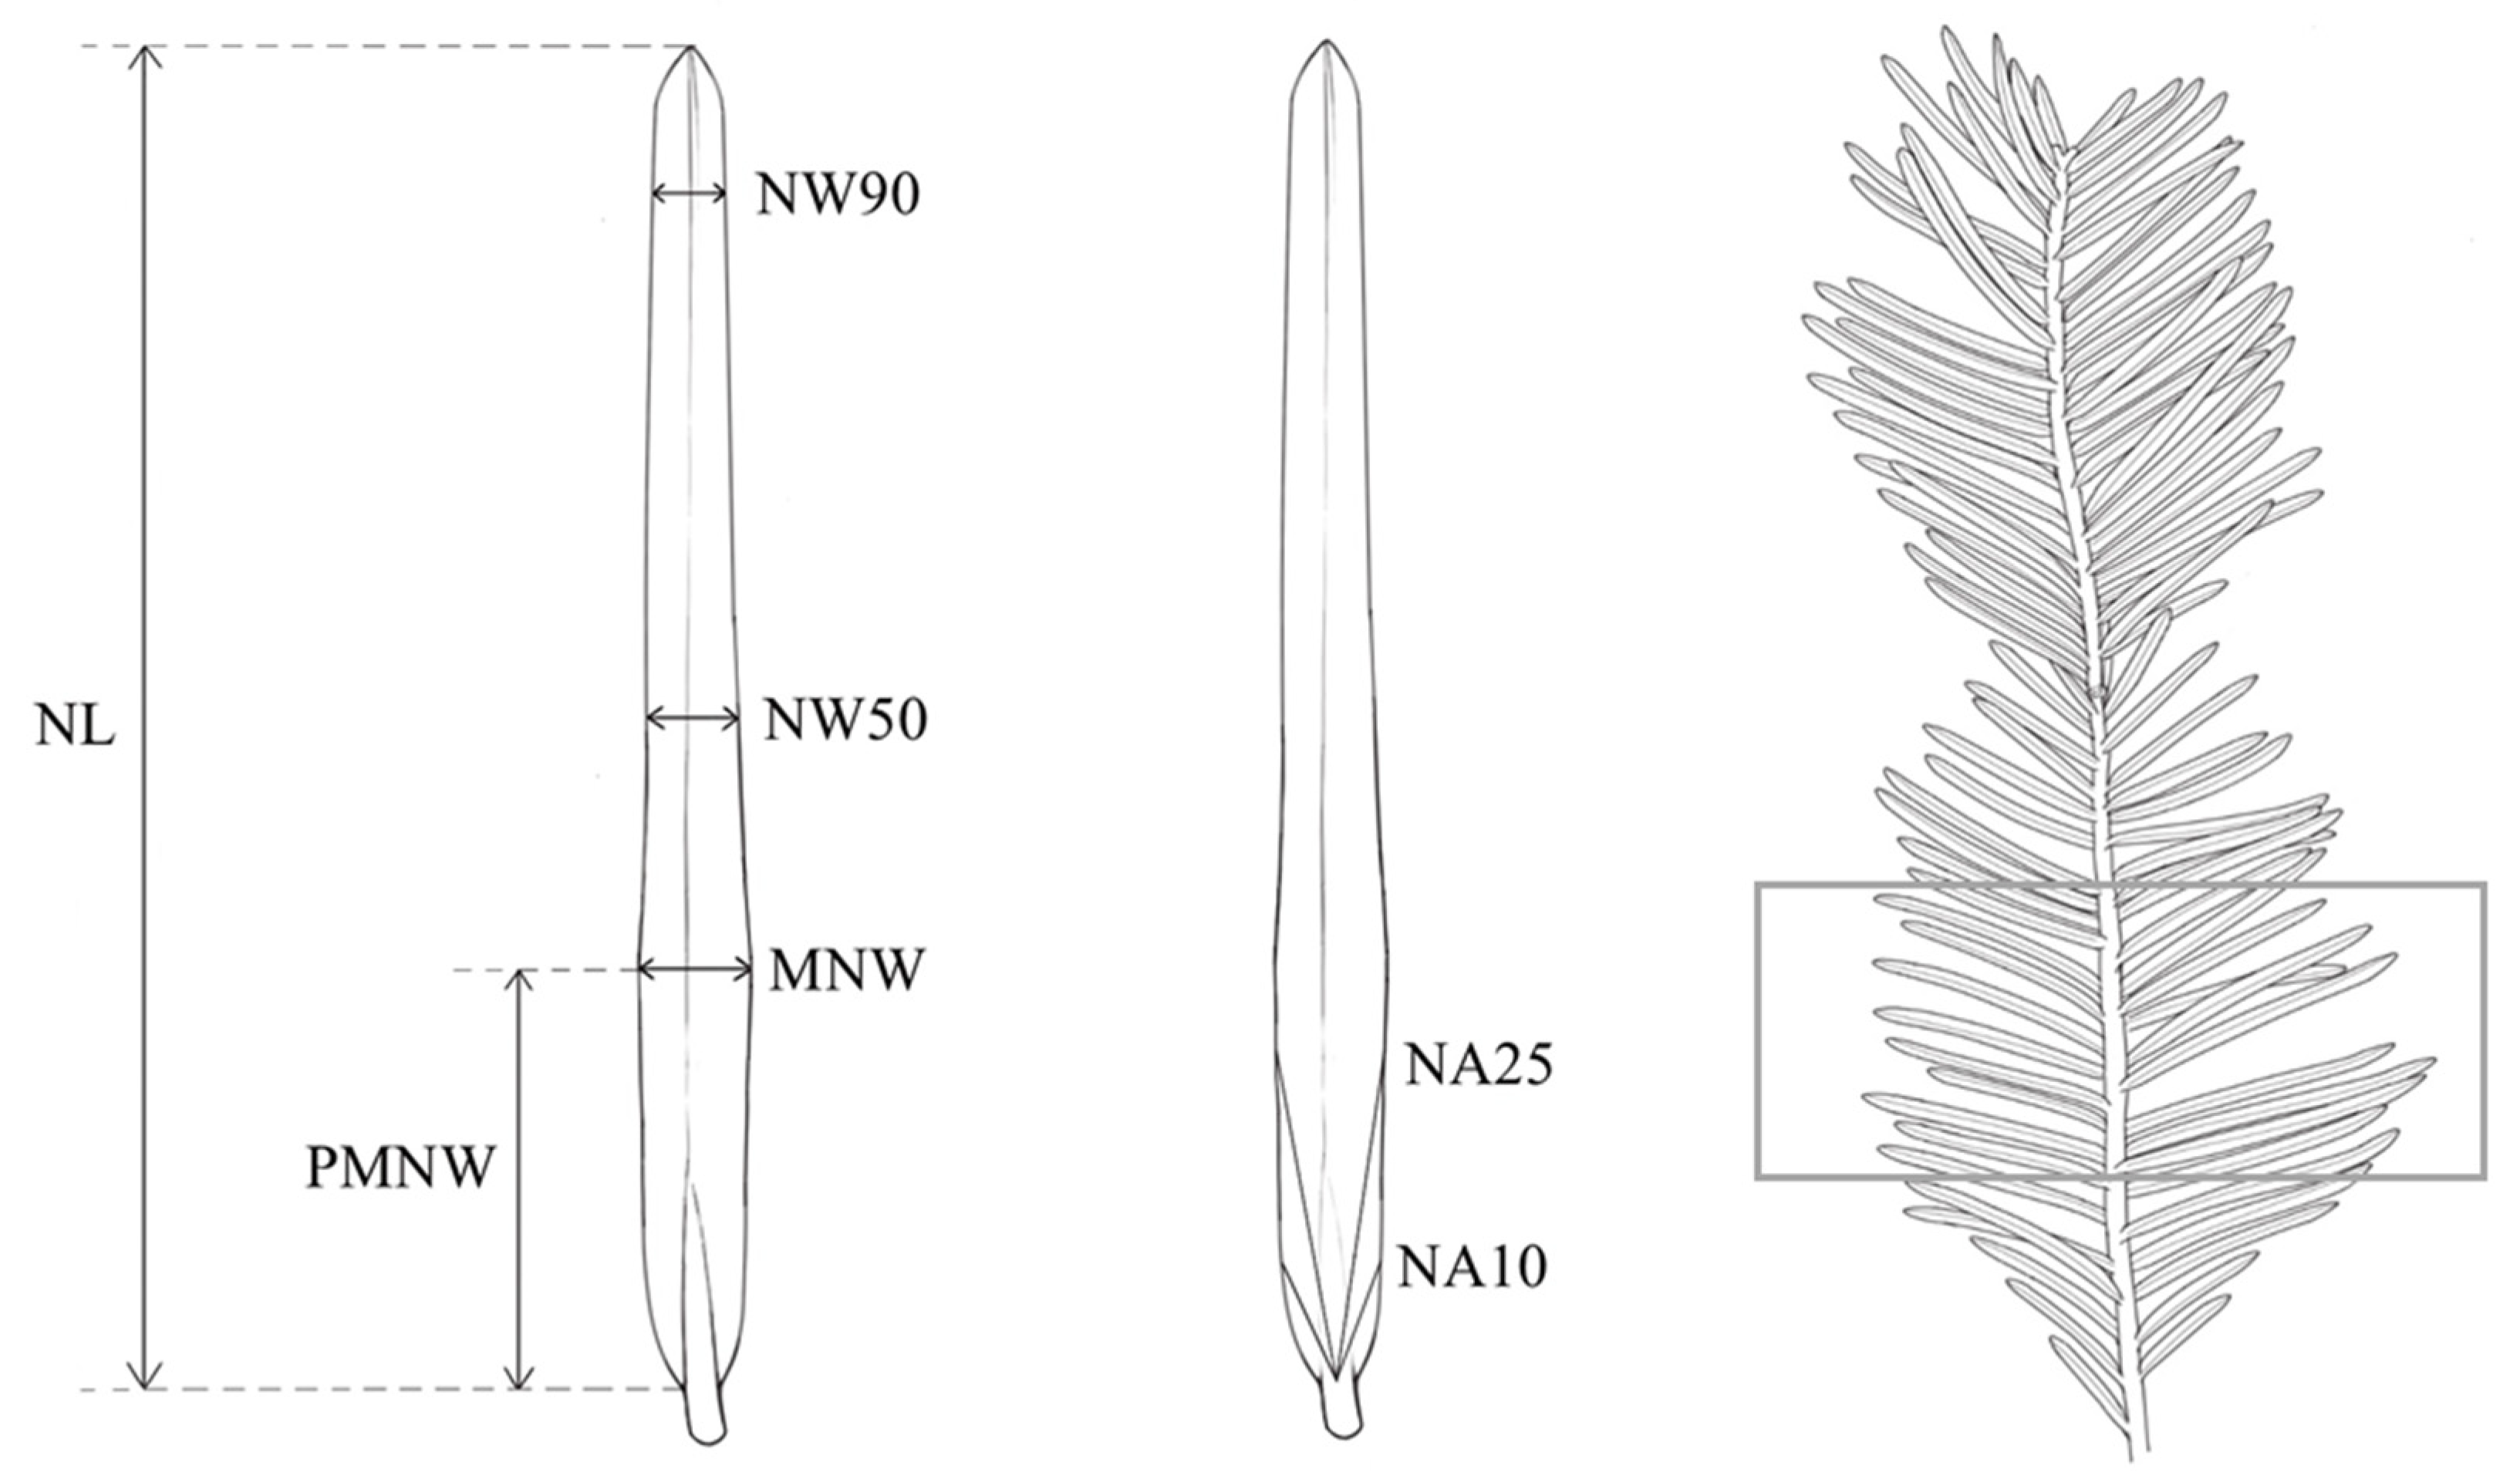
2.2. Morphometric Analysis

Morphological data were taken from the images using WinFOLIA Pro 2005 [17]. In total, eight needle traits were measured, with 0.1 mm (0.1 mm2 for needle area) accuracy (Figure 2): needle area (NA); needle length measured from the base of the needle up to the tip, along the central vein (NL); maximum needle width (MNW); needle length, measured from base to the widest point of needle (PMNW); needle width at 50% of needle length (NW50); needle width at 90% of needle length (NW90); angle enclosed by the main vein and line between needle base and point at 10% of needle length (NA10); and angle enclosed by the main vein and line between needle base and point at 25% of needle length (NA25). To further analyse the needle shape, needle length/maximum needle width (NL/MNW) ratio was calculated.

2.3. Statistical Analysis

The arithmetic mean (M) and coefficient of variation (CV%) were calculated for all measured parameters [18]. Statistically significant differences between the studied regions, among populations within regions, and within populations were determined using hierarchical analysis of variance. The restricted maximum likelihood method (REML) was used to establish the share of individual sources of variability in the overall variance. Descriptive statistics and hierarchical analysis of variance were carried out using the STATISTICA software package Version 13 [19].
To assess the possibility of conducting multivariate statistical analyses and parametric tests, the symmetry, unimodality and homoscedasticity of data were verified [18]. As-sumptions of normality were checked using the Shapiro–Wilk test, and the assumption of homogeneity of variance using Levene’s test. The original data of all traits except LA, NL, NW90 and NA25 have a non-homoscedastic character, which prevented direct utilization of parametric analyses, but after standardization they had a homogenous level of variation.
To identify the divergence and structure of the studied populations, multivariate statistical methods were used [20]. Firstly, the K-means clustering method was applied to detect structure and define the number of K-groups that best explained the morphological variation of populations [21,22,23,24]. Afterwards, agglomerative hierarchical clustering algorithms were used to construct a tree diagram using populations as operational taxonomic units (OTUs). Pairwise Euclidian distances were calculated, and cluster analysis was performed using the unweighted pair-group method with arithmetic mean (UPGMA). The data used in both analyses were previously standardised, i.e., variables were standardised to zero mean and unit standard deviation. Analysis of discrimination was performed to evaluate the utility and importance of measured needle traits by determining which were most useful in maximally discriminating the populations and studied regions, and to eliminate possible redundant variables. Finally, the proportion of individuals correctly classified into the above-mentioned groups was determined using classificatory analyses of discrimination. Posterior probabilities of classification of each individual into studied regions from the results of the classification analysis of discrimination were presented with a barplot [24,25]. The above multivariate statistical analyses were conducted using the “MorphoTools” R scripts in R v.3.2.2 [26] by following the manual of Koutecký [25].
To test correlations between morphometric, geographic and environmental data, three different matrices were calculated. To calculate the environmental distance matrix, climate data were obtained from the WorldClim 2 database with a spatial resolution close to a square km [27,28]. Environmental differences were calculated as the Euclidian distance between the population means for the first three principal components of the principal component (PC) analysis. Squared Mahalanobis distances between the populations were computed to obtain a matrix of morphometric distances among the studied populations. Geographic distances were calculated from the latitude and longitude of the site of sample collection. Finally, to assess isolation by distance (IBD) and isolation by environment (IBE), response matrix (morphological differences) was compared to the two predictor matrices (climate differences and geographic distance) using simple Mantel tests [29,30,31]. The significance level was assessed after 10,000 permutations, as implemented in NTSYS-pc Ver. 2.02 [32].

3. Results

3.1. Needle Morphometric Traits and Population Variability

The distribution frequency of the examined traits was normal or only slightly left- or right-biased (data not shown), which enabled further statistical analyses.
When observing the results of needle morphometric traits analysis in Table 1, a clear distinction between the Dinaric (P01—Učka, P02—Senj and P03—Klek) and continental (P04—Bistra, P05—Horvatove stube, P06—Tisova peć and P07—Strahinščica) groups can be observed. The Dinaric populations were characterised by lower values for the six traits related to the basic needle dimensions, e.g., NA, NL, PMNW, MNW, NW50 and NW90, meaning that the continental populations, with respective traits’ values of 0.46, 23.68, 7.58, 2.45, 2.26 and 1.49 have longer and wider needles. The values of the angles NA10 (24.43°) and NA25 (12.37°), however, were less acute in the Dinaric populations than the values calculated for the continental populations (20.15° and 10.26°, respectively). Between the populations of each bio-geographical region, a slight difference in data range can be noted for some variables. NL and NA25 values show wider range in Dinaric, whereas MNW, PMNW and NW90 have a wider range of data in continental populations.
In general, the diversity level was very similar both among the individual populations and between the two regions. Continental populations demonstrated above-average values of parameters NA, NL, MNW, PMNW, MNW, NW50 and NW90, and below average values for NA10 and NA25.
Although having lower mean values of the needle traits, the Dinaric populations were more variable, with NA, NL, PMNW, NW90 and NA10 having a higher coefficient of variations than those measured in the continental populations. The most variable trait overall was PMNW, with a maximum value of 43.51% in population P03 (Klek). Second most variable trait was NA, with a maximum value of 31.44% in population P02 (Senj). The least variable was parameter MNW, with a minimum value of 10.27% calculated for population P01 (Učka).
Population P07 (Strahinščica) was characterised by having the highest values for traits NA, MNW, NW50 and NW90 while also being the least variable population with the lowest coefficients of variability for traits NA, NW90, NA10, NA25 and NL/MNW. On the other hand, population P01 (Učka) had the lowest overall values for most of the traits (NA, NL, PMNW, NW90 and NL/MNW). Needle traits referring to angles showed the lowest values in population P06 (Tisova peć). Populations P05 (Horvatove stube) and P03 (Klek) were characterised by having mostly intermediate trait values.
Hierarchical analysis of variance has confirmed the existence of two distinct groups of populations of common yew in the studied area: the continental and the Dinaric (Table 2). These two groups displayed significant differences in most of the analysed parameters. Significant differences between the regions were not found for parameters MNW, NW50 and NW90. Significant differences between populations within the region, as well as between individual trees within a population, were established for all of the measured parameters. For variables NA, NL and NA10, most of the variability was linked to inter-regional variability, whereas the effect of error accounted for most of the variability for variables MNW, PMNW, NW50, NW90 and NA25. Most of these variables had intra-population variability as the second highest component of variance.

3.2. Population Structure

K-means clustering method (Figure 1A) inferred the population structure of the seven populations based on eight morphological needle traits. Two clusters were clearly visible, corresponding to geographical regions. The Dinaric cluster encompassed three populations, marked green. The four continental populations were marked blue and formed the second, well-defined cluster. Populations P01 (Učka) and P02 (Senj) showed an entirely Dinaric origin, whereas the population P03 (Klek) demonstrated a mixed but predominantly Dinaric origin. The origin of populations P04 (Bistra), P05 (Horvatove stube) and P06 (Tisova peć) was entirely continental, unlike population P07 (Strahinščica), which demonstrated a mixed but overwhelmingly continental origin.
To further demonstrate the clustering character, UPGMA hierarchical dendrogram is created (Figure 1B). Two distinct branches are present, which follow the data distribution of the results of morphological parameters’ analysis and K-means clustering.
To determine which of the measured morphological traits had the highest discrimination power between the seven studied populations, and between the two geographical regions previously established by the K-means clustering method, two analyses of discrimination were performed. Overall results of the analyses of discrimination based on eight morphological needle traits have been shown to be significant in discriminating between studied populations (Wilks’ λ = 0.062; F (54.463) = 6.217; p < 0.00001) and between regions (Wilks’ λ = 0.409; F (8.960) = 17.331; p < 0.0001). The most closely correlated traits (r > 0.95) were highly redundant: LA and NL. Therefore, NL was omitted from subsequent analyses.
Based on the partial Wilk’s λ values, researched populations were differentiated primarily by traits related to needle base shape (NA10 and NA25). Other significant traits, in descending order of significance, were PMNW, MNW, NW90 and NA. Aforementioned traits were used in canonical analysis of discrimination. The overall classification rate on the population level was 67.6%. The lowest percent of correctly classified individuals was observed in the P05 (Horvatove stube) population (33.3%), and the highest in the P01 (Učka) population (86.7%).
For six variables and seven groups defined in the canonical analysis, six discriminant functions were defined. Discriminant function 1 has proven to be the most discriminative in separating populations of the Dinaric region (P01—Učka, P02—Senj and P03—Klek) and the continental region (P04—Bistra, P05—Horvatove stube, P06—Tisova peć and P07—Strahinščica). Populations of the Dinaric region were best separated from the continental population P07 (Strahinščica) and other continental populations in general, by parameters NA and LA10. In general, Dinaric populations were defined by smaller needles and the more oval base of the needles. Figure 3 presents projections of canonical variables for discriminant functions 1 and 2. Projections of trees in the Dinaric populations are coloured green, whereas trees from the continental populations are blue. Although the canonical values form a continuous data cloud, e.g., there is overlap between the two groups of populations, a clear distinction between the Dinaric and the continental group along the first discriminant axis is visible.
Four out of eight morphological traits (NA10, MNW, NA and NW90) were selected as the best discriminating factors between Dinaric and continental regions by stepwise analysis of discrimination. The discriminant function based on four morphometric traits showed a classification success of 87.85%. The barplot with posterior probabilities of classification of each individual into each group from the results of the classification analysis of discrimination is shown in Figure 1C.

3.3. Isolation by Distance (IBD) and Environment (IBE)

A simple Mantel test identified significant correlations (r = 0.627, p < 0.001) between morphological and geographic distances, proving an influence of isolation by distance (IBD) on needle morphology. Isolation by environment (IBE), however, did not contribute to the morphological variability, as proven by a lack of significant correlation between morphological and bioclimatic distances (r = 0.390, p = 0.127).

4. Discussion

The needle morphometric trait values obtained in our research are mostly in agreement with the previously reported data for European and North African yew populations [33,34,35,36,37,38,39,40], with needle lengths and widths ranging from 22.8–24.4 mm (average 23.7 mm) and 2.2–2.7 mm (average 2.5 mm) for continental populations and 15.6–20.5 mm (average 18.0 mm) and 2.1–2.3 mm (2.2 mm) for Dinaric populations. The values for the needle length/width ratio were slightly lower than those reported in Algerian yew populations by Hamidouche-Si et al. [38] but still higher than those obtained for Macaronesian populations [37]. The data for this ratio in the continental group were very close to the values reported by Stefanović [39], indicating similarities in needle shape among the Balkan populations. Overall, our data for the continental group showed similarities with other research on Eastern European populations [39,40], while the Dinaric populations were closer to Western European and North African populations [34,35,36,37,38]. It is also worth noting that our results, like those from the rest of continental Europe, confirm the uniqueness of Macaronesian populations, which are characterised by much lower values of comparable traits and have been shown to represent a separate, relict lineage of common yew in Macaronesia [36,37].
In our research, the most variable traits were the positions of maximal needle width (PMNW) and needle area (NA), and these results are in agreement with previously published data on common yew [34,39]. Dinaric populations have demonstrated higher variability of needle traits than continental populations. This could partially be explained by environmental conditions, i.e., light availability. In the Dinaric region, yew populations grow under variable light conditions, in forest openings, intermixed within different forest ecosystems and in permanently shaded gorges. In contrast, continental populations grow exclusively within the montane beech belt [15], in deeper shade of the forest understory. The differences in light levels could have influenced the morphological variability of needles in the Dinaric populations, thus explaining increased variability, as reported by other authors [41,42]. On the other hand, continuous low-light conditions of shaded beech forests provided the continental populations with constant conditions, making the needle variability less significant and influencing more uniform needle size. The ability of species to adjust along the light gradient has previously been observed in shade-tolerant species, with morphological, anatomical and physiological adaptations of leaves [43]. In addition, sufficient light has been shown to be the most important factor in seedling survival for T. baccata [12]. Conifers in particular are characterised by shoot architectur plasticity [44], enabling them to modulate their morphology, particularly in the understory where light is usually the most limiting resource [41]. Such variability has been observed for Norway spruce (Picea abies (L.) Karst.) [45,46]; silver fir (Abies alba Mill.) [43,44,45]; European beech (Fagus sylvatica L.) [47,48,49], Europe’s most common shade-tolerant species; and the North American Pacific yew (T. brevifolia Nutt.) [50].
Although not part of this research, previous reports [35,40] have also linked the sex of yew trees with variability of needles, and moreover, the combined effect of sexual dimorphism and environmental factors has been shown to influence needle size and shape. However, in this research, bioclimatic variables have revealed no such connection, i.e., the climate did not significantly influence needle variability.
All seven researched populations have proven to be diverse at both population and regional levels, with significant differences in all traits. However, intra-population variability was responsible for the higher percentage of the total variation. These high levels of diversity on the local level are likely the result of geographical isolation and gradual differentiation between the populations. In addition, we observed a clear trend of similarity in the data between the populations of the two groups, Dinaric and continental. Considering the decline of T. baccata in Europe since the Tertiary [9], yew has survived only in stands with well-suited conditions, where genetic differentiation was not so much the result of survival of the fittest but probably the result of a genetic structure of each population. Therefore, in this case, natural selection has favoured diversity and enabled other neutral processes, including genetic drift, to possibly play a future role in pronouncing the differences between researched populations.
As the multivariate statistical analysis revealed, yew populations in the north-western part of the Balkan Peninsula have divided into two morphologically distinct groups corresponding to the two geographical regions of sampling. As only two populations have a low proportion of mixed origin, our results are in agreement with the previously published data on common yew genetic diversity in Europe [9]. The studied area in which yew populations were sampled has been shown to be a hotspot for yew genetic diversity, suggesting that Western and Eastern gene pools of European yew populations meet here [9], whose existence is a direct result of two allopatric refugia during the last Quaternary glaciations and the resulting adaptation to specific climate conditions. This is not surprising since this part of Europe has been shown to be one of the European biodiversity hotspots as a consequence of the admixture of divergent lineages that colonised the continent from different refugia [51]. The high degree of morphological variability reported confirms that the Northern Balkan region is one of the previously discovered biodiversity hotspots in Europe [9,52], which is partially the result of the shift from the sub-Mediterranean to continental climate.
A significant correlation was found between morphometric and geographical distance matrices, but no significant correlation between morphometric and climate data was noted. This indicates the existence of isolation by distance (IBD) in the researched populations, characterised by increasing genetic differentiation with increasing geographic distance between populations [53,54]. Under these conditions, limited gene flow and low population density contributed to the individual character of each population. In addition, the likely genetic similarity between geographically closer populations resulted in the detection of similar values for each trait, leading to the grouping of populations into two distinct groups. Similar observations were reported for another Tertiary relict, Juniperus excelsa M. Bieb., with authors reporting geographic isolation of small and fragmented populations in Eastern Mediterranean basin and Asia Minor as a probable cause of morphological differentiation [21,55].

5. Conclusions

Although restricted to small and isolated populations, common yew in north-western Balkans is morphologically highly diverse, both at the inter- and intrapopulation level. In the researched populations, the needle area and position of maximal needle width were the most diverse traits. The data obtained in this research showed there are two distinct population groups: the Dinaric and the continental. These population groups corresponded to two European gene pools, respectively. The existence of such diversity in a relatively small area supports the previously identified hybrid zone of the Northern Balkans, with this area being located at the point of contact between two Tertiary refugia.

Supplementary Materials

The following are available online at https://www.mdpi.com/article/10.3390/f13010078/s1, Table S1. Sample size (N), region, geographic coordinates, altitudes and bioclimatic variables for seven studied Taxus baccata populations. Bioclimatic variables: BIO1 (Annual Mean Temperature); BIO2 (Mean Diurnal Range (Mean of monthly (max temp—min temp)); BIO3 (Isothermality (BIO2/BIO7) (×100)); BIO4 (Temperature Seasonality (standard deviation ×100)); BIO5 (Max Temperature of Warmest Month); BIO6 (Min Temperature of Coldest Month); BIO7 (Temperature Annual Range (BIO5-BIO6)); BIO8 (Mean Temperature of Wettest Quarter); BIO9 (Mean Temperature of Driest Quarter); BIO10 (Mean Temperature of Warmest Quarter); BIO11 (Mean Temperature of Coldest Quarter); BIO12 (Annual Precipitation); BIO13 (Precipitation of Wettest Month); BIO14 (Precipitation of Driest Month); BIO15 (Precipitation Seasonality (Coefficient of Variation)); BIO16 (Precipitation of Wettest Quarter); BIO17 (Precipitation of Driest Quarter); BIO18 (Precipitation of Warmest Quarter); and BIO19 (Precipitation of Coldest Quarter). Populations: P01—Učka; P02—Senj; P03—Klek; P04—Bistra; P05—Horvatove stube; P06—Tisova peć; and P07—Strahinščica.

Author Contributions

Conceptualization: K.T., Z.L., Z.Š., J.M., M.I. and I.P.; Methodology, K.T., Z.L., Z.Š., J.M., M.I., A.V., J.V., I.Š. and I.P.; Formal analysis, Z.Š. and I.P.; Investigation, K.T., Z.L., J.M., A.V., J.V., I.Š., P.N. and I.P.; Writing—Original Draft Preparation, K.T. and I.P.; Writing—Review and Editing, Z.L., Z.Š., J.M., M.I., A.V., J.V., I.Š. and P.N.; Visualization, I.P. All authors have read and agreed to the published version of the manuscript.

Funding

This research was funded by University of Zagreb financial support.

Data Availability Statement

Not applicable.

Conflicts of Interest

The authors declare no conflict of interest. The funders had no role in the design of the study; in the collection, analyses, or interpretation of data; in the writing of the manuscript; or in the decision to publish the results.

References

  1. Farjon, A.; Filer, D. An Atlas of the World’s Conifers; Brill Academic Publication: Leiden, The Netherlands; Boston, MA, USA, 2013; p. 525. [Google Scholar]
  2. Gonzalez-Martinez, S.C.; Dubreuil, M.; Ribva, M.; Vendramin, G.G.; Sebastiani, F.; Mayol, M. Spatial genetic structure of Taxus baccata L. in the western Mediterranean Basin: Past and present limits to gene movement over a broad geographic scale. Mol. Phylogenet. Evol. 2010, 55, 805–815. [Google Scholar] [CrossRef] [PubMed]
  3. Thomas, P.A.; Polwart, A. Biological flora of the British Isles: Taxus baccata L. J. Ecol. 2003, 91, 489–524. [Google Scholar] [CrossRef]
  4. Benham, S.E.; Houston Durrant, T.; Caudullo, G.; de Rigo, D. Taxus baccata in Europe: Distribution, habitat, usage and threats. In European Atlas of Forest Tree Species; San-Miguel-Ayanz, J., de Rigo, D., Caudullo, G., Houston Durrant, T., Mauri, A., Eds.; Publications Office of the EU: Luxembourg, 2016; p. e015921. [Google Scholar]
  5. Pietzarka, U. Zur ökologischen Strategie der Eibe (Taxus baccata L.) Wachstums- und Verjüngungsdynamik. Ph.D. Thesis, Technisches Universität Dresden, Dresden, Germany, 2005. [Google Scholar]
  6. Hageneder, F. Yew; Reaktion Books: London, UK, 2013; p. 224. [Google Scholar]
  7. Barwise, Y.; Kumar, P. Designing vegetation barriers for urban air pollution abatement: A practical review for appropriate plant species selection. Clim. Atmos. Sci. 2020, 3, 19. [Google Scholar] [CrossRef] [Green Version]
  8. Hageneder, F. Appendix III: Important occurrences of European yew (Taxus baccata L.). In Yew: A History, 2nd ed.; the History Press Ltd.: Stroud, UK, 2011; p. 10. [Google Scholar]
  9. Mayol, M.; Riba, M.; Gonzalez-Martinez, S.C.; Bagnoli, F.; de Beaulieu, J.; Breganzo, E.; Burgarella, C.; Dubreuil, M.; Kraj-merova, D.; Paule, L.; et al. Adapting through glacial cycles: Insights from a long-lived tree (Taxus baccata). New Phytol. 2015, 208, 973–986. [Google Scholar] [CrossRef] [Green Version]
  10. Malik, S.; Cusidó, R.M.; Hossein Mirjalili, M.; Moyano, E.; Palazón, J.; Bonfill, M. Production of the anticancer drug taxol in Taxus baccata suspension cultures: A review. Proc. Biochem. 2011, 46, 23–34. [Google Scholar] [CrossRef]
  11. Stefanović, M.; Ristić, M.; Popović, Z.; Matić, R.; Nikolić, B.; Vidaković, V.; Oratov-Petković, D.; Bojović, S. Chemical composition and interpopulation variability of essential oils of Taxus baccata L. from Serbia. Chem. Biodivers. 2016, 13, 943–953. [Google Scholar] [CrossRef]
  12. Iszkuło, G. Success and failure of endangered tree species: Low temperatures and low light availability affect survival and growth of European yew (Taxus baccata L.) seedlings. Pol. J. Ecol. 2010, 58, 259–271. [Google Scholar]
  13. Iszkuło, G.; Didukh, Y.; Giertych, J.; Jasinska, A.K.; Sobierajska, K.; Szmyt, J. Weak competitive ability may explain decline of Taxus baccata. Ann. For. Sci. 2012, 69, 705–712. [Google Scholar] [CrossRef] [Green Version]
  14. Rivers, M.; Beech, E.; Bazos, I.; Bogunić, F.; Buira, A.; Caković, D.; Carapeto, A.; Carta, A.; Cornier, B.; Fenu, G.; et al. European Red List of Trees, 1st ed.; IUCN: Cambridge, UK; Brussels, Belgium, 2019; p. 72. [Google Scholar]
  15. Vukelić, J. Šumska Vegetacija Hrvatske, 1st ed.; University of Zagreb, Faculty of Forestry, Institute for Nature Protection: Zagreb, Croatia, 2012; pp. 191–193. [Google Scholar]
  16. Ramírez-Valiente, J.; Sánchez-Gómez, D.; Aranda, I.; Vallardes, F. Phenotypic plasticity and local adaptation in leaf ecophysiological traits of 13 contrasting cork oak populations under different water availabilities. Tree Phys. 2010, 30, 618–627. [Google Scholar] [CrossRef] [Green Version]
  17. Regent Instruments Inc. WinFolia TM; Version PRO 2005b; Regent Instruments Inc.: Quebec, QC, Canada, 2001.
  18. Sokal, R.R.; Rohlf, F.J. Biometry: The Principles and Practice of Statistics in Biological Research, 4th ed.; W.H. Freeman and Co.: New York, NY, USA, 2012; p. 937. [Google Scholar]
  19. StatSoft, Inc. STATISTICA (Data Analysis Software System); version 13; StatSoft, Inc.: Tulsa, OK, USA, 2018.
  20. McGarigal, K.; Cushman, S.; Stafford, S. Multivariate Statistics for Wildlife and Ecology Research; Springer: New York, NY, USA, 2000; p. 283. [Google Scholar]
  21. Douaihy, B.; Sobierajska, K.; Jasinska, A.K.; Boratynska, K.; Ok, T.; Romo, A.; Machon, N.; Didukh, Y.; Dagher-Kharrat, M.B.; Boratynski, A. Morphological versus molecular markers to describe variability in Juniperus excelsa subsp. excelsa (Cupressaceae). AoB Plants 2012, 2012, pls13. [Google Scholar] [CrossRef] [PubMed] [Green Version]
  22. Boratynski, A.; Jasinska, A.K.; Marcysiak, K.; Mazur, M.; Romo, A.M.; Boratynska, K.; Sobierajska, K.; Iszkuło, G. Morphological differentiation supports the genetic pattern of the geographic structure of Juniperus thurifera (Cupressaceae). Plant Syst. Evol. 2013, 299, 773–784. [Google Scholar] [CrossRef] [Green Version]
  23. Sobierajska, K.; Boratynska, K.; Jasinska, A.; Dering, M.; Ok, T.; Douaihy, B.; Dagher-Kharrat, M.B.; Romo, A.; Boratynski, A. Effect of the Aegean Sea barrier between Europe and Asia on differentiation in Juniperus drupacea (Cupressaceae). Bot. J. Linn. Soc. 2016, 180, 365–385. [Google Scholar] [CrossRef] [Green Version]
  24. Poljak, I.; Idžojtić, M.; Šapić, I.; Korijan, P.; Vukelić, J. Diversity and structure of Croatian continental and Alpine-Dinaric populations of grey alder (Alnus incana /L./ Moench subsp. incana); Isolation by distance and environment explains phenotypic divergence. Šumar. List 2018, 142, 19–31. [Google Scholar] [CrossRef]
  25. Koutecký, P. MorphoTools: A set of R functions for morphometric analysis. Plant Syst. Evol. 2015, 301, 1115–1121. [Google Scholar] [CrossRef]
  26. R Core Team. R: A Language and Environment for Statistical Computing; R Foundation for Statistical Computing: Vienna, Austria, 2016. Available online: http://www.R-project.org/ (accessed on 25 October 2021).
  27. Hijmans, R.J.; Cameron, S.E.; Parra, J.L.; Jones, P.G.; Jarvis, A. Very high resolution interpolated climate surfaces for global land areas. Int. J. Climatol. 2005, 25, 1965–1978. [Google Scholar] [CrossRef]
  28. Fick, S.E.; Hijmans, R.J. WorldClim 2: New 1km spatial resolution climate surfaces for global land areas. Int. J. Climatol. 2017, 37, 4302–4315. [Google Scholar] [CrossRef]
  29. Mantel, N. The detection of disease clustering and a generalized regression approach. Cancer Res. 1967, 27, 209–220. [Google Scholar]
  30. Smouse, P.E.; Long, J.C.; Sokal, R. Multiple regression and correlation extensions of the Mantel test of matrix correspondence. Syst. Zool. 1986, 35, 627–632. [Google Scholar] [CrossRef]
  31. Manly, B.F.J. Randomization, Bootstrap and Monte Carlo Methods in Biology, 3rd ed.; Chapman & Hall/CRC, Taylor & Francis Group: Boca Raton, FL, USA, 2007; p. 480. [Google Scholar]
  32. Rohlf, F.J. NTSYS-pc: Numerical Taxonomy and Multivariate Analysis System; Version 2.2; Applied Biostatistics Inc.: New York, NY, USA, 2005; p. 44. [Google Scholar]
  33. Dempsey, D.; O’Flaherty, C.; Hook, I. Taxus Species—Morphological and chemical variations in needles and seeds. In Proceedings of the 4th International Conifer Conference, Wye, UK, 30 September 2003; Mill, R.R., Ed.; ISHS: Leuven, Belgium, 2003. [Google Scholar]
  34. Zarek, M. Variability of morphological features of needles, shoots and seeds of Taxus baccata L. in nature reservations of Southern Poland. EJPAU 2007, 10, 18. [Google Scholar]
  35. Iszkuło, G.; Jasinska, A.K.; Giertych, M.J.; Boratynski, A. Do secondary sexual dimorphism and female intolerance to drought influence the sex ratio and extinction risk of Taxus baccata? Plant Ecol. 2009, 200, 229–240. [Google Scholar] [CrossRef]
  36. Schirone, B.; Caetano Ferreira, R.; Vessella, F.; Schirone, A.; Piredda, R.; Cosimosi Simeone, M. Taxus baccata in the Azores: A relict form at risk of imminent exticinction. Biodivers. Conserv. 2010, 19, 1547–1565. [Google Scholar] [CrossRef]
  37. Vessella, F.; Simeone, M.C.; Fernandes, F.M.; Schirone, A.; Pires Gomes, M.; Schirone, B. Morphological and molecular data from Madeira support the persistence of an ancient lineage of Taxus baccata L. in Macaronesia and call for immediate conservation actions. Caryologia 2013, 66, 162–177. [Google Scholar] [CrossRef]
  38. Hamidouche-Si, M.C.; Bouhamed, A.; Vessella, F.; Krouchi, F.; Derridj, A. Geographic distribution and morphological variation of Taxus baccata in Algeria. Der Eibenfreund 2014, 20, 39–53. [Google Scholar]
  39. Stefanović, M. Varijabilnost terpenskog sastava i morfoloških karakteristika četina Taxus baccata L. u Srbiji. Ph.D. Thesis, University of Belgrade, Belgrade, Serbia, 2015. [Google Scholar]
  40. Stefanović, M.; Nikolić, B.; Matić, R.; Popović, Z.; Vidaković, V.; Bojović, S. Exploration of sexual dimorphism of Taxus baccata L. needles in natural populations. Trees 2017, 31, 1697–1710. [Google Scholar] [CrossRef]
  41. Iszkuło, G.; Boratynsky, A. Analysis of the relationship between photosynthetic photon flux density and natural Taxus baccata seedlings occurrence. Acta Oecol. 2006, 29, 78–84. [Google Scholar] [CrossRef]
  42. Iszkuło, G.; Lewandowski, A.; Jasinska, A.K.; Dering, M. Light limitation of growth in 10-year-old seedling of Taxus baccata L. (European yew). Pol. J. Ecol. 2007, 55, 827–831. [Google Scholar]
  43. Robakowski, P.; Wyka, T.; Samardakiewicz, S.; Kierzkowski, D. Growth, photosynthesis, and needle structure of silver fir (Abies alba Mill.) seedlings under different canopies. For. Ecol. Manag. 2004, 201, 211–227. [Google Scholar] [CrossRef]
  44. Cescatti, A.; Zorer, R. Structural acclimation and radiation regime of silver fir (Abies alba Mill.) shoots along a light gradient. Plant Cell Environ. 2003, 26, 429–442. [Google Scholar] [CrossRef]
  45. Grassi, G.; Bagnaresi, U. Foliar morphological and physiological plasticity in Picea abies and Abies alba saplings along a natural light gradient. Tree Physiol. 2000, 21, 959–967. [Google Scholar] [CrossRef] [Green Version]
  46. Niinemets, Ü. Acclimation to low irradiance in Picea abies: Influences of past and present light climate on foliage structure and function. Tree Physiol. 1996, 17, 723–732. [Google Scholar] [CrossRef] [Green Version]
  47. Petritan, A.M.; von Lupke, B.; Petritan, I.C. Influence of light availability on growth, leaf morphology and plant architecture of beech (Fagus sylvatica L.), maple (Acer pseudoplatanus L.) and ash (Fraxinus excelsior L.) saplings. Eur. J. For. Res. 2009, 128, 61–74. [Google Scholar] [CrossRef] [Green Version]
  48. Adamidis, G.C.; Varsamis, G.; Tsiripidis, I.; Dimitrakopoulos, P.G.; Papageorgoiu, A.C. Patterns of leaf morphological traits of beech (Fagus sylvatica L.) along an altitudinal gradient. Forests 2021, 12, 14. [Google Scholar] [CrossRef]
  49. Boutsios, S.; Vidalis, A.; Adamidis, G.C.; Hatziskakis, S.; Varsamis, G.; Tsiripidis, I.; Karanikola, P.; Papageorgious, A.C. Diversity in shade and light leaf morphology in beech populations of South Rodopi mountains. In Proceedings of the National Academy of Sciences, India Section B: Biological Sciences; Ghosh, A., Ed.; Springer: Berlin, Germany, 2021; Volume 91, pp. 53–61. [Google Scholar] [CrossRef]
  50. Mitchell, A.K. Acclimation of Pacific yew (Taxus brevifolia) foliage to sun and shade. Tree Physiol. 1997, 18, 749–757. [Google Scholar] [CrossRef] [Green Version]
  51. Petit, R.J.; Aguinagalde, I.; de Beaulieu, J.-L.; Bittkau, C.; Brewer, S.; Cheddadi, R.; Ennos, R.; Fineschi, S.; Grivet, D.; Lascoux, M.; et al. Glacial refugia: Hotspots but not melting pots of genetic diversity. Science 2003, 300, 1563–1565. [Google Scholar] [CrossRef] [Green Version]
  52. Hewitt, G.M. Post-glacial re-colonization of European biota. Biol. J. Linn. Soc. 1999, 68, 87–112. [Google Scholar] [CrossRef]
  53. Wright, S. Isolation by distance. Genetics 1943, 28, 114–138. [Google Scholar] [CrossRef]
  54. van Strien, M.J.; Holderegger, R.; Van Heck, H.J. Isolation-by-distance in landscapes: Considerations for landscape genetics. Heredity 2015, 11, 27–37. [Google Scholar] [CrossRef] [Green Version]
  55. Mazur, M.; Boratynska, K.; Marcysiak, K.; Didukh, Y.; Romo, A.; Kosinski, P.; Boratynski, A. Low level of inter-populational differentiation in Juniperus excelsa M. Bieb. (Cupressaceae). Dendrobiology 2004, 52, 39–46. [Google Scholar]
Figure 1. Results of the multivariate statistical methods and locations of the seven sampled Taxus baccata populations, based on eight morphological needle traits. (A) Geographical distribution of two groups of populations detected from K-means clustering method (the proportions of the membership of each population in each of the defined clusters are colour-coded: cluster A–green, cluster B–blue); (B) tree diagram of researched populations; and (C) Barplot with posterior probabilities of classification of each individual into each group from the results of the classification analysis of discrimination. Populations: P01—Učka; P02—Senj; P03—Klek; P04—Bistra; P05—Horvatove stube; P06—Tisova peć; and P07—Strahinščica.
Forests 13 00078 g001
Figure 2. Measured needle morphological traits: needle length measured from the base of the needle up to the tip, along the central vein (NL); maximum needle width (MNW); needle length, measured from base to the widest point of needle (PMNW); needle width at 50% of needle length (NW50); needle width at 90% of needle length (NW90); angle enclosed by the main vein and line between needle base and point at 10% of needle length (NA10); and angle enclosed by the main vein and line between needle base and point at 25% of needle length (NA25). Needles from the middle of the two-year-old shoots were selected for research and are marked with a rectangle.
Forests 13 00078 g002
Figure 3. Analysis of discrimination for seven Taxus baccata populations based on six morphological traits that were the most useful for maximum discrimination between studied populations. Each individual tree is indicated by a small sign, while the population barycenters are represented by larger ones. Colour of the signs is related to geographical region: green colour—Dinaric region; blue colour—continental region. Morphometric traits: needle area (NA); maximum needle width (MNW); needle length, measured from base to the widest point of needle (PMNW); needle width at 90% of needle length (NW90); angle enclosed by the main vein and line between needle base and point on the 10% of needle length (NA10); and angle enclosed by the main vein and line between needle base and point on the 25% of needle length (NA25).
Forests 13 00078 g003
Table 1. Results of the descriptive statistical analysis for studied populations and morphometric traits. Morphometric traits analysed: needle area (NA); needle length measured from the base of the needle up to the tip, along the central vein (NL); maximum needle width (MNW); needle length, measured from base to the widest point of needle (PMNW); needle width at 50% (NW50) and 90% (NW90) of needle length; angle enclosed by the main vein and line between needle base and point on the 10% (NA10) and 25% (NA25) of needle length; for needle shape, needle length/maximum needle width ratio (NL/MNW). Descriptive parameters: M—arithmetic mean; CV—coefficient of variation (%). Populations: P01—Učka; P02—Senj; P03—Klek; P04—Bistra; P05—Horvatove stube; P06—Tisova peć; and P07—Strahinščica.
TraitDescriptive ParametersPopulationRegionTotal
P01P02P03P04P05P06P07DinaricContinental
NA (mm2)M0.290.320.390.460.410.450.510.330.460.40
CV25.1431.4430.5224.8428.6222.8421.6532.6225.5231.95
NL (mm)M15.6217.7920.4923.4122.7724.3924.1617.9723.6821.23
CV18.1622.5621.8915.4521.3217.3218.2924.1518.3524.41
MNW (mm)M2.162.092.252.612.232.292.662.162.452.33
CV10.2713.6912.0322.2217.9316.7217.1312.4220.4118.90
PMNW (mm)M5.456.066.108.417.067.607.265.877.586.85
CV30.9938.3243.5132.3140.3940.0540.7538.7638.7540.96
NW50 (mm)M2.061.962.092.442.052.092.452.042.262.16
CV10.4813.5012.4122.7317.7316.7818.1112.4421.0118.93
NW90 (mm)M1.301.301.411.571.391.371.621.331.491.42
CV15.8417.4212.3817.0913.8812.2010.5815.7015.5616.54
NA10 (°)M25.7624.0023.5319.7219.8119.1221.9424.4320.1521.98
CV13.6515.4015.5112.0614.3215.0611.8515.3314.3217.77
NA25 (°)M13.8411.9611.3010.729.959.3511.0212.3710.2611.16
CV17.1419.8619.6920.9922.5420.2016.8020.7021.1222.98
NL/MNWM7.268.539.139.2310.4110.869.188.319.929.23
CV17.1817.6818.6720.2122.7720.6117.1720.3221.8123.07
Table 2. Results of the hierarchical analysis of variance. Morphometric traits analysed: needle area (NA); needle length measured from the base of the needle up to the tip, along the central vein (NL); maximum needle width (MNW); needle length, measured from base to the widest point of needle (PMNW); needle width at 50% (NW50) and 90% (NW90) of needle length; angle enclosed by the main vein and line between needle base and point on the 10% (NA10) and 25% (NA25) of needle length; for needle shape, needle length/maximum needle width ratio (NL/MNW).
TraitVariance Componentdf% VariationFp
NABetween regions134.8112.43<0.05
Among populations within regions58.234.72<0.01
Within populations9832.3540.44<0.01
Error 24.61
NLBetween regions144.2220.74<0.01
Among populations within regions55.693.85<0.01
Within populations9829.2343.04<0.01
Error 20.86
MNWBetween regions114.464.280.09
Among populations within regions513.438.91<0.01
Within populations9823.8515.82<0.01
Error 48.26
PMNWBetween regions116.1118.97<0.01
Among populations within regions52.143.31<0.01
Within populations9811.605.96<0.01
Error 70.15
NW50Between regions18.432.730.16
Among populations within regions515.009.65<0.01
Within populations9824.2614.92<0.01
Error 52.31
NW90Between regions114.323.690.11
Among populations within regions516.319.36<0.01
Within populations9827.9021.18<0.01
Error 41.47
NA10Between regions143.8821.33<0.01
Among populations within regions55.413.72<0.01
Within populations9829.0941.35<0.01
Error 21.62
NA25Between regions124.947.36<0.05
Among populations within regions511.366.42<0.01
Within populations9830.3028.22<0.01
Error 33.40
NL/MNWBetween regions120.607.11<0.05
Among populations within regions512.856.24<0.01
Within populations9835.7835.89<0.01
Error 30.77
Publisher’s Note: MDPI stays neutral with regard to jurisdictional claims in published maps and institutional affiliations.

