
Species-Specific Effects of Groundwater Level Alteration on Climate Sensitivity of Floodplain Trees
by

Martin Šenfeldr
1,*, 
Pavel Horák
1,
Jakub Kvasnica
1,
Martin Šrámek
1,
Hana Hornová
2 and
Petr Maděra
1 1
Department of Forest Botany, Dendrology and Geobiocoenology, Faculty of Forestry and Wood Technology, Mendel University in Brno, 61300 Brno, Czech Republic
2
Czech Hydrometeorological Institute, 61300 Brno, Czech Republic
*
Author to whom correspondence should be addressed.
Forests 2021, 12(9), 1178; https://doi.org/10.3390/f12091178
Submission received: 16 July 2021
/
Revised: 26 August 2021
/
Accepted: 26 August 2021
/
Published: 31 August 2021
(This article belongs to the Section Forest Ecology and Management)
Abstract
:European floodplain forest is facing increasingly frequent and severe drought events related with ongoing climate change. Moreover, this ecosystem type was frequently affected by river regulation, leading to groundwater table lowering; however, river revitalization has, in some locations, achieved some restoration of groundwater levels. In this study, we investigated the growth–climate sensitivity and growth modulation after groundwater-level manipulation for Fraxinus angustifolia Vahl. and Quercus robur L. in one of the most important floodplain forest complexes in Central Europe. We constructed three different types of tree ring chronologies to reflect the high frequency variability, medium-low frequency variability, and basal area increment. We found F. angustifolia to be more sensitive than Q. robur to both drought and groundwater level fluctuations. Moreover, F. angustifolia showed more pronounced short-term and long-term growth decreases after artificial ground water level alteration than did Q. robur. We also found that the groundwater level increase due to river revitalization reduced the climate sensitivity for both F. angustifolia and Q. robur. The decrease in climate sensitivity associated with revitalization was more pronounced for F. angustifolia which, moreover, showed a greater basal growth after river revitalization. Our results suggest that F. angustifolia will be more threatened than Q. robur by the diminution in groundwater availability and increase in drought with ongoing climate change. They also show that river revitalization can be a suitable management tool to help the adaptation to climate change.
1. Introduction
Temperate floodplain forest is among the most rapidly disappearing types of ecosystems [1,2]. It is important because of its high level of productivity and biodiversity [3,4,5,6] and the ecosystem services [7,8] it provides. These forests have been impacted by anthropogenic fragmentation, changes in species composition, and river regulation with an associated lowering of water tables [9,10,11,12]. They are also facing climate change [13], with related shifts in river runoff regimes observed in a widening area of Central Europe [14], resulting in more frequent droughts during the growing season [15]. The history of other human impacts, together with ongoing climate change, may lead to substantial ecological consequences, including floodplain forest tree dieback and an increased sensitivity to hydroclimatic events [16]. As a management response, river revitalization efforts have led to increased groundwater table levels [17]. However, there is still a limited number of studies focusing on the growth response of floodplain trees to both negative and positive human-induced changes in hydroclimatic variables [18,19], as well as species-specific differences in the tree hydroclimatic sensitivity.
Tree ring width and basal area increment assessment serves as a proxy for the detailed estimation of biomass growth [20,21] and can be studied retrospectively by dendrochronological methods. The detailed analysis of tree ring widths provides information about hydroclimatic events and enables detection of the main growth-limiting factors [22]. In general, floodplain trees are well-adapted to high groundwater levels but can be limited by a lack of moisture in periods of very low river flow during drought events [23]. On the other hand, permanent soil water saturation and consequently low aeration of the soil in conditions of high groundwater levels limits the physiological processes and tree growth [24]. The morphological and physiological adaptations play important roles for the survival and growth of floodplain trees. Due to species-specific adaptation, the floodplain trees show different abilities to survive both long-term flooding and high-severity drought [15,25]. Tree ring width chronologies from areas with high groundwater levels usually show weak climatic signals but respond sensitively to fluctuations in the water table level [26]. However, different tree species within the same forest ecosystem may have contrasting growth responses to changes in the water level and climate variations due to differing physiology [27], rooting depth [28], or other differences in their ecological niches. In floodplain forests in Europe, oaks (genus Quercus) and ash (genus Fraxinus) are not only important in terms of forest products but also in structuring the forest communities in which they occur [9]. Oaks are especially widely studied species due to their longevity, widespread common occurrence, climate sensitivity, and timber use [29,30,31]. Several studies regarding the responses of Quercus robur L. to the climate in floodplain areas in Europe have highlighted particular dendroclimatic patterns [16,32]. These have shown that Quercus robur tree ring chronologies correlate positively with water availability in terms of precipitation, drought indices, and water level from the spring to summer but with site-specific differences in these correlations. These studies also show a temperature signal, but it is more unstable, and the temperature response can be either negative or positive, depending on the site [16,33]. There are fewer studies of ash in European floodplains, and these predominantly focus on Fraxinus excelsior L. They show a high sensitivity to drought-related indices [34,35,36]. While Quercus robur grows at diverse site conditions, with an associated better adaptation to lowering water availability, Fraxinus angustifolia grows predominantly at sites with easily available water [37]. Studies focused specifically on Fraxinus angustifolia Vahl. growth response, as well as in a comparison with Q. robur, are rare and originated predominantly from primeval forests in Southeastern Europe [38].
Given that floodplain forests face not only a broad climate change but, also, direct anthropogenic manipulations of river levels, there is a need to examine the growth responses to these different factors and how they interact with each other. In particular, information on responses of floodplain trees to both rapid artificial water level decreases (river regulation) and increases (river revitalization) is needed.
In this study, we compared the climate–growth relationships for the two species at two floodplain forests in the Czech Republic that differ in terms of their groundwater level fluctuation. One is currently characterized by a relatively high-water level, but it was affected by a rapid water level decrease due to river regulation in the 1970s, followed by a rapid increase to approximately the previous level due to river revitalization in the 1990s (site KO). The other is characterized by a lower groundwater level (site SO), which has gradually decreased and without any revitalization occurring there over time. Our goals were to: (1) compare growth climate sensitivity between species (Quercus robur and Fraxinus angustifolia) and sites with contrasting water levels and, also, to (2) compare both the short-term and long-term growth responses to river regulation and revitalization between these species and sites. We hypothesized that: (H1) Fraxinus angustifolia would show higher sensitivity than Quercus robur to hydroclimatic variables due to its greater requirements for soil moisture; (H2) both species would show stronger climate sensitivity at the site with lower ground water level due to their growth at more limited conditions, and (H3) Fraxinus angustifolia would display a stronger growth trend modulation in response to river regulation and revitalization due to its expected higher sensitivity to water availability.
2. Material and Methods
2.1. Study Area and Sample Collection
This study was carried out in the floodplain forests of the Thaya River near its confluence with the Morava River in the Czech Republic (Central Europe) (Figure 1). Our study area represents one of the best-preserved floodplain forest ecosystems in Central Europe [39] and is located within the Lower Morava UNESCO Biosphere Reserve established in 2003 [40]. The average elevation of our study site is 160 m a.s.l. The long-term average annual precipitation is around 550 mm and mean annual temperature is 9.3 °C [41]. The area is located within the alluvium of the Thaya river, where most subsoils are Pleistocene fluvial sandy sediments and sands with Holocene layers of alluvial clays [42]. The predominant soil types are classified as eutric humic fluvisol, haplic fluvisol, and eutric fluvisol, according to the FAO 2014 classification with a minimum soil depth of 60 cm [43]. The most common tree species in the area are pedunculate oak (Quercus robur) and narrow-leaved ash (Fraxinus angustifolia). Other associated tree species include hornbeam (Carpinus betulus L.), field maple (Acer campestre L.), small-leaved linden (Tilia cordata Mill.), European white elm (Ulmus laevis Pall.), field elm (U. minor Pall.), black poplar (Populus nigra L.), white poplar (P. alba L.), and willow (Salix alba L.). Non-native commercial tree species are also represented to a small extent, comprising Populus × canadensis Moench. and Juglans nigra L. [9].
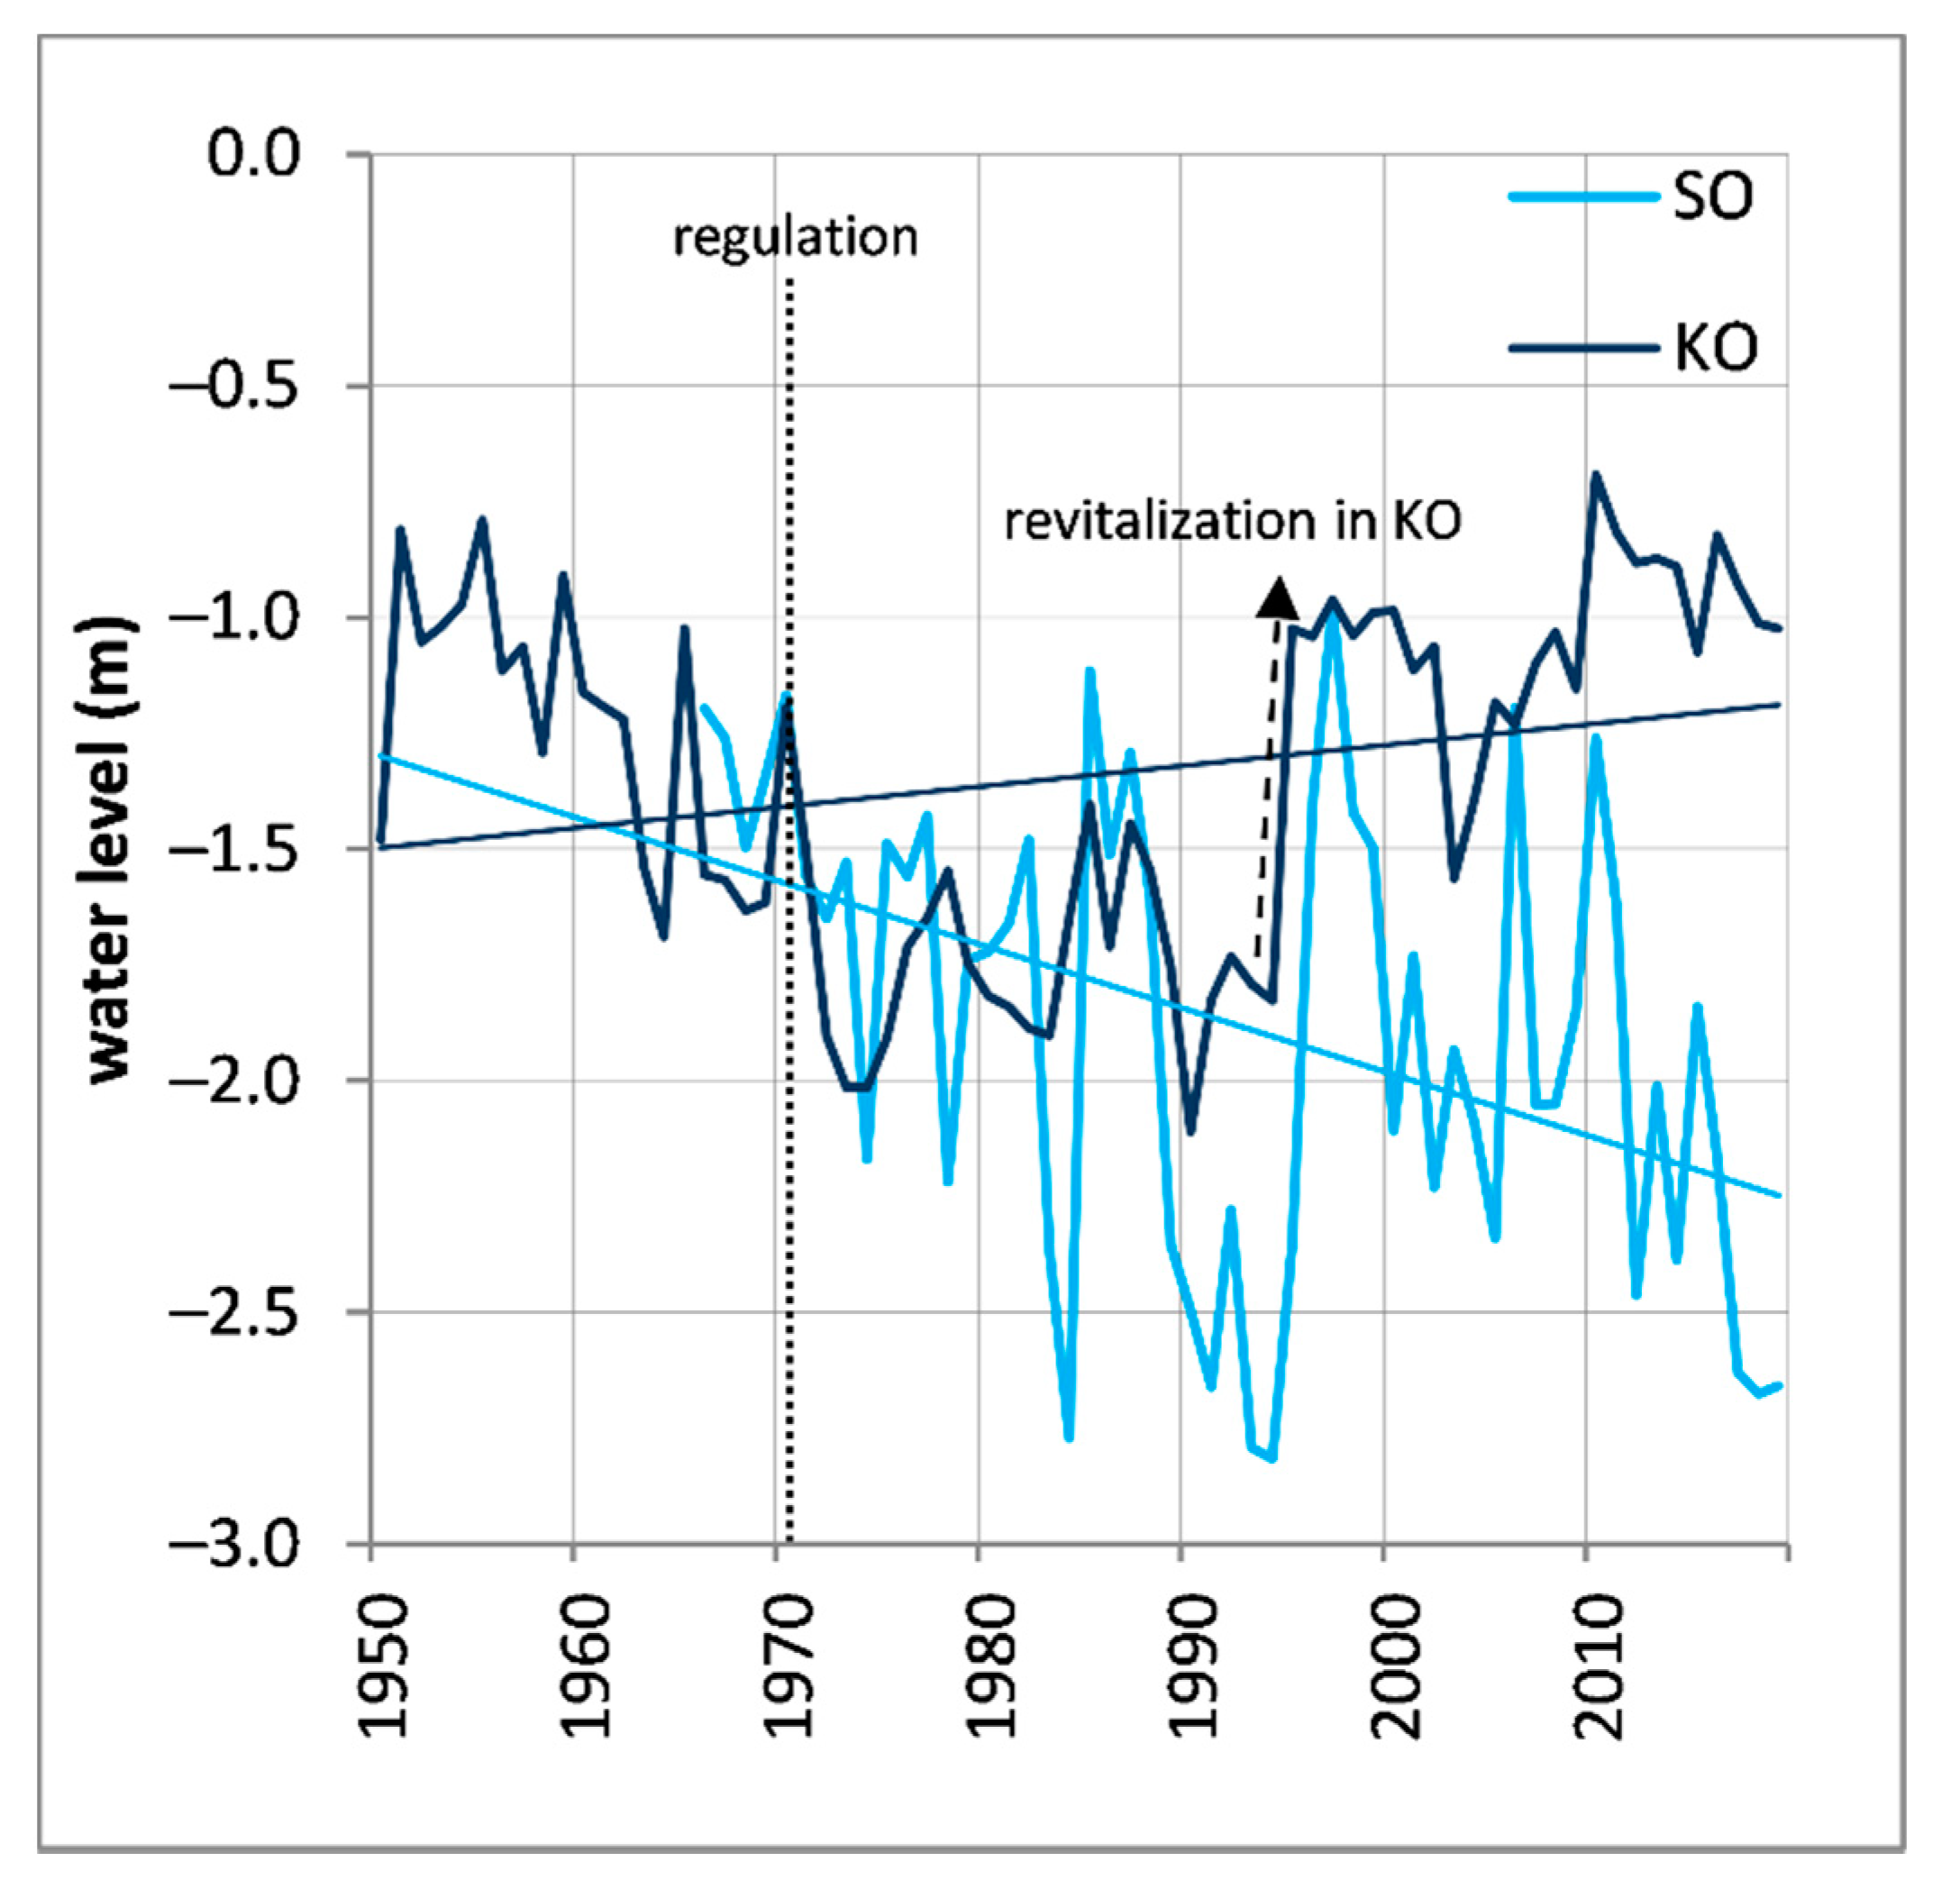
The regulation of the Thaya River and construction of three artificial water reservoirs above the studied area had the direct anthropogenic impacts on this floodplain ecosystem. After the regulation was completed in 1972, the groundwater table, rapidly decreased by approximately 1 m [9], and flooding occurred only very rarely. Since 1993, the revitalization was initiated using a system of channels and sluices, leading to an increase in the groundwater table [12] in selected parts of the Thaya River floodplain forest ecosystem (Figure 2).
Within this study area, we sought to answer our research questions by collecting data at two sites differing in their past ground water level fluctuation. Site 1—Kančí obora (henceforth referred to as “KO”) is located approximately 200 m from the Thaya riverbed (Figure 1). This site was characterized by the rapid groundwater level decrease between in the early 1970s due to regulation, but after 1993, the groundwater table rose to approximately its previous level due to revitalization. Site 2—Soutok (henceforth designated as “SO”) is located approximately 1200 m from the riverbed and is characterized by a gradual decrease in its groundwater level since early 1970s. No revitalization has been achieved at this site. Currently, the groundwater level at SO is 1.7 m lower than that of KO (Figure 2). At each site, we sampled the dominant and codominant Q. robur (further abbreviated as QURO) and F. angustifolia (further abbreviated as FRAN) trees at breast height using a Pressler borer. Two cores per tree were extracted. In total, 163 trees were cored (Table 1) near the groundwater level measuring stations with the maximum distance of approximately 200 m from these stations. The cores were mounted, air-dried, and smoothed using progressively finer sandpaper to increase the visibility of the ring boundaries. The tree ring widths were measured using a timetable dendrochronological measuring device and PAST5 software (VIAS, 2005) under a stereoscopic microscope. The mean tree ring width series of the cores were used in subsequent analyses after cross-dating.
2.2. Growth Climate Sensitivity
Before the analysis of climate sensitivity using a growth–climate response analysis, the age trend was removed from the TRW series, and the detrended series were averaged to obtain robust growth information for a given site. We standardized the TRW data using smoothing splines with 50% frequency cut-off at a wavelength of 30 years [44]. The resulting tree ring indices (RWI30) free of the age trend were computed as ratios between observed TRW and TRW modeled by spline curves. Species-specific site chronologies were created by the robust averaging of individual detrended series (“standard chronologies” [45]). R package dplR was used for detrending and chronology building [46]. We computed bootstrapped correlations between monthly resolved climate data and the standard tree ring chronologies (RWI30) over the period of their common overlap. Monthly resolved temperature and precipitation measurements for the years 1920–2019 were obtained from the Lednice Meteorological Station (48.7925000 N, 16.7988800 E; 177 m a.s.l.). This station is located 4 km and 16 km from the KO and SO sites, respectively. From the meteorological station data, we calculated the standardized precipitation evapotranspiration index (SPEI, Figure S1 in the Supplementary Materials). SPEI is a drought index based on differences between the monthly precipitation and monthly potential evapotranspiration over a range of predefined time periods (e.g., three months SPEI was calculated based on the current month and previous two months data). SPEI standardizes the values over the whole period to identify periods with extremely low or high intensities of drought [47,48]. Monthly resolved groundwater-level data were obtained for each site (KO: 1949–2019 and SO: 1966–2019; Figure 2) from the groundwater-level measuring stations of the Czech Hydrometeorological Institute (Brno).
We computed bootstrapped correlations between the monthly resolved climate data (precipitation, temperature, SPEI3, and groundwater level) and the standard tree ring chronologies (RWI30) over the period of their overlap. These correlations were calculated from the preceding June to the current September, i.e., during the year of tree ring formation. To assess whether the correlation was stable over time or was influenced by time-specific river manipulations, we calculated 25-year-long moving correlations overlapping by one year, taking into consideration only those variables that strongly correlated with the RWI30 chronologies.
2.3. Growth Trends and Basal Increment Area
We used two different tree growth proxies, i.e., detrended ring-width indices (RWI100) and basal area increments (BAI) for the evaluation of growth trend changes after regulation and revitalization. BAI better represents the actual growth due to the successive narrowing of tree rings with increasing stem size in spite of increasing the wood production [21].
First, we standardized the TRW data using smoothing splines with a 50% frequency cut-off at a wavelength of 100 years as the curves representing the trend component in our data [44]. Species-specific site standard chronologies RWI100 were created by the robust averaging of individual detrended series. These chronologies (RWI100) reflect medium-to-low frequency signals in tree ring series [53]. Further, we computed the linear trend slopes and their significances by fitting trend lines to RWI100 chronologies. Linear trend lines were computed for both the whole period of analysis (1920–2019) and for the recent period of anticipated growth reduction after river regulation and increasing drought frequency due to climate change (1972–2019).
Basal area increments (BAI) were calculated using ring width measurements and diameter at breast height (DBH) for each single series. The BAI chronologies were then created by the robust averaging of each single series.
3. Results
3.1. Growth Climate Sensitivity
The detailed characteristics of the standard chronologies are listed in Table 1. All sites and species exhibited high values of inter-series correlation to result in high expressed population signal values (0.92–0.97).
3.1.1. Species-Specific Growth Climate Sensitivity
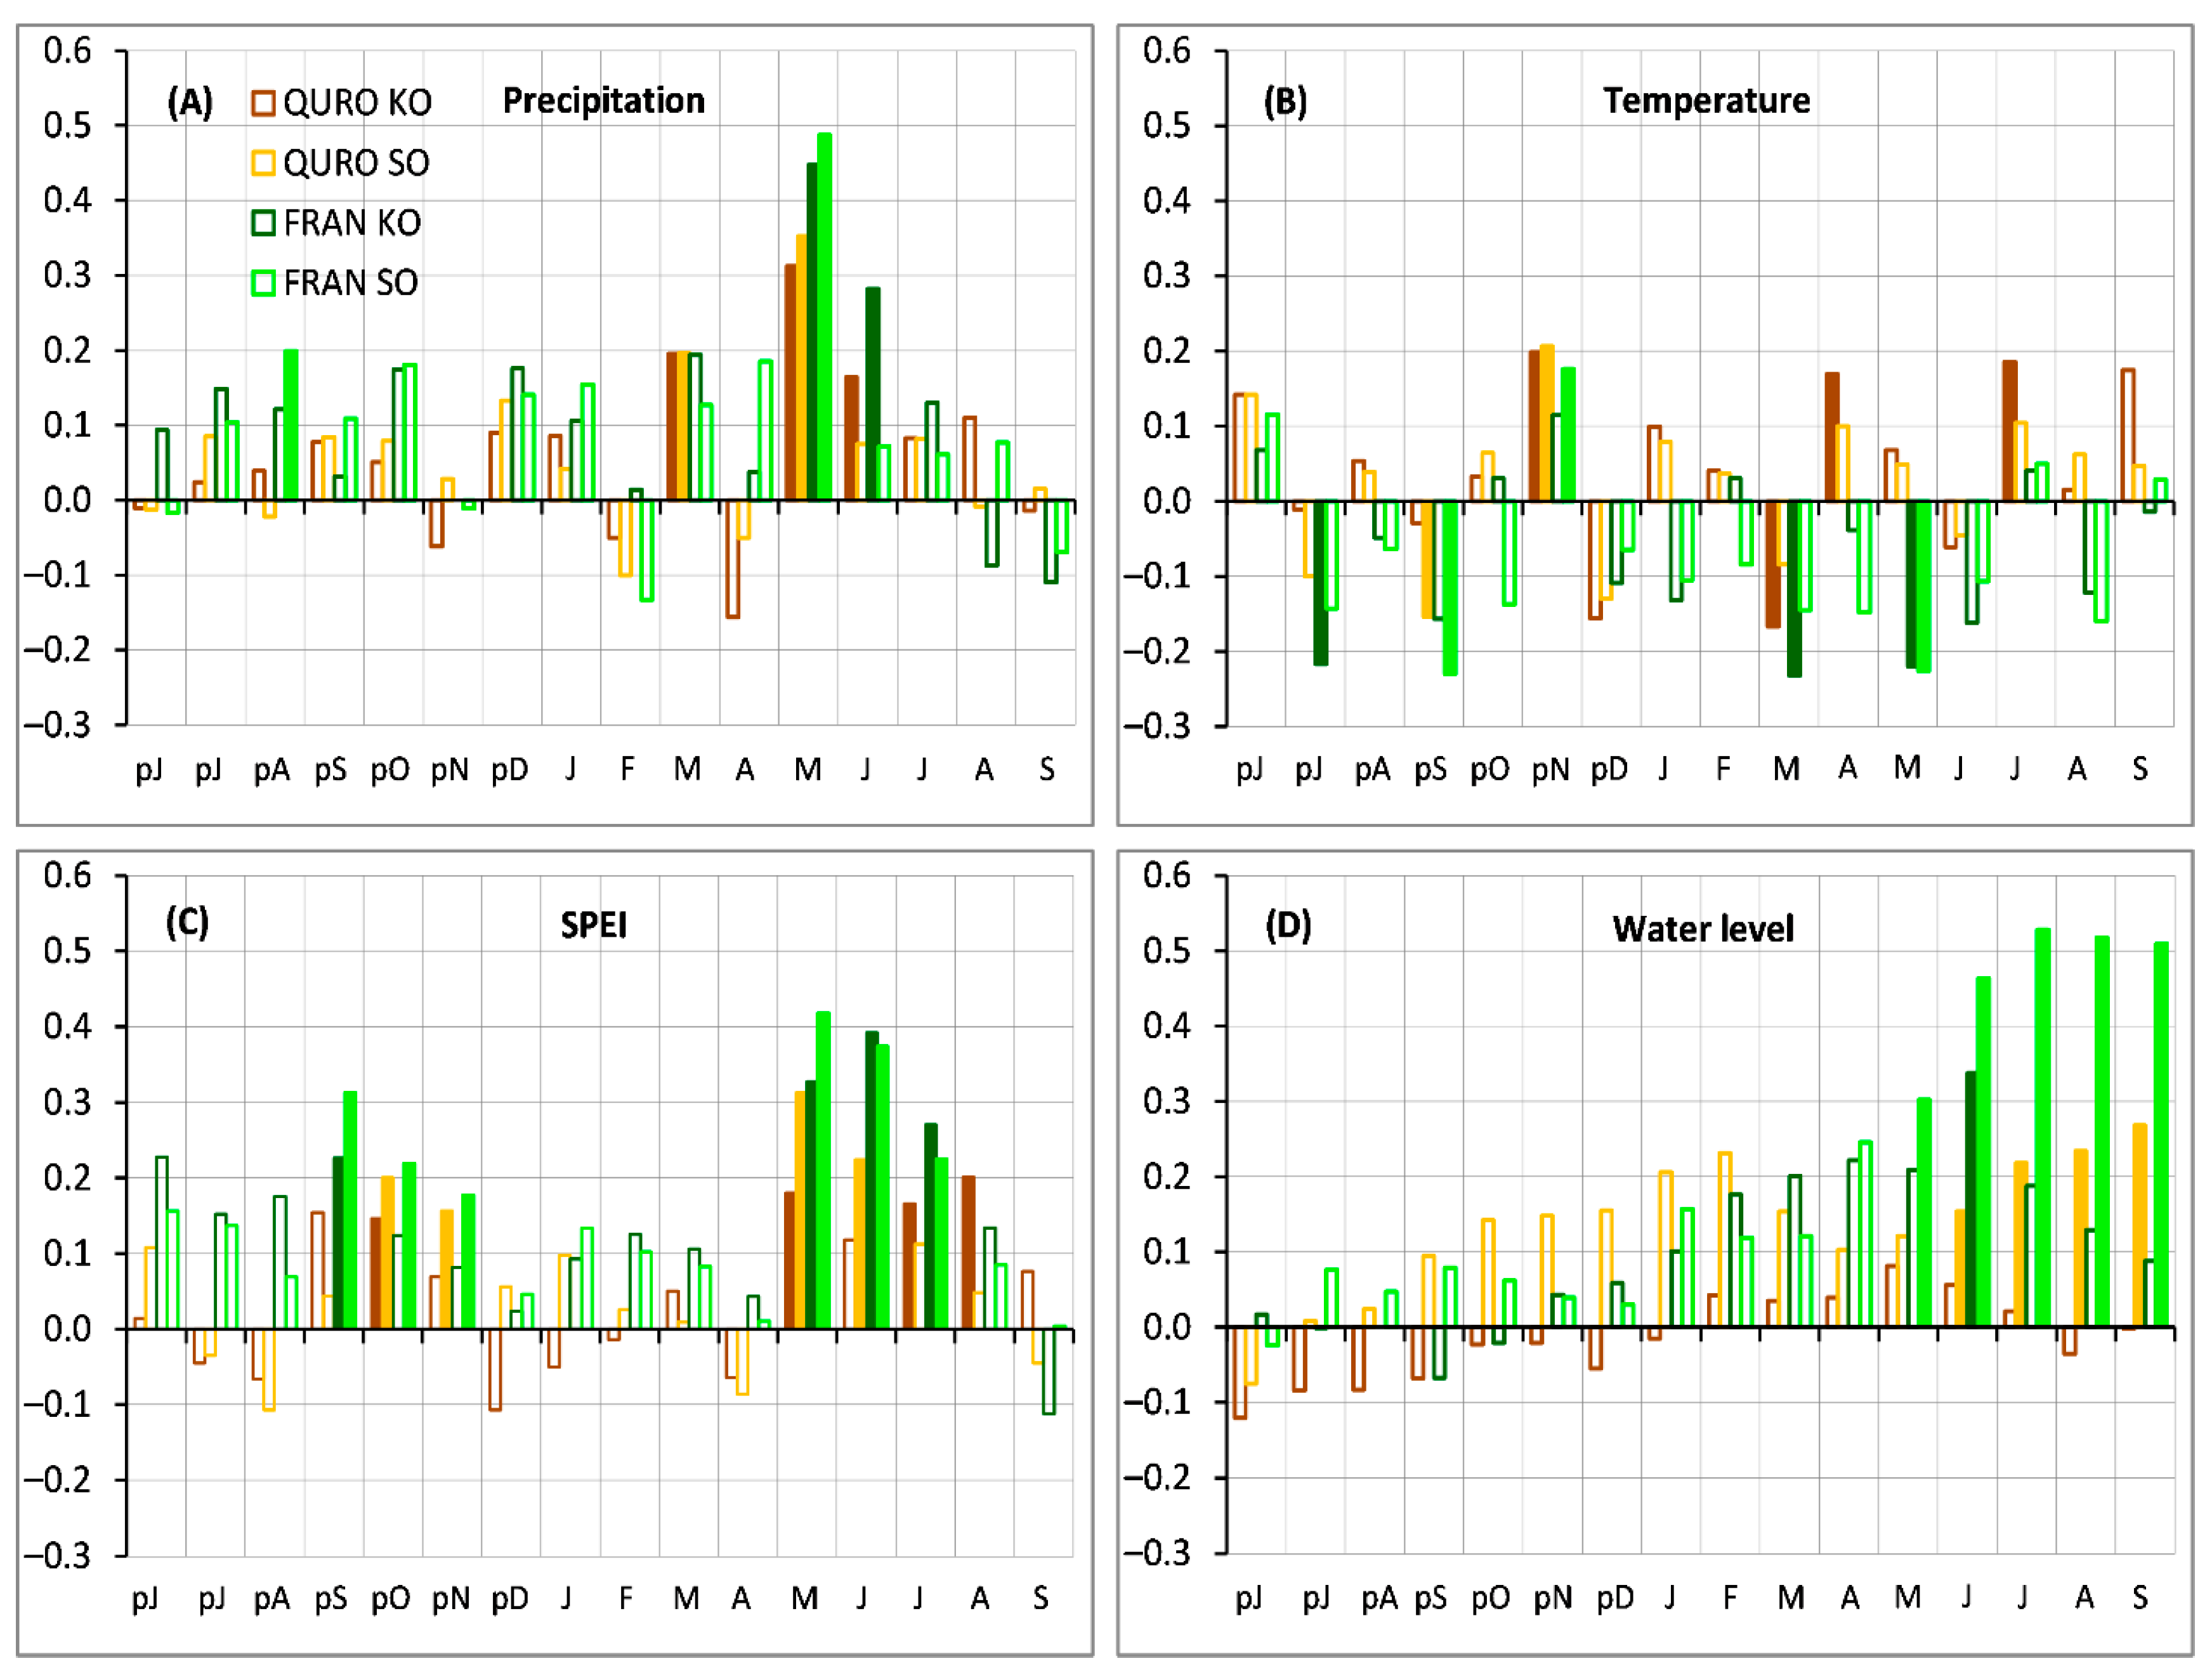
Regardless of the site, we found species-specific differences in the sensitivity. The FRAN showed a stronger sensitivity to precipitation, SPEI, and groundwater-level fluctuation than QURO. The precipitation signal of FRAN was the strongest in May (r = 0.45–0.49) and with June precipitation also having significant influence (Figure 3A). May and June precipitation were also significant for QURO (Figure 3A). Unlike FRAN, QURO growth was positively affected by March precipitation (r = 0.2) (Figure 3A). Regarding temperature, FRAN growth was positively influenced by the previous November temperature (r = 0.18) and negatively by the previous July, previous September, and current March and May temperatures (Figure 3B). QURO growth was positively influenced by the previous November (r = 0.2) and current April and July temperatures (Figure 3B). FRAN growth was found to be positively significantly related to SPEI from the previous September through the previous November and, also, from the current May–July (Figure 3C). The QURO growth was positively influenced by SPEI from the previous October to November and, also, by that from the current May–August (Figure 3C). The influence of the groundwater-level fluctuation was found to be significant for both FRAN and QURO, with a positive effect from May–September for FRAN and from June–September for QURO; however, FRAN had a tighter relationship with the water level fluctuation (Figure 3D).
3.1.2. Site-Specific Growth Climate Sensitivity
In terms of site-specific differences in climate sensitivity for FRAN, we found a slight variation in the precipitation signal between the KO and SO (Figure 3A). The May correlation was higher at SO than at KO (Figure 3A). The SPEI3 climate signal was stronger at SO compared to KO, as more additional months (previous October and November) significantly affected the FRAN growth. Moreover, the overall sum of the correlation values for FRAN at SO was greater than that for the correlation values for this species at KO (Figure 3C). The most noticeable site-specific differences for FRAN were found in sensitivity to the fluctuation of the groundwater level (Figure 3D). In SO, we found very high correlation values from May to September (r = 0.3–0.53), while, in KO, we only found a weaker correlation, which was only in June (r = 0.33) (Figure 3D). QURO also showed site-specific differences in its climatic signal. QURO growth was more highly correlated with May precipitation at SO than at KO, which showed an additional correlation in June (Figure 3A). The SPEI3 climate signal also differed between sites, as the QURO at SO correlated more positively with the previous year’s November and December and the current May and June, whereas QURO at KO was more highly correlated with the current months of July and August (Figure 3C). The most noticeable QURO site-specific differences were found in the sensitivity to groundwater-level fluctuations. For SO, we detected a positive correlation from June to September (r = 0.12–0.27), whereas no significant correlations were found for KO (Figure 3D).
3.1.3. Temporal Changes in Climate Sensitivity
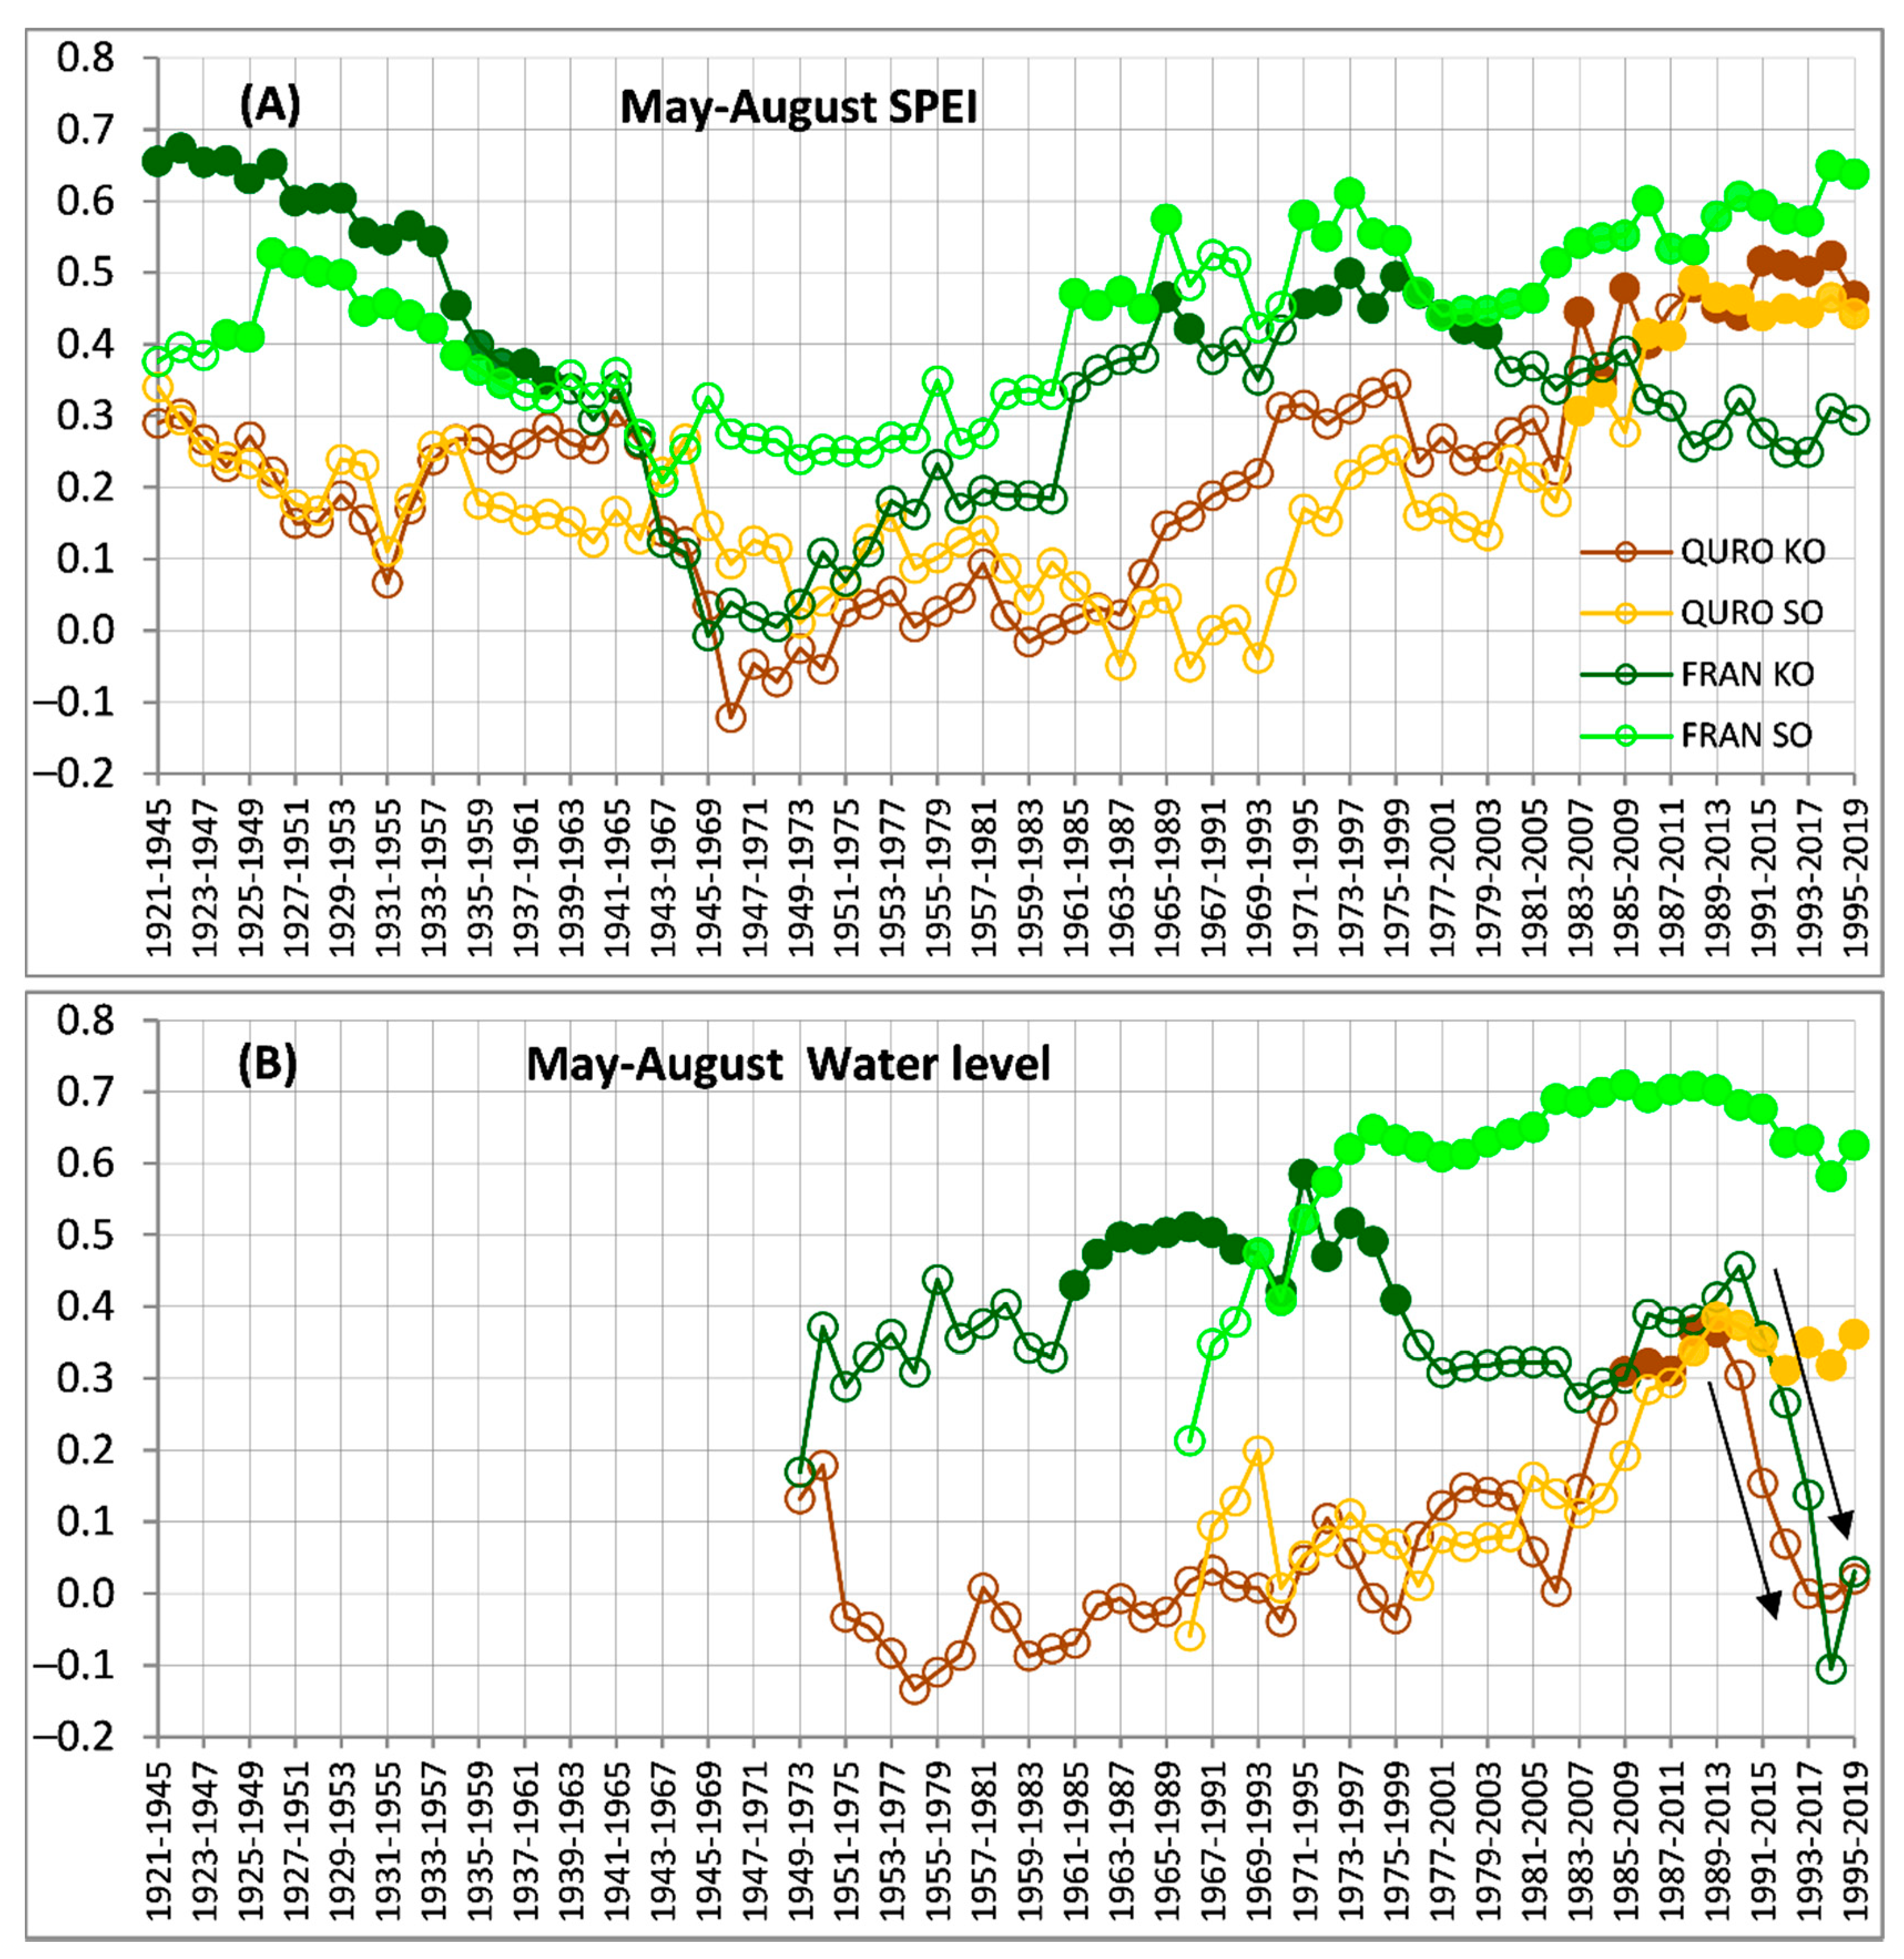
FRAN showed a similar temporal growth sensitivity pattern from May to August SPEI within the periods delimited by the moving windows 1921–1945 to 1979–2003 at both sites (Figure 4A). After the 1980–2004 window, the SPEI correlation of FRAN at SO gradually increased to the highest values achieved in the most recent part of the chronology, whereas SPEI correlation at KO gradually decreased and showed a nonsignificant effect (Figure 4A). QURO showed a very similar growth sensitivity pattern to SPEI3 at both sites, with significant positive correlations in the most recent part of their chronologies (Figure 4A).
The temporal growth sensitivity pattern of FRAN to the groundwater-level fluctuation showed huge differences between the SO and KO (Figure 4B), whereas the correlation for FRAN at SO gradually increased from those in the 1969–1993 window to very high values (fluctuating around r = 0.65) and remained there until the most recent part of the chronology, FRAN at KO, showed significant correlations only between the moving windows from 1961–1985 to 1975–1999. After that, FRAN at KO showed no significant correlations with their rapid decrease after window 1990–2014 (Figure 4B). QURO also showed huge differences between the SO and KO temporal growth sensitivity patterns to the groundwater level (Figure 4B), whereas QURO at SO showed significant positive correlation values (about r = 0.4) from the 1988–2012 window to the most recent part of the chronology, QURO at KO showed significant correlation in the moving windows between 1985–2009 and 1989–2013. After this period, QURO at KO showed no significant correlations, with a rapid decrease in their values (Figure 4B).
3.2. Growth Trends Changes after River Regulation and Revitalization
The short-term and long-term growth trends are shown both by RWI100 and BAI chronologies (Figure 5 and Figure 6).
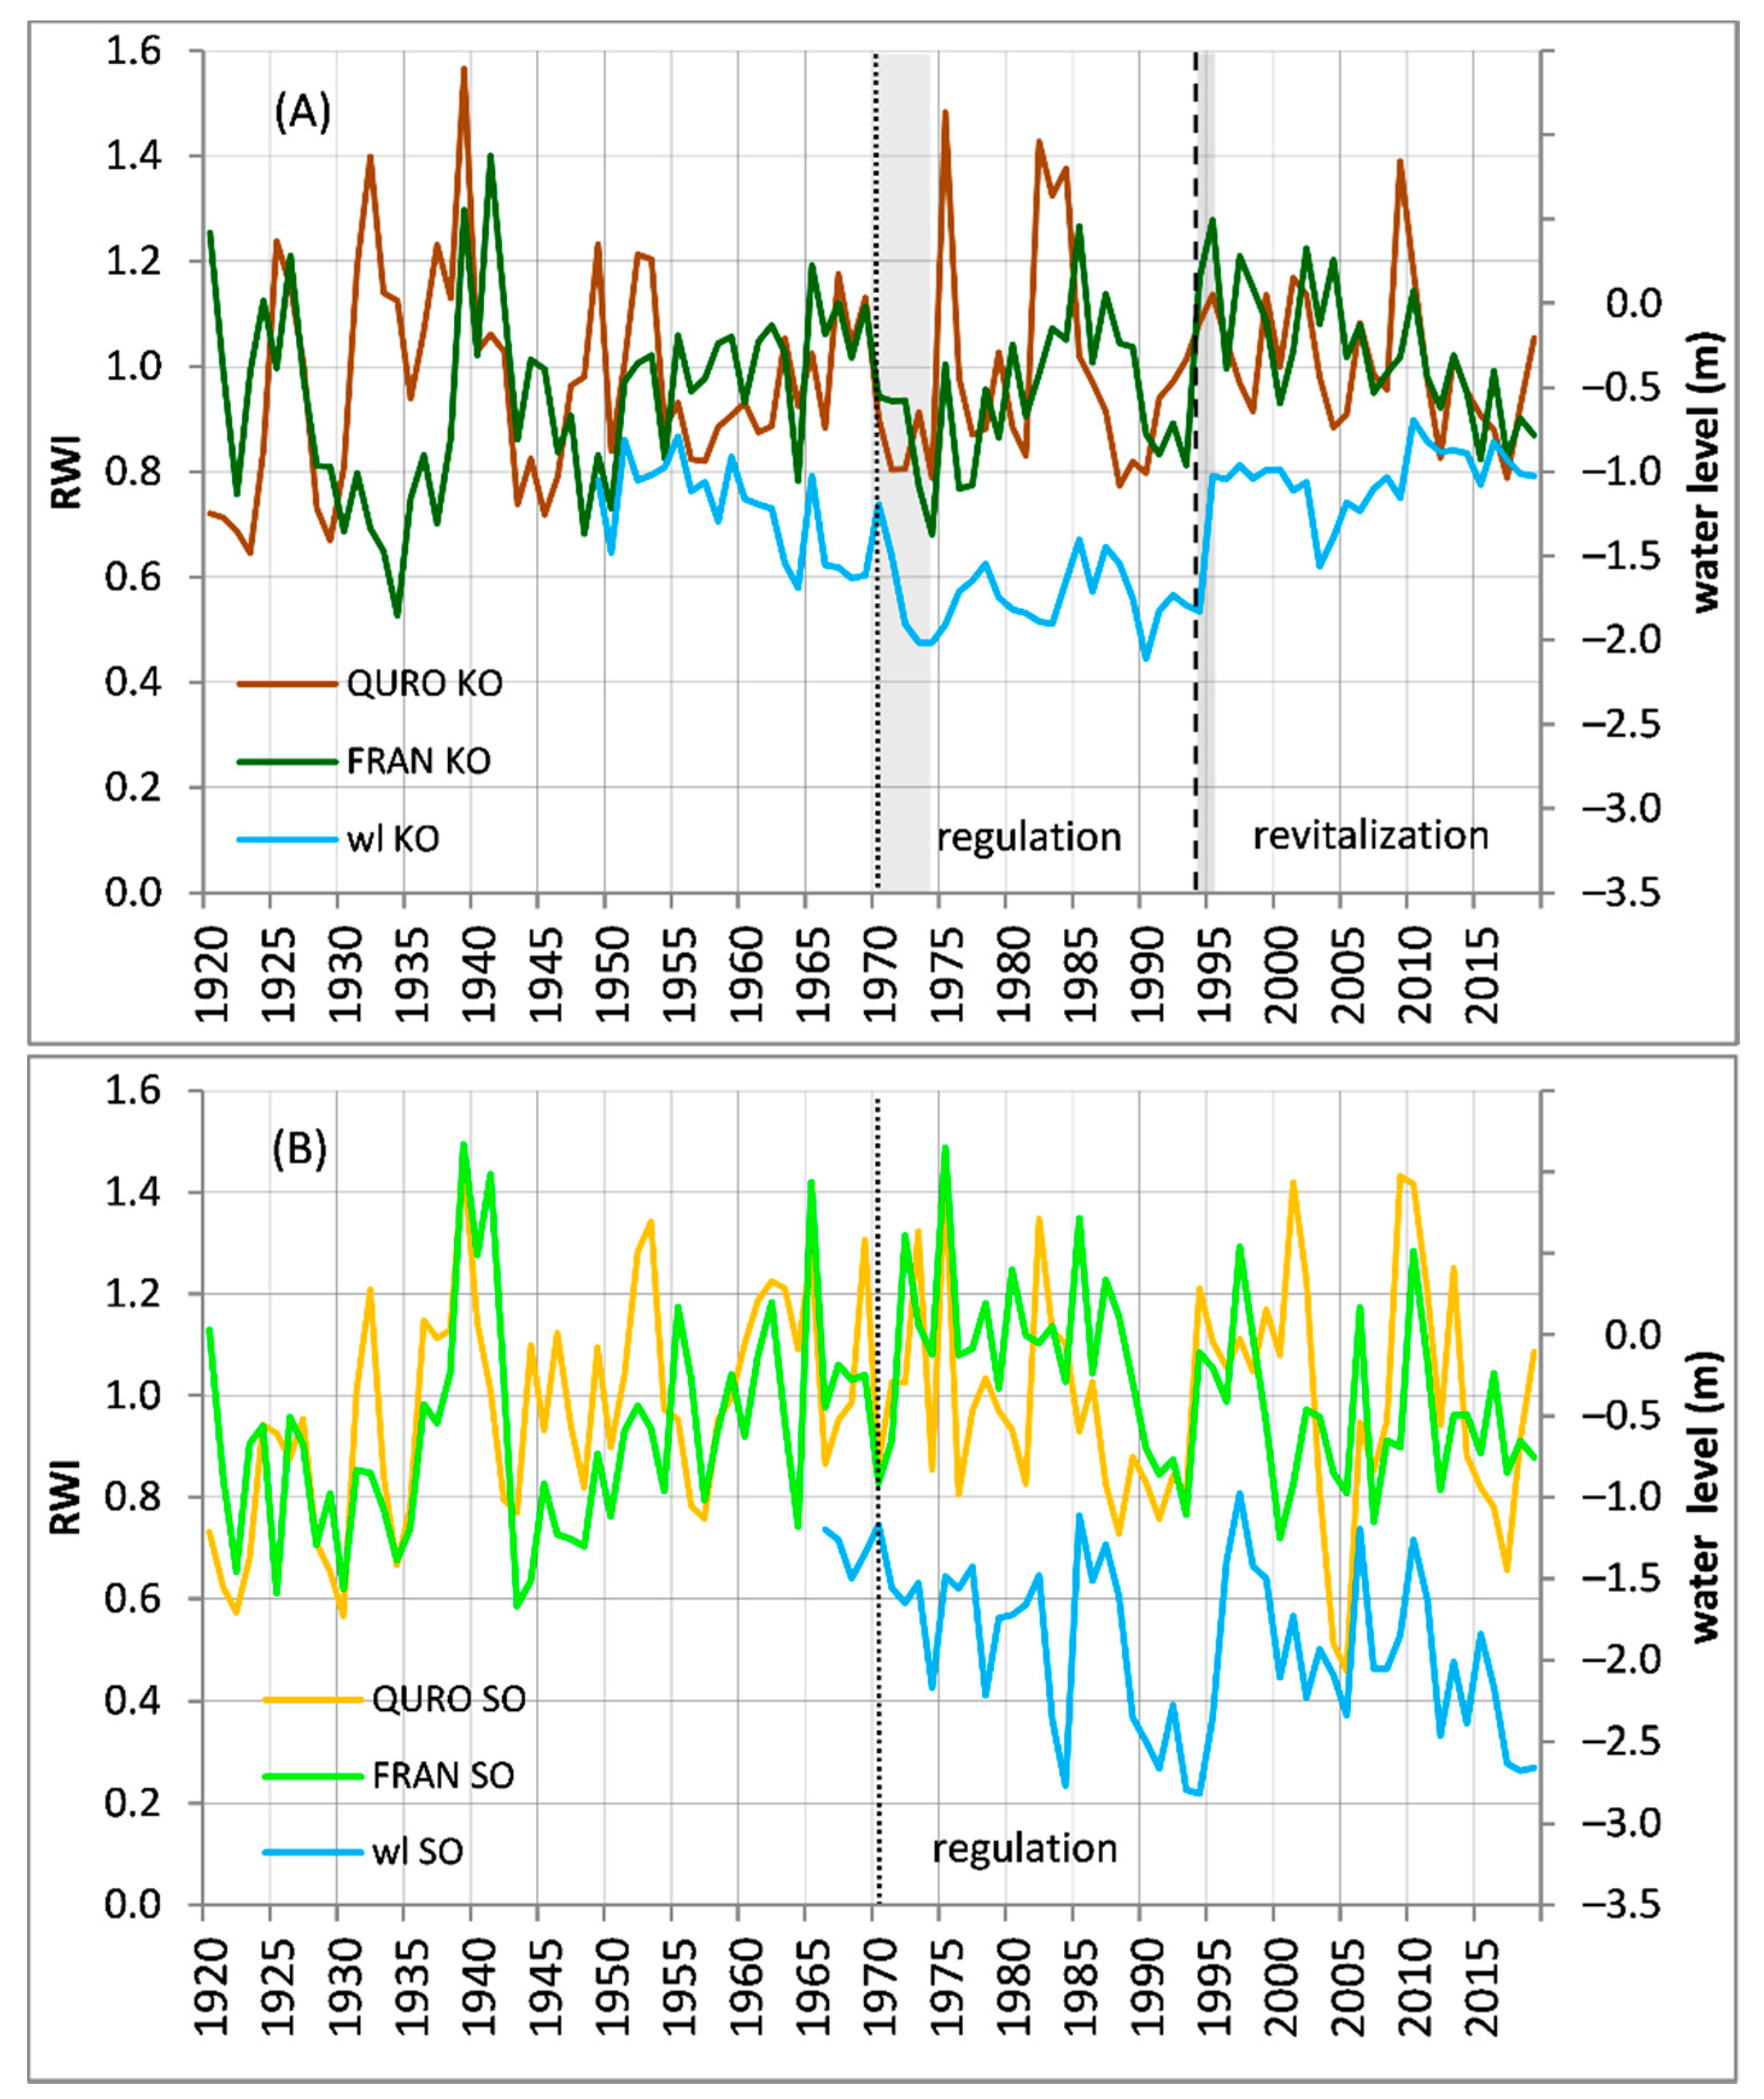
For the short-term trend changes in RWI100 chronologies after early 1970s river regulation, we found site-specific growth reactions at KO and SO. At KO, we found a short-term growth decrease of both QURO and FRAN, with the response of FRAN more negative (Figure 5 and Figure 6). At SO, no rapid growth decrease was found for either species. Similarly, the BAI chronologies at KO showed a more rapid short-term decrease of FRAN compared to QURO and no rapid growth decrease at SO. After 1993′s river revitalization at KO, the RWI100 chronologies showed a rapid growth increase with a more positive reaction of FRAN compared to QURO (Figure 5A). This pattern is also apparent when we compare BAI chronologies (Figure 6).
The centennial (1920–2019) growth trends represented by linear trend slopes are not significant for either of the species or either of the sites. After 1972, the growth trend linear slopes were not significant except for FRAN at SO, which shows significant decrease (Table 2, Figure S2). Regarding the trends of BAI chronologies, QURO showed similar trends at both sites, but FRAN showed a considerable difference between KO and SO after 1993, when the BAI increment was better at revitalized KO (Figure 6B).
4. Discussion
Drought and flooding, both occur in floodplain forest ecosystems and are contrasting abiotic stressors for plants. Accumulated evidence has shown root anatomical traits being essential for the adaptation to drought or flooding [54].
Our results indicate obvious differences between FRAN and QURO, as we detected higher sensitivity of FRAN to spring precipitation, spring, and summer SPEI and groundwater level, with the difference in sensitivity between the species being greatest for groundwater level (Figure 3). This species-specific climate sensitivity is consistent with similar studies from Southeastern Europe [38]. Our initial hypothesis (H1) that FRAN would show higher climate sensitivity was thus supported. As hypothesized, the different hydroclimatic sensitivity probably relates to the different ecological requirements of QURO and FRAN. While QURO is a species with a relatively wide ecological amplitude including both wet and relatively dry sites across Europe, FRAN occurs exclusively in lowland floodplain forests [37]. Thus, QURO is likely adapted to more diverse site conditions with associated better adaptation to drought, causing it to not show as strong climatic signal as FRAN.
Differing species-specific climate sensitivity can be related to differing allometry, morphology and physiology [15,55]. The morphological and physiological adaptation are important for the climate sensitivity of floodplain trees [15,25]. The key role plays the adaptation of root system not only for waterlogging [56] but also for changes in underground water table [12,57]. The role of roots in drought adaptation is in setting a hydraulic environment that allow plants to use water in a maximal way [58]. Rooting depth plays an especially important role in climate sensitivity of floodplain trees [34], as it determines access to groundwater [59], which is more seasonally stable than precipitation. While oak (Quercus) tends to form a rather deep root system [60] that can, in dry conditions, reach the underground water table at depths to 10 m [61], ash (Fraxinus) features more superficial roots [62]; this makes it dependent on upper horizons’ soil water and thus more sensitive to decreasing soil humidity [63]. Moreover, the formation of the ash root system is more influenced by soil properties than that of oak [59].
These differences can explain our finding of stronger precipitation, SPEI and groundwater signals of FRAN than of QURO as FRAN probably has less access to groundwater and therefore is more susceptible to climate fluctuation. The positive effect of March precipitation on growth, shown by QURO which but not FRAN, can be related with different species-specific growth timing, as QURO is typically characterized by earlier onset of spring leaf phenological activity [64]. Recent physiological study also found in the higher drought sensitivity of FRAN compared to QURO in floodplain ecosystem. On the other hand, FRAN showed higher growth than QURO, which was explained the higher photosynthetic and nitrogen use efficiency of FRAN [15].
Overall, temperature is less important than precipitation, SPEI, and groundwater for both FRAN and QURO, as has been documented for most tree species from lower altitudes of temperate zone [22]. Except for the positive influence of previous November temperatures, the effect of temperature on FRAN growth was predominantly negative. Unlike FRAN, QURO showed mostly positive effects of temperature on its growth. The negative correlation of FRAN with previous summer and current spring temperatures is likely attributable to its transpiration and assimilation rates, which decrease the amount of carbohydrates. For FRAN, high summer temperatures induce increased transpiration rates, the inhibition of chloroplast function, and stomatal closure [65]. Likewise, the FRAN and QURO-positive correlations with temperature from the previous autumn indicate the influence of carbohydrate reserves—a warm autumn could improve the accumulation of carbohydrates, which will contribute to better early growth in the next spring [66].
As expected in our hypothesis (H2), we found stronger climate responses of FRAN and QURO at the site with the lower groundwater level (SO). This is in line with some previous studies that documented significant effects of sites on tree growth responses [30], which may vary even among individual trees in floodplain forest stands, depending on their microsites [32]. The site-related differences in FRAN and QURO climate sensitivity were most obvious for belowground water sources (represented by groundwater level), while site-specific differences concerning the availability of aboveground water (represented by SPEI) were weaker (Figure 3). At SO, trees are growing under more growth-limiting conditions due to its lower groundwater level, and therefore, their groundwater signal is stronger than at KO. Belowground water sources represent a key climatic predictor for floodplain tree growth because the net precipitation supplies only a fraction of water for actual evapotranspiration, with trees needing to extract most of their water for transpiration (up to 70%) from the underground water table [67]. Thus, Galić et al. [68] found the most intensive oak dieback at their study on soils with low levels of easily available water. On the other hand, increase in groundwater level and soil moisture may lead to a decline if it persists for too long and causes oxygen deprivation of the root system [69]. Oxygen deficiency is major characteristic of waterlogged soil. Adaptations of roots are in species ability to create different ratios among root tissues, as stele, cortex, xylem or aerenchyma [54].
In line with our hypothesis (H3), FRAN showed the stronger growth reaction and climate sensitivity modulation after river regulation and revitalization. The FRAN at KO showed obvious short-term negative and positive growth reactions to regulation and revitalization, respectively (Figure 5 and Figure 6), with the long-term trend (1972–2019) after early 1970s river regulation being neutral thanks to the revitalization in 1993 (Table 2, Figure S2). FRAN at SO showed no rapid short-term growth decrease after early 1970s regulations, but its long-term (1972–2019) growth trend was negative (Table 2, Figure S2). We can speculate that the absence of a short-term growth decrease of FRAN at SO was caused by the long distance from its location to the riverbed there (compared to its distance to the riverbed at KO) yielding a less rapid decrease in the groundwater level immediately after river regulation in early 1970s. On the other hand, we found much greater fluctuation of groundwater level at SO (Figure 2), causing a gradual long-term growth trend decrease of FRAN (Table 2).
The positive effect of revitalization is clearly apparent when comparing FRAN BAI growth between SO and KO, with FRAN at KO clearly outperforming its conspecifics at SO after the 1993 revitalization (Figure 6B). Moreover, there was an obvious decrease in climate sensitivity after 1993 to both below-ground (water level) and above-ground (SPEI3) water sources as evidenced by temporal changes in the climatic signal (Figure 4). In comparison to FRAN, QURO showed weaker growth reactions to both the regulation and revitalization, and its growth (BAI, RWI100) was similar at both sites. However, there was a clear difference in groundwater level sensitivity between KO and SO after 1993 (Figure 4B), which highlights the positive effect of revitalization, leading to decrease in sensitivity to groundwater level fluctuation. Strong effect of revitalization on rapid decrease in water level fluctuation sensitivity of both FRAN and QURO in KO is even apparent in moving windows started three years earlier before revitalization (from 1990–2014 window). This is caused by dominant proportion of years after the 1993 revitalization in these windows (Figure 4B).
In contrast to river revitalization reducing climate sensitivity, by making water more readily available, groundwater decrease has been shown to negatively affect growth of floodplain trees [57] and increase their sensitivity to drought. Our results for FRAN fit this pattern, i.e., increased drought sensitivity and impaired growth after regulation and decreased climate sensitivity and better growth after revitalization. However, this pattern was not a noticeable for QURO, suggests that this species, with its deeper root system, has been able to maintain access to groundwater at SO even though its groundwater level gradually decreased.
In light of the increasing number of studies regarding both oak and ash forest decline due to climate forcing, fungi (Hymenoscyphus fraxineus), and insect outbreaks [18,70,71,72], river revitalization represents an important tool for decreasing climate sensitivity, and drought stress and thus increasing vitality of the whole forest ecosystem.
5. Conclusions
We investigated growth–climate sensitivity and growth changes after groundwater level manipulation for Fraxinus angustifolia and Quercus robur in floodplain forest ecosystem in Central Europe. We found higher sensitivity of F. angustifolia than Q. robur to drought and groundwater level fluctuation. Moreover, F. angustifolia showed more pronounced short-term and long-term growth decreases after artificial ground water level alteration compared to Q. robur. We also found a positive effect of groundwater level increase due to river revitalization to groundwater level sensitivity for both F. angustifolia and Q. robur. The positive response in climate sensitivity to revitalization was more pronounced for F. angustifolia which, moreover, showed greater growth after river revitalization. Our results suggest that F. angustifolia will be more threatened than Q. robur by diminution in groundwater availability—including during drought events—associated with ongoing climate change. They also show that river revitalization can be a suitable management tool to help adaptation to climate change. Future dendrochronological studies should focus on wider spectrum of floodplain tree species and consider within-stand variability when assessing the responses of tree stands to climate conditions.
Supplementary Materials
The following materials are available online at https://www.mdpi.com/article/10.3390/f12091178/s1, Figure S1: Standardized Precipitation Evaporation index for the period 1920–2019, Figure S2: Slopes of linear fits for RWI100 chronologies representing long-term growth trends for the period after Thaya river revitalization.
Author Contributions
Conceptualization, M.Š. (Martin Šenfeldr) and P.M.; Formal analysis, M.Š. (Martin Šenfeldr) and H.H.; Investigation, M.Š. (Martin Šenfeldr), P.H., J.K. and M.Š. (Martin Šrámek); Methodology, M.Š. (Martin Šenfeldr); Visualization, M.Š. (Martin Šenfeldr) and M.Š. (Martin Šrámek); Writing—Original draft, M.Š. (Martin Šenfeldr); Writing—Review & editing, M.Š. (Martin Šrámek) and P.M. All authors have read and agreed to the published version of the manuscript.
Funding
The study was supported through a grant from the Ministry of Education, Youth and Sports of the Czech Republic: LTC19013 “The effect of changed environmental conditions on South Moravian floodplain forest ecosystems”, INTER-EXCELLENCE program (INTER-COST subprogram).
Data Availability Statement
The data presented in this study and R codes are available on request from the first author.
Acknowledgments
The authors thank J. Rosenthal for improving the English. Additionally, we are grateful to L. Karas for help in the field and A. Rousová for laboratory assistance.
Conflicts of Interest
The authors declare that they have no conflict of interest.
References
- Revenga, C.; Brunner, J.; Henninger, N.; Kassem, K.; Payne, R. Pilot Analysis of Global Ecosystems: Freshwater Systems; World Resources Institute: Washington, DC, USA, 2000. [Google Scholar]
- Kozlowski, T.T. Physiological-ecological impacts of flooding on riparian forest ecosystems. Wetlands 2002, 22, 550–561. [Google Scholar] [CrossRef]
- Tockner, K.; Stanford, J.A. Riverine flood plains: Present state and future trends. Environ. Conserv. 2002, 29, 308–330. [Google Scholar] [CrossRef] [Green Version]
- Machar, I. Editorial for special issue “Biodiversity and management of temperate floodplain forests”. Forests 2021, 12, 351. [Google Scholar] [CrossRef]
- Maděra, P.; Řepka, R.; Koutecký, T.; Šebesta, J. Vascular plant biodiversity of floodplain forest in Morava and Dyje Rivers confluence (Forest District Soutok), Czech Republic. J. Landsc. Ecol. 2018, 11, 64–97. [Google Scholar] [CrossRef] [Green Version]
- Řepka, R.; Šebesta, J.; Maděra, P.; Vahalík, P. Comparison of the floodplain forest floristic composition of two riparian corridors: Species richness, alien species and the effect of water regime changes. Biologia 2015, 70, 208–217. [Google Scholar] [CrossRef]
- Schindler, S.; Sebesvari, Z.; Damm, C.; Euller, K.; Mauerhofer, V.; Schneidergruber, A.; Biró, M.; Essl, F.; Kanka, R.; Lauwaars, S.G.; et al. Multifunctionality of floodplain landscapes: Relating management options to ecosystem services. Landsc. Ecol. 2014, 29, 229–244. [Google Scholar] [CrossRef]
- Pechanec, V.; Machar, I.; Sterbova, L.; Prokopova, M.; Kilianova, H.; Chobot, K.; Cudlin, P. Monetary valuation of natural forest habitats in protected areas. Forests 2017, 8, 427. [Google Scholar] [CrossRef] [Green Version]
- Klimo, E. (Ed.) Floodplain Forests of the Temperate Zone of Europe; Publishing House for Forestry: Lesnická Práce, Czech Republic, 2008. [Google Scholar]
- Maděra, P. Response of floodplain forest communities herb layer to changes in the water regime. Biológia Bratisl. 2001, 56, 63–72. [Google Scholar]
- Maděra, P. Effect of water regime changes on the diversity of plant communities in floodplain forests. Ekológia 2001, 20, 116–129. [Google Scholar]
- Maděra, P. Can the microscopic structure of wood influence landscape diversity? Ekologia 2001, 20, 387–393. [Google Scholar]
- Mosner, E.; Weber, A.; Carambia, M.; Nilson, E.; Schmitz, U.; Zelle, B.; Horchler, P. Climate change and floodplain vegetation—Future prospects for riparian habitat availability along the Rhine River. Ecol. Eng. 2015, 82, 493–511. [Google Scholar] [CrossRef]
- Schneider, C.; Laizé, C.L.R.; Acreman, M.C.; Flörke, M. How will climate change modify river flow regimes in Europe? Hydrol. Earth Syst. Sci. 2013, 17, 325–339. [Google Scholar] [CrossRef] [Green Version]
- Kowalska, N.; Šigut, L.; Stojanović, M.; Fischer, M.; Kyselova, I.; Pavelka, M. Analysis of floodplain forest sensitivity to drought. Philos. Trans. R. Soc. Lond. B Biol. Sci. 2020, 375, 20190518. [Google Scholar] [CrossRef]
- Skiadaresis, G.; Schwarz, J.A.; Bauhus, J. Groundwater extraction in floodplain forests reduces radial growth and increases summer drought sensitivity of pedunculate oak trees (Quercus robur L.). Front. For. Glob. Chang. 2019, 2, 5. [Google Scholar] [CrossRef] [Green Version]
- Hughes, F.M.; Rood, S.B. Allocation of river flows for restoration of floodplain forest ecosystems: A review of approaches and their applicability in Europe. Environ. Manag. 2003, 32, 12–33. [Google Scholar] [CrossRef] [PubMed]
- Stojanovič, D.B.; Levanič, T.; Matović, B.; Orlović, S. Growth decrease and mortality of oak floodplain forests as a response to change of water regime and climate. Eur. J. For. Res. 2015, 134, 555–567. [Google Scholar] [CrossRef]
- Giagli, K.; Baar, J.; Fajstavr, M.; Gryc, V.; Vavrčík, H. Tree-ring width and Variation of Wood Density in Fraxinus excelsior L. and Quercus robur L. Growing in Floodplain Forests. BioResources 2018, 13, 804–819. [Google Scholar] [CrossRef]
- Schweinguber, F.H. Tree-Rings and Environment: Dendroecology; Swiss Federal Institute for Forest, Snow and Landscape Research: Zürich, Switzerland, 1996. [Google Scholar]
- Rehschuh, R.; Mette, T.; Menzel, A.; Buras, A. Soil properties affect the drought susceptibility of Norway spruce. Dendrochronologia 2017, 45, 81–89. [Google Scholar] [CrossRef]
- Fritts, H.C. Tree Rings and Climate; Academic Press: New York, NY, USA, 1976. [Google Scholar]
- Stella, J.C.; Riddle, J.; Piégay, H.; Gagnage, M.; Trémélo, M.L. Climate and local geomorphic interactions drive patterns of riparian forest decline along a Mediterranean Basin river. Geomorphology 2013, 202, 101–114. [Google Scholar] [CrossRef]
- Ferner, E.; Rennenberg, H.; Kreuzwieser, J. Effect of flooding on C metabolism of flood-tolerant (Quercus robur) and non-tolerant (Fagus sylvatica) tree species. Tree Physiol. 2012, 32, 135–145. [Google Scholar] [CrossRef] [Green Version]
- Glenz, C.; Schlaepfer, R.; Iorgulescu, I.; Kienast, F. Flooding tolerance of Central European tree and shrub species. For. Ecol. Manag. 2006, 235, 1–13. [Google Scholar] [CrossRef]
- Scharnweber, T.; Couwenberg, J.; Heinrich, I.; Wilmking, M. New insights for the interpretation of ancient bog oak chronologies? Reactions of oak (Quercus robur L.) to a sudden peatland rewetting. Palaeogeogr. Palaeoclimatol. Palaeoecol. 2015, 417, 534–543. [Google Scholar] [CrossRef]
- Lite, S.J.; Stromberg, J.C. Surface water and ground-water thresholds for maintaining Populus–Salix forests, San Pedro River, Arizona. Biol. Conserv. 2005, 125, 153–167. [Google Scholar] [CrossRef]
- Singer, M.B.; Stella, J.C.; Dufour, S.; Piégay, H.; Wilson, R.J.; Johnstone, L. Contrasting water-uptake and growth responses to drought in co-occurring riparian tree species. Ecohydrology 2013, 6, 402–412. [Google Scholar] [CrossRef]
- Haneca, K.; Čufar, K.; Beeckman, H. Oaks, tree-rings and wooden cultural heritage: A review of the main characteristics and applications of oak dendrochronology in Europe. J. Archaeol. Sci. 2009, 36, 1–11. [Google Scholar] [CrossRef]
- Rybníček, M.; Čermák, P.; Prokop, O.; Žid, T.; Trnka, M.; Kolář, T. Oak (Quercus spp.) response to climate differs more among sites than among species in central Czech Republic. Dendrobiology 2016, 75, 55–65. [Google Scholar] [CrossRef]
- Salekl, L.; Sivacioglu, A.; Topacoglu, O.; Zahradnile, D.; Jerabkoval, L.; Machar, I. Crowns of Old Remnant Oak Standards. Fresenius Environ. Bull. 2017, 26, 4023–4032. [Google Scholar]
- Tumajer, J.; Treml, V. Influence of artificial alteration of groundwater level on vessel lumen area and tree-ring width of Quercus robur. Trees 2017, 31, 1945–1957. [Google Scholar] [CrossRef]
- Tumajer, J.; Treml, V. Response of floodplain pedunculate oak (Quercus robur L.) tree-ring width and vessel anatomy to climatic trends and extreme hydroclimatic events. For. Ecol. Manag. 2016, 379, 185–194. [Google Scholar] [CrossRef]
- Singer, M.B.; Sargeant, C.I.; Piégay, H.; Riquier, J.; Wilson, R.J.; Evans, C.M. Floodplain ecohydrology: Climatic, anthropogenic, and local physical controls on partitioning of water sources to riparian trees. Water Resour. Res. 2014, 50, 4490–4513. [Google Scholar] [CrossRef] [PubMed] [Green Version]
- Heklau, H.; Jetschke, G.; Bruelheide, H.; Seidler, G.; Haider, S. Species-specific responses of wood growth to flooding and climate in floodplain forests in Central Germany. IForest 2019, 12, 226. [Google Scholar] [CrossRef]
- Roibu, C.C.; Sfeclă, V.; Mursa, A.; Ionita, M.; Nagavciuc, V.; Chiriloaei, F.; Popa, I. The climatic response of tree ring width components of ash (Fraxinus excelsior L.) and common oak (Quercus robur L.) from Eastern Europe. Forests 2020, 11, 600. [Google Scholar] [CrossRef]
- Úradníček, L.; Maděra, P.; Tichá, S.; Koblížek, J. Woody Plants of the Czech. Republic; Lesnická práce: Kostelec nad Černými lesy, Czech Republic, 2010; 368p. [Google Scholar]
- Mikac, S.; Žmegač, A.; Trlin, D.; Paulić, V.; Oršanić, M.; Anić, I. Drought-induced shift in tree response to climate in floodplain forests of Southeastern Europe. Sci. Rep. 2018, 8, 1–12. [Google Scholar] [CrossRef] [PubMed]
- Ružičková, H.; Banásová, V.; Kalivoda, H. Morava River alluvial meadows on the Slovak–Austrian border (Slovak part): Plant community dynamics, floristic and butterfly diversity–threats and management. J. Nat. Conserv. 2004, 12, 157–169. [Google Scholar] [CrossRef]
- Čupa, P.; Madera, P. The UNESCO Dolni Morava Biosphere Reserve—A model for cultural landscape management. Eco. Mont. 2019, 11, 36–42. [Google Scholar] [CrossRef]
- Quitt, E. Klimatické Oblasti Československa [Climatic Regions of Czechoslovakia]; Geografický Ústav ČSAV, (Brno): Brno, Chez Republic, 1975. [Google Scholar]
- Czudek, T. Reliéf Moravy a Slezska v Kvartéru [Relief of Moravia and Silesia in the Quaternary]; Sursum: Tišnov, Czech Republic, 1997; 213p. [Google Scholar]
- IUSS Working Group WRB. World Reference Base for Soil Resources International Soil Classification System for Naming Soils and Creating Legends for Soil Maps World Soil Resources Reports, no. 106; FAO: Rome, Italy, 2014. [Google Scholar]
- Cook, E.R.; Peters, K. The smoothing spline: A new approach to standardizing forest interior tree-ring width series for dendroclimatic studies. Tree Ring Res. 1981, 41, 45–53. [Google Scholar]
- Cook, E.R. A Time Series Analysis Approach to Tree Ring Standardization (Dendrochronology, Forestry, Dendroclimatology, Autoregressive Process). Ph.D. Thesis, The University of Arizona, Tuscon, AZ, USA, 1985; p. 171. [Google Scholar]
- Bunn, A.G. A dendrochronology program library in R (dplR). Dendrochronologia 2008, 26, 115–124. [Google Scholar] [CrossRef]
- Beguería, S.; Vicente-Serrano, S.M.; Reig, F.; Latorre, B. Standardized precipitation evapotranspiration index (SPEI) revisited: Parameter fitting, evapotranspiration models, tools, datasets and drought monitoring. Int. J. Climatol. 2014, 34, 3001–3023. [Google Scholar] [CrossRef] [Green Version]
- Vicente-Serrano, S.M.; Begueria, S.; Lopez-Moreno, J.I. A multi-scalar drought index sensitive to global warming: The Standardized Precipitation Evapotranspiration Index. J. Clim. 2010, 23, 1696–1718. [Google Scholar] [CrossRef] [Green Version]
- R Team. R: A Language and Environment for Statistical Computing; R Foundation for Statistical Computing: Vienna, Austria, 2018. [Google Scholar]
- Bunn, A.G.; Korpela, M.; Biondi, F.; Merian, P.; Qeadan, F.; Zang, C. dplR: Dendrochronology Program. Library in R. 2021, R package version 1.7.2. Available online: http://CRAN.R-project.org/package=dplR (accessed on 31 January 2021).
- Beguería, S.; Vicente-Serrano, S.M. SPEI: Calculation of the Standardized Precipitation-Evapotranspiration Index. 2013, R Package Version 1.6. Available online: http://CRAN.R-project.org/package=SPEI (accessed on 7 June 2021).
- Zang, C.; Biondi, F. treeclim: An R package for the numerical calibration of proxy-climate relationships. Ecography 2015, 38, 431–436. [Google Scholar] [CrossRef]
- Peters, R.L.; Groenendijk, P.; Vlam, M.; Zuidema, P.A. Detecting long-term growth trends using tree rings: A critical evaluation of methods. Glob. Chang. Biol. 2015, 21, 2040–2054. [Google Scholar] [CrossRef] [PubMed]
- Yamauchi, T.; Pedersen, O.; Nakazono, M.; Tsutsumi, N. Key root traits of Poaceae for adaptation to soil water gradients. New Phytol. 2021, 229, 3133–3140. [Google Scholar] [CrossRef] [PubMed]
- Čermák, J. Leaf distribution in large trees and stands of the floodplain forest in southern Moravia. Tree Physiol. 1998, 18, 727–737. [Google Scholar] [CrossRef]
- Armstrong, W.; Justin, S.H.F.W.; Beckett, P.M.; Lythe, S. Root adaptation to soil waterlogging. Aquat. Bot. 1991, 39, 57–73. [Google Scholar] [CrossRef]
- Maděra, P.; Úradníček, L. Growth response of oak (Quercus robur L.) and ash (Fraxinus angustifolia Vahl.) on changed conditions of the floodplain forest geobiocoene hydrological regime. Ekológia 2001, 20, 130–142. [Google Scholar]
- Vadez, V. Root hydraulics: The forgotten side of roots in drought adaptation. Field Crops Res. 2014, 165, 15–24. [Google Scholar] [CrossRef] [Green Version]
- Tatarinov, F.; Urban, J.; Čermák, J. Application of “clump technique” for root system studies of Quercus robur and Fraxinus excelsior. For. Ecol. Manag. 2008, 255, 495–505. [Google Scholar] [CrossRef]
- Göransson, H.; Wallander, H.; Ingerslev, M.; Rosengren, U. Estimating the relative nutrient uptake from different soil depths in Quercus robur, Fagus sylvatica and Picea abies. Plant. Soil. 2006, 286, 87–97. [Google Scholar] [CrossRef]
- Romanovsky, M.G.; Mamaev, V.V. Gruntovye vody nagornyh dubrav Tallermanovskogo lesa [Groundwater of mountain oak forests of Tallerman]. Lesovedenie 2002, 5, 11–16. (In Russian) [Google Scholar]
- Kerr, G.; Cahalan, C. A review of site factors affecting the early growth of ash (Fraxinus excelsior L.). For. Ecol. Manag. 2004, 188, 225–234. [Google Scholar] [CrossRef]
- Rust, S.; Savill, P.S. The root systems of Fraxinus excelsior and Fagus sylvatica and their competitive relationships. Forestry 2000, 73, 499–508. [Google Scholar] [CrossRef]
- Sass-Klaassen, U.; Sabajo, C.R.; den Ouden, J. Vessel formation in relation to leaf phenology in pedunculate oak and European ash. Dendrochronologia 2011, 29, 171–175. [Google Scholar] [CrossRef]
- Kramer, P. Physiology of Woody Plants; Elsevier: Amsterdam, The Netherlands, 2012; 826p. [Google Scholar]
- Barbaroux, C.; Breda, N. Contrasting distribution and seasonal dynamics of carbohydrate reserves in stem wood of adult ring-porous sessile oak and diffuse-porous beech trees. Tree Physiol. 2002, 22, 1201–1210. [Google Scholar] [CrossRef] [PubMed]
- Čermák, J.; Prax, A. Water balance of a Southern Moravian floodplain forest under natural and modified soil water regimes and its ecological consequences. Ann. For. Sci. 2001, 58, 15–29. [Google Scholar] [CrossRef] [Green Version]
- Galić, Z.; Orlović, S.; Klašnja, B.; Kebert, M.; Galović, V. Edaphic conditions in most common types of oak forests affected by drying. Contemp. Agric. 2011, 60, 260–266. [Google Scholar]
- Kreuzwieser, J.; Papadopoulou, E.; Rennenberg, H. Interaction of flooding with carbon metabolism of forest trees. Plant. Biol. 2004, 6, 299–306. [Google Scholar] [CrossRef] [PubMed]
- Keßler, M.; Cech, T.L.; Brandstetter, M.; Kirisits, T. Dieback of ash (Fraxinus excelsior and Fraxinus angustifolia) in Eastern Austria: Disease development on monitoring plots from 2007 to 2010. J. Agric. Ext. Rural Dev. 2012, 4, 223–226. [Google Scholar] [CrossRef]
- Coker, T.L.; Rozsypálek, J.; Edwards, A.; Harwood, T.P.; Butfoy, L.; Buggs, R.J. Estimating mortality rates of European ash (Fraxinus excelsior) under the ash dieback (Hymenoscyphus fraxineus) epidemic. Plants People Planet 2019, 1, 48–58. [Google Scholar] [CrossRef] [Green Version]
- Colangelo, M.; Camarero, J.J.; Ripullone, F.; Gazol, A.; Sánchez-Salguero, R.; Oliva, J.; Redondo, M.A. Drought decreases growth and increases mortality of coexisting native and introduced tree species in a temperate floodplain forest. Forests 2018, 9, 205. [Google Scholar] [CrossRef] [Green Version]
Figure 1.
(A) The position of studied sites within the study area, (B) the location of the study area in Europe. The photographs show: (C) SO and (D) KO sites in spring.
Figure 1.
(A) The position of studied sites within the study area, (B) the location of the study area in Europe. The photographs show: (C) SO and (D) KO sites in spring.

Figure 2.
March–September average water level fluctuations at studied sites (SO and KO) with their linear trends represented by straight lines. The dotted line shows the date when river regulation started, while dashed arrows show the start of river revitalization at the KO site, followed by increase of the ground water level (data source: Czech Hydrometeorological Institute, Brno).

Figure 3.
Bootstrapped correlation coefficients between the monthly resolved: (A) precipitation, (B) temperature, (C) three-month standardized precipitation evapotranspiration index—SPEI, and (D) groundwater level and ring width indices (RWI30) of the standard chronologies. Filled bars correspond to statistically significant (p < 0.05) correlation coefficients. Species abbreviations: QURO—Quercus robur and FRAN—Fraxinus angustifolia; site designations: KO and SO.

Figure 4.
Moving correlations calculated between the tree ring width indices and selected monthly climate variables: (A) May–August standardized precipitation evapotranspiration index—SPEI, (B) May–August average water levels. The Pearson coefficients were calculated for 25-year moving windows lagged by 1 year for the 1920–2019 period. Filled symbols correspond to significant (p < 0.05) correlation coefficients. The two arrows show the effect of revitalizations at the KO site. Species abbreviations: QURO—Quercus robur and FRAN—Fraxinus angustifolia; site designations: KO and SO.

Figure 5.
Standard chronologies (RWI100) of Fraxinus angustifolia (FRAN) and Quercus robur (QURO) reflecting medium-to-low variability at sites: (A) KO, (B) SO. The chronologies are plotted against March–September average water levels (wl). The dotted line shows the date when the river regulation started, while the dashed line shows the date when revitalization started. The gray areas show short-term growth reaction to river regulation and revitalization.

Figure 6.
Basal increment area chronologies for: (A) Quercus robur, (B) Fraxinus angustifolia at KO and SO sites. The dotted line shows the date when the river regulation started and the double-ended arrow delimits when revitalization occurred at KO.
Figure 6.
Basal increment area chronologies for: (A) Quercus robur, (B) Fraxinus angustifolia at KO and SO sites. The dotted line shows the date when the river regulation started and the double-ended arrow delimits when revitalization occurred at KO.


Table 1.
Basic characteristics of the raw series and RWI30 site standard chronologies (EPS—Expressed population signal and SNR—Signal-to-noise ratio).
Table 1.
Basic characteristics of the raw series and RWI30 site standard chronologies (EPS—Expressed population signal and SNR—Signal-to-noise ratio).
| Site | Species | Elevation (m a.s.l.) | No. Sampled Trees | Span | Avg. Series Length (year ± SD) | 1st Order Autocorrelation (Raw Series) | Series Intercorrelation | EPS | SNR |
|---|---|---|---|---|---|---|---|---|---|
| KO | Quercus robur L. | 159 | 63 | 1860–2019 | 117.6 ± 34.1 | 0.69 | 0.56 | 0.97 | 29.8 |
| KO | Fraxinus angustifolia Vahl. | 159 | 37 | 1883–2019 | 96.4 ± 25.3 | 0.71 | 0.57 | 0.92 | 12.1 |
| SO | Quercus robur | 154 | 33 | 1885–2019 | 122.6 ± 6.8 | 0.72 | 0.67 | 0.97 | 30.9 |
| SO | Fraxinus angustifolia | 154 | 30 | 1869–2019 | 126.6 ± 25.3 | 0.69 | 0.59 | 0.92 | 11.1 |
Table 2.
Slopes of linear fits for RWI100 chronologies (1900–2019, 1972–2019). Significant values are in bold (p-values are in parentheses).
Table 2.
Slopes of linear fits for RWI100 chronologies (1900–2019, 1972–2019). Significant values are in bold (p-values are in parentheses).
| 1900–2019 | 1972–2019 | |||
|---|---|---|---|---|
| Site | Quercus robur | Fraxinus angustifolia | Quercus robur | Fraxinus angustifolia |
| KO | 0.0002209 | −0.00006 | 0.000282 | 0.001551 |
| (0.615) | (0.899) | (0.868) | (0.285) | |
| SO | 0.0002825 | 0.0005127 | −0.001425 | −0.006579 |
| (0.617) | (0.325) | (0.553) | (0.0000742) | |
Publisher’s Note: MDPI stays neutral with regard to jurisdictional claims in published maps and institutional affiliations. |
© 2021 by the authors. Licensee MDPI, Basel, Switzerland. This article is an open access article distributed under the terms and conditions of the Creative Commons Attribution (CC BY) license (https://creativecommons.org/licenses/by/4.0/).
Share and Cite
MDPI and ACS Style
Šenfeldr, M.; Horák, P.; Kvasnica, J.; Šrámek, M.; Hornová, H.; Maděra, P. Species-Specific Effects of Groundwater Level Alteration on Climate Sensitivity of Floodplain Trees. Forests 2021, 12, 1178. https://doi.org/10.3390/f12091178
AMA Style
Šenfeldr M, Horák P, Kvasnica J, Šrámek M, Hornová H, Maděra P. Species-Specific Effects of Groundwater Level Alteration on Climate Sensitivity of Floodplain Trees. Forests. 2021; 12(9):1178. https://doi.org/10.3390/f12091178
Chicago/Turabian StyleŠenfeldr, Martin, Pavel Horák, Jakub Kvasnica, Martin Šrámek, Hana Hornová, and Petr Maděra. 2021. "Species-Specific Effects of Groundwater Level Alteration on Climate Sensitivity of Floodplain Trees" Forests 12, no. 9: 1178. https://doi.org/10.3390/f12091178
Note that from the first issue of 2016, this journal uses article numbers instead of page numbers. See further details here.