Microbial Community Analysis of Native Pinus sylvestris L. and Alien Pinus mugo L. on Dune Sands as determined by Ecoplates


1
Institute of Forestry, Lithuanian Research Centre for Agriculture and Forestry, Liepų str. 1 Girionys, LT-53101 Kaunas, Lithuania
2
Institute of Agriculture, Lithuanian Research Centre for Agriculture and Forestry, Akademija, LT-58344 Kėdainiai, Lithuania
3
Institute of Forest Biology and Silviculture, Vytautas Magnus University Agriculture Academy, Studentų str. 11, Akademija, LT-53361 Kaunas, Lithuania
*
Author to whom correspondence should be addressed.
Forests 2020, 11(11), 1202; https://doi.org/10.3390/f11111202
Submission received: 22 October 2020
/
Revised: 10 November 2020
/
Accepted: 12 November 2020
/
Published: 15 November 2020
(This article belongs to the Section Forest Ecology and Management)
Abstract
:The Curonian Spit (Lithuanian: Kursiu nerija) is a 98 km long, thin, curved sand-dune spit that separates the Curonian Lagoon from the Baltic Sea coast. The Curonian Spit is home to the highest moving (drifting) sand dunes in Europe. Coniferous woods are prevalent in the Kursiu Nerija National Park (80%). These woods consist mostly of native Scots pine (Pinus sylvestris L.) and alien mountain pine (Pinus mugo L.). With the planting of non-native species, there is a need for studies evaluating the effects of alien and native plant species on soil ecosystem properties. We measured soil microbial communities from nearby pairs of native and alien pine species. Forty-two sampling sites of close-growing P. sylvestris and P. mugo were selected. To measure the soil microbial activity in these sites, we used Biolog EcoPlates. We found that the functional diversity of microorganisms that use carbon sources was significantly greater in the mature pine stands. Microbial functional diversity was also greater in the soils of native pine stands. Differences between activity and functional diversity in newly established and old stands were also identified.
1. Introduction
The Curonian Spit is a unique sandy and wooded landscape. The spit was formed by sea, wind, and human activities. Five thousand years ago, a narrow peninsula (98 km long and 0.4–3.8 km wide)—the Great Dune Ridge, separating the Baltic Sea from the Curonian Lagoon—was formed on the moraine islands by streams, and then overgrown with forest. After intensive deforestation in the 17–18th centuries, the dunes began to move towards the Curonian Lagoon, burying the oldest settlements [1]. At that time, the ancient parabolic dunes were destroyed by sand drift and were replaced by shifting dunes [2]. At the turn of the 19th century, it became apparent that without immediate action, people would no longer be able to live in the area. Work to stabilize the dunes began at this point and continues to this day. An extensive afforestation program was implemented in the 1800s and early 1900s to stabilize sand drift [3]. Towards the end of the 19th century, a protective ridge of the dune was formed along the coastline to prevent the migration of sand from the inside, and the ridge of the Great Dune was protected by hedges of trees and shrubs. Currently, forests and sand prevail on the Curonian Spit. Urban areas (eight small settlements) occupy only about 6% of the land [1].
Mountain pine (Pinus mugo L.) is a tree species that is found widely distributed throughout the world because of its extreme resistance to cold climates and various soil conditions [4]. The first P. mugo plantations were planted in the sand dunes on the Curonian Spit on the coast of Lithuania almost 200 years ago [5]. Mountain pine plantations are now growing well in many places. Naturally, regenerating seedlings of mountain pine are found near mature trees, demonstrating the adaptation of mountain pine to coastal sand dune conditions [6]. In the Curonian Spit, however, it has been observed that the fire rate is higher in pine forests where alien P. mugo rather than native P. sylvestris, is growing [7]. Nowadays, silvicultural policy tends towards prevention of the spread of P. mugo and its gradual replacement with P. sylvestris.
Many researches have been undertaken on adaptation to the existing environment; alien plants can affect native plant communities, reduce their diversity and abundance, and alter the functions and structures of ecosystems. These changes occur because alien plants differ from native plant species in terms of size, fitness, growth rate, physiology, leaf area, and shoot distribution. Such plants, which adversely affect the local environment, can become invasive [8,9]. They have direct and indirect impacts on native plant communities, influencing the soil environment [10,11,12,13,14]. As a result, the soil nutrient quality and soil structure change. The activity, biomass, and composition of complex soil microbial communities or specific groups of microbes (mycorrhizal, saprotrophic, or pathogenic) and fungal or ammonia-oxidizing bacteria also can change [12,15,16,17,18,19,20]. Microbial communities have been found to be more affected by alien plants than native plants, due to different levels of nitrogen and differences in the amount and chemical composition of allelochemical compounds and plant root exudates [21,22,23,24,25,26]. Wu et al. [27] found that invasion of Staghorn sumac (Rhus typhina L.) had no significant effect on soil bacterial community diversity and richness, but that the community composition changed. Some investigations have shown that non-native pines can alter dune habitats [28]. However, how native and alien pines affect the activity and functional diversity of soil microorganisms in the Curonian Spit has not previously been studied.
In our previous study on pine forest, an increased abundance of fungi was associated with increasing forest age, and the amount of enzymes was also altered [29]. Other findings in the Saugatuck Dunes indicate that mature stands are already affecting dune communities [28]. There is no information regarding how pine age effects the activity and functional diversity of microorganisms in the Curonian Spit dunes.
Considering that alien plants affect their surrounding environment, we decided to examine how microbial community activity and functional diversity can change in soil depending on the species of pine and their age. For this, we used the Biolog EcoPlate (Biolog Inc., Hayward, CA, USA), a culture-dependent method based on multivariate analysis of carbon-substrate usage models, which offers a quick screening method to compare and explore metabolic changes in microbial communities [30,31]. The Biolog EcoPlate system measures the application rates of 31 carbon substrates belonging to six main groups—amino acids, amines, carbohydrates, carboxylic acids, polymers, and phenolic compounds [32]. Biolog EcoPlates support fast-growing organisms and reveal which organisms can utilize the carbon sources they supply. These EcoPlates are also widely used in comparative soil analyses [33,34,35,36,37,38,39,40,41]. In this paper, we describe the results of the EcoPlate method as used to compare changes in the microbial communities and metabolic diversity in native and alien pine stand soils. Throughout the text of this manuscript, functional diversity describes carbon utilization patterns.
In this study, we attempted to answer the following questions: (1) Do different pine species have different effects on the activity and functional diversity of microorganisms in the soil? (2) Do the activity and functional diversity of microorganisms also depend on the age of the pine forest? (3) Do the activity and functional diversity of microorganisms differ in the soils of young pine forests planted on forest land and in sand where there has not previously been any forest?
2. Materials and Methods
2.1. Description of Sites
The Curonian Spit (Lithuanian: Kursiu Nerija) is a 98 km long, thin, curved sand-dune spit that separates the Curonian Lagoon from the Baltic Sea coast (Figure 1). The Curonian Spit is home to the highest moving (drifting) sand dunes in Europe. Coniferous woods are prevalent in the Kursiu Nerija National Park (80%). These woods consist mostly of native Scots pine (Pinus sylvestris L.) and alien mountain pine (Pinus mugo L.). The main dune area is overgrown with trees or has been afforested. The drifting of dunes began in the 16th century due to deforestation of the spit caused by overgrazing and timber harvesting. To stop this process, revegetation began in 1825 with the planting of a non-native species: mountain pine. Mountain pine is a native tree of mountain areas in Central and Southern Europe. Nowadays, forest covers 89% of the spit; it consists mostly of Scots pine (53%) and mountain pine (27%). In favorable conditions, mountain pines can reach 10 m in height, but on the dunes, they grow just 1–2 m high. Even after being blown over in the sand, trees stay alive for several years [42]. The mean annual temperature in the region is 7.4 °C, and the mean annual precipitation is 771 mm. The pine stands grow on a Haplic Arenosol [43] with a thin organic layer and are surrounded by Pinetum vacciniosum forest type.
2.2. Sampling Procedure
In this study, we used a paired-site design. Soil samples were collected at four sampling sites: the Smiltynė (two sites), Juodkrantė, and Neringa forest districts on the Curonian Spit, an approximately 40 km long transect of dunes (Figure 1). We selected 42 sites, grouped in pairs, where pure stands of Pinus sylvestris and P. mugo of the same age grew on the same soil in order to minimize heterogeneity among them (Table A1). In the I–III sites were selected three age classes of trees. The youngest generation ranged from 14 to 20 years, the mature generation ranged from 50 to 65 years, and older generation ranged from 110 to 120 years, representing the 1st, 2nd, and 3rd age classes (according to forest inventory description) and, accordingly, equivalent to juvenile, middle-aged, and mature trees. Each age group was represented by six paired samples of P. sylvestris and P. mugo from each selected site with an area of about 10 × 10 m in I–III sites and one age group (1st age class) was represented by three paired samples in IV site. Explaining the first and second questions (Table A1), soil samples 1–36 (I–III sites) were taken as replicates at different location sites to compare microbial community activity in the soils where pines of different species and ages grow. Explaining the third question, samplings of the 1st age class were taken in different locations to compare microbial community activity in newly established (IV site) and old forest stands (I–III sites). All soil samples were obtained in July 2011.
The soil contained a thin organic layer, so the samples were not divided into different layers, and the uppermost 10 cm was sampled. After the top layer of litter was removed, six to eight scoops were randomly collected at each site to obtain soil samples, with a minimum of 1 kg of soil collected per sampling site. Composite samples were taken at each of the sites to form a triangle around the tree trunks (with a distance between points of more than 5 m) under P. sylvestris and P. mugo stands. The soil samples were thoroughly mixed, placed in tightly closed plastic bags, and stored at 4 °C to keep them moist for microbiological analysis. The soil moisture content was determined gravimetrically by drying soil samples at 105 °C. All microbial determinations were performed the next day after collection.
2.3. Soil Chemical Analysis, Enzymatic Activity, and Fungi Abudance
The soil chemical studies, enzyme activity, and fungal abundance of the studied plots were described and discussed in an article by Janušauskaitė et al. [29]. They measured soil pH, carbon content (C), nitrogen (N), concentration of water-soluble carbohydrates (WSC), crude fibre (CF), acid detergent lignin (ADL), ash, major elements (Na, K, Ca and Mg), phosphorus (P), dehydrogenase, urease, protease, alkaline phosphatase, potential nitrification, and fungi abundance.
2.4. Biolog Assay
We used Biolog EcoPlates (Biolog Inc., Hayward CA, USA) to characterize the functional diversity of the microbial communities based on the utilization of 31 carbon substrates. Each plate had three replicates of the carbon substrates and control wells. The substrates were grouped as follows: AA: amino acids (L-arginine, L-asparagine, L-phenylalanine, L-serine, L-threonine, and glycyl-L-glutamic acid); A: amines and amides (phenylethylamine and putrescine); CH: carbohydrates (D-cellobiose, α-D-lactose, β-methyl-Dglucoside, D-xylose, i-erythritol, D-mannitol, N-acetyl-D-glucosamine, glucose-1-phosphate, D,L-α-glycerol phosphate, and D-galactonic acid-γ-lactone); CA: carboxylic acids (γ-hydroxybutyric acid, itaconic acid, α-ketobutyric acid, D-malic acid, D-galacturonic acid, pyruvic acid methyl ester, and D-glucosaminic acid); PC: phenolic compounds (2-hydroxy benzoic acid and 4-hydroxybenzoic acid); and P: polymers (alfa-cyclodextrin, glycogen, Tween 40, and Tween 80) [32]. Carbon-substrate utilization rates were generated by inoculating samples into the plate wells; the rate of utilization was indicated by the inoculation of tetrazolium violet, a redox indicator dye, which changed from colorless to purple [34].
The analysis was carried out as described previously [44], according to Protocol 1. The soil suspension was diluted in 45 mL of sterile saline (NaCl, 0.85%) with 5 g of 3 mm glass beads on a rotary shaker at 300 r min1 for 30 min at 25 °C. The suspensions were allowed to settle for 5 min before 10-fold diluted samples were prepared. Aliquots of 100 μL of dilution were added to each well of the plate. The well absorbance at 590 nm was read every 24 h using a spectrophotometer (microplate Reader Multiskan LABSYSTEMS, Finland). Absorption values were recorded at 24, 48, 72, 96, 120, 144, and 168 h.
2.5. Data Analysis
The average well color development (AWCD) was calculated for each plate at each reading time. The 168 h absorbance data were used for analysis as at this point, intensive metabolism of the different substrates was observed.
where Cw is the color production within each well, B is the absorption value in the control well, and n is the total number of carbon substrates.
Various indicators of various aspects of the functional diversity of microorganisms have been used to measure biodiversity. The Shannon’s (H′) and Simpson’s (1/D) indices include measurements of community heterogeneity. H′ is used to describe the disorder and uncertainty of individual species: the higher the value, the higher the diversity. The index values are between 0.0 and 5.0. Results are generally between 1.5 and 3.5, and they exceed 4.5 very rarely [44,45]. Values above 3.0 indicate that the structure of the habitat is stable and balanced; values under 1.0 indicate that pollution and degradation of the habitat structure are present. The Shannon diversity index is highly dependent on the species richness of the community. This index is applied to biological systems based on the mathematical formula used by Shannon in the field of communications in 1948. This is the most preferred index among the diversity indices [46,47].
where H′ is the Shannon diversity index, ni is the number of active wells belonging to i carbon substrates where the (ODi) value reached 0.25 [48], and N is the sum of all ni.
The Pielou evenness index (E) was derived from the Shannon index by Pielou in 1966 [49]. The ratio of the observed value of Shannon index to the maximum value gives the Pielou evenness index.
where S is the substrate richness (the total number of carbon substrates used).
The Simpson index (D) shows the most common species in the community [50]. It is a diversity index that was derived by Simpson in 1949 [46,47]. Simpson’s reciprocal index (1/D) starts with 1 as the lowest possible value [45]. This figure would represent a microbial community containing only one carbon source. The higher the value, the greater the diversity. The maximum value is the number of carbon sources in the sample. The Simpson reciprocal index is calculated as [45].
The McIntosh diversity (Mc) indicates the homogeneity of the distribution of the microorganisms that use different carbon sources [47,51].
Statistical analysis of the substrate-related diversity indices was performed via two-way ANOVA using SAS 9.4 software, GLM procedure (SAS, Cary, NC, USA). The model in the GLM procedure was factorial ANOVA with interaction, with the assumption that all effects are fixed. Multiple comparisons of means were performed via Waller–Duncan K-ratio t test. Redundancy analysis (RDA) via XLSTAT software (Addinsoft, Paris, France) was used to seek the combinations of explanatory variables (age class, species) that best explained the variation of the dependent matrix (various carbon sources).
3. Results
3.1. Dependence of Microorganism Activity and Functional Diversity on Pine Species and Age Class
According to the BIOLOG data the metabolic activity rates of microorganisms did not differ (p > 0.05) (Table 1). The Average well color development (AWCD) was 0.96–1.61 times higher for the soil under P. sylvestris than for the soil under P. mugo. Substrate richness (S) did not differ significantly between the pine species (p > 0.05). It was 1.12–1.16 times greater in the soil under P. sylvestris, and it was significantly different between age classes (p < 0.05). In soils of the third age class, S was 1.3 times greater than in those of the first class. Shannon’s diversity index (H′) in pine stand soils ranged from 2.7 to 3.12 and was not significantly greater in P. sylvestris stand soils. The Pielou evenness (E) results showed that all data displayed evenness. Simpson’s reciprocal diversity index (1/D) showed statistically different diversity of microorganisms between the pine species stand soils (p < 0.05), and the index value was 1.2 times greater in the soil under P. sylvestris than in that under P. mugo. The McIntosh diversity index (Mc) showed homogeneity between the various microorganisms that use different carbon sources in all pine stand soils. The Waller–Duncan K-ratio t test showed significant differences between the S, H′, and 1/D indices for the first and third age groups, and the second age group took an intermediate position.
3.2. Interactions beween Microorganisms that Use Different Carbon-Source Groups and Different Pine Species and Age Classes
RDA analysis showed that axis F1 carried 97.73% of the constrained inertia, which was 11.10% of the total inertia. Together, axes F1 and F2 carried 100% of the constrained inertia, which corresponded to 11.36% of the total inertia (Table 2).
As indicated by the canonical correlation coefficients, the greatest dependence between categorical variables was on age class (0.63) (Figure 2). This showed that in the pine stand soil, the concentrations of P and PC that were used by microorganisms in the soil depended on pine stand age. The species of pine had no relationship with the different use rates of carbon sources by microorganisms in the pine stand soil.
3.3. Dependence of Microorganism Activity in Newly Established and Old Stands
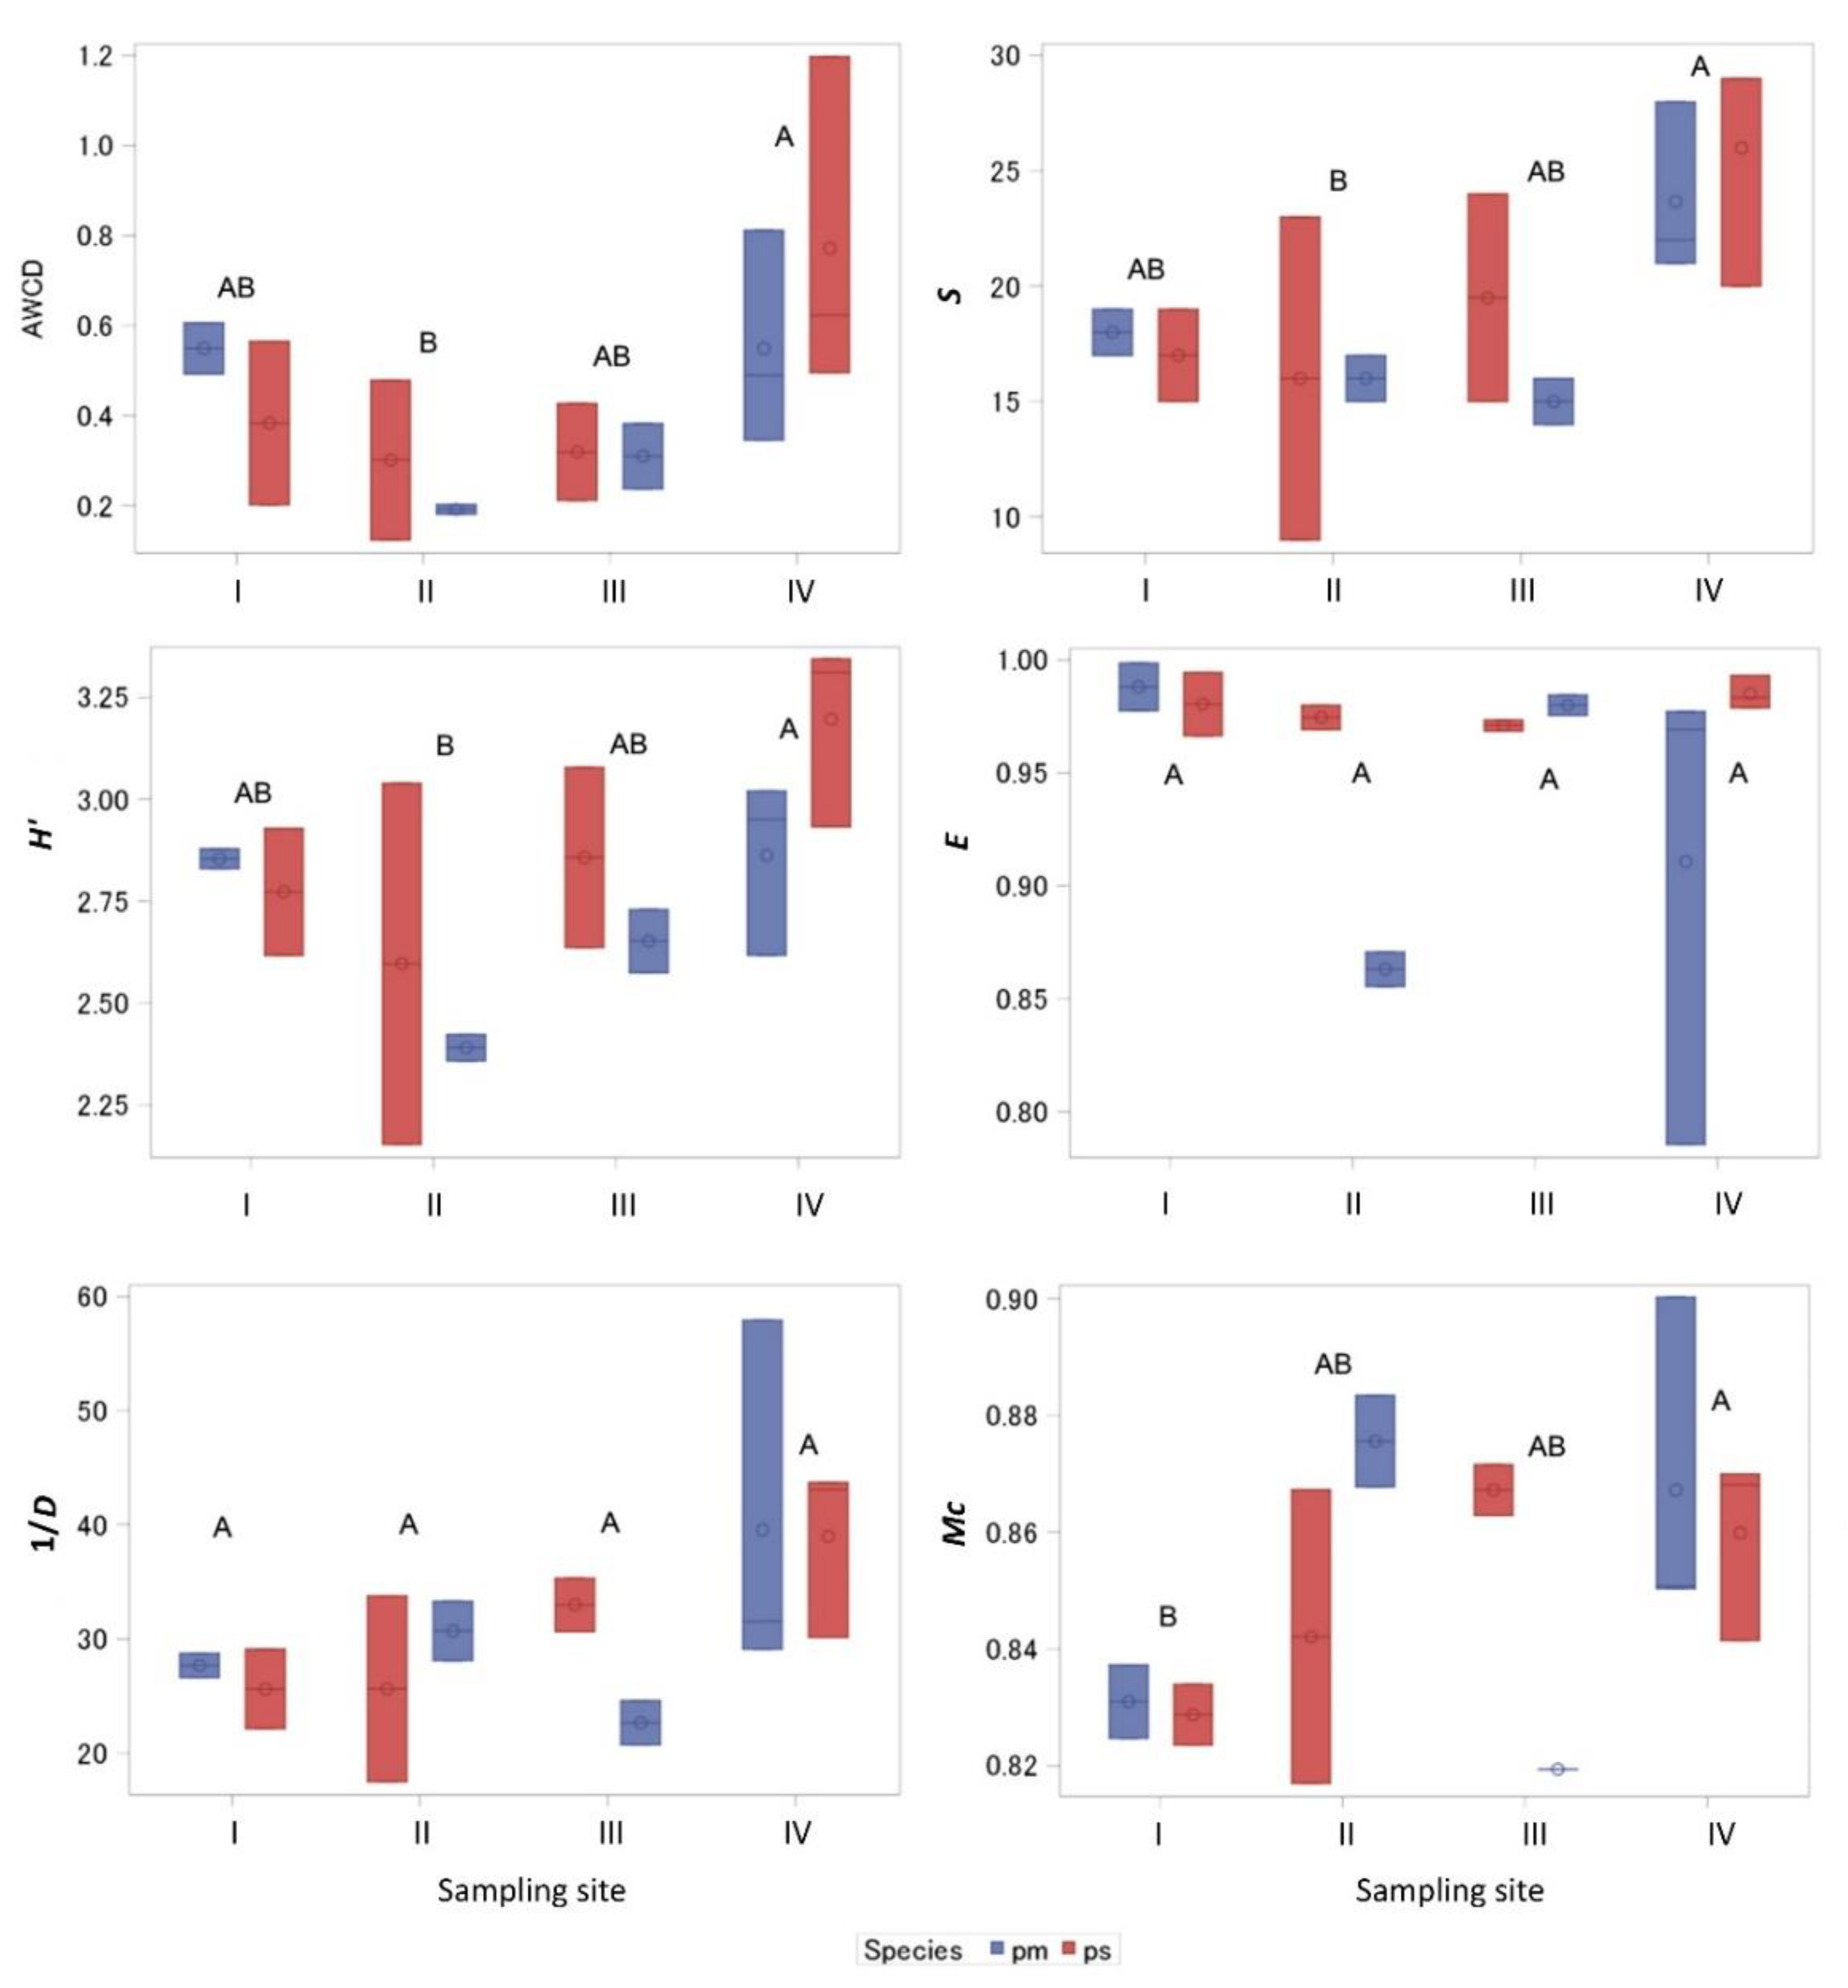
According to the BIOLOG data, the AWCD of the metabolic activity of microorganisms was significantly different between sites (p < 0.05), and it was on average 2.68 times bigger in the IV than in the II site soil (Figure 3). S differed significantly between the II and IV site soils (p > 0.05), where it was on average 1.55 times higher in IV site soil. The H′ value in the IV site soil was 1.21 times higher than that in II site soil. The E values showed that across all sites, the separate data displayed evenness. The Simpson index values (1/D) did not differ among the soils from all stands. The McIntosh diversity index (Mc) showed that the homogeneity of microorganisms in the I pine stand soil was 2.9 and 2.5% (in P. mugo and P. sylvestris stand soils, respectively) less than that from the IV site.
In the P. mugo sites, the utilized soil microbial carbon sources were 1.04–1.59 times greater in the newly established site (IV site) than in the other sites, and in the P. sylvestris sites, they were 1.41–2.63 times greater (Figure 4).
4. Discussions
This study consistent with our previously published study in the Curonian Spit, where the rate of needle litter decomposition, chemical soil composition, enzyme activity, and fungal abundance in the same plots were assessed [29]. This allowed a deeper assessment of the natural processes taking place in sand dunes.
In this study, we found that index H’ ranged between 2.7 and 3.12, and showed that the microorganisms that use carbon sources were stable and balanced [47] with a slightly higher functional diversity in Pinus sylvestris stand soil. The 1/D index ranged between 35.33 and 52.44, showing a high diversity of microbial communities in the studied soil stands. There were significant differences in the functional diversity of soil microorganisms depending on whether they were from P. sylvestris or P. mugo soils. However, in our previous study we found that the soil C and N concentrations were higher in the soil under P. sylvestris, than under P. mugo and that the pH was slightly lower. The activity of enzymes was significantly higher for P. sylvestris soil in the case of dehydrogenases. There were the same significant differences in the abundance of fungi [29]. These pine forests also differ in terms of their grassy vegetation. The native P. sylvestris stands are dominated by herbaceous vegetation, while herbaceous vegetation is rare in the P. mugo stands, which are dominated by mosses and lichens [52]. On the other hand, the metabolic activity and functional diversity of microorganisms in the soil under different species of pines did not differ much. Our analysis suggests that alien plant invasions may result in a sampling effect where ecosystem production is driven by the addition of a single highly productive species, even if the overall species diversity declines [8,9,27]. Alien plant species can reduce the species diversity of native plants by changing the composition of the existing ecosystem.
In analyzing the parameters of microorganism activity and functional diversity in pine soils of different ages, significant statistical differences between the S and H’ parameters were obtained. The influence of stand age on the activity of soil microorganisms was examined by RDA analysis. The separate carbon compound groups (AA, A, P, PC, CH, and CA) were studied with regard to pine species and ages. The results show that in the pine stands, microorganism activity based on the use of organic P and PC compounds in the soil mostly depended on pine stand age. Supplementing these studies with previously published observations, we can highlight that most of the measured soil parameters (C, N, C/N ratio, P or soil, enzymes activity, fungi abundance) increased with stand age [28]. This suggests that ecosystems change with increasing tree age; activity and functional diversity of microorganisms depend on the age of the pine forests. Bauhus [53] reported the influence of tree age on the properties of microorganisms and found that the effect of tree species on soil biological properties was small and was generally not significant for young soils. It is common that the accumulation of organic layers after the establishment of pines to be a long-term process. When P. mugo grows for more than 100 years, the organic layer grows by more than 10 cm [54]. It can be assumed that a period of approximately 100–120 years is sufficient for pine forests in newly planted areas to produce clear differences in soil characteristics.
In studying how the activity and functional diversity of microorganisms differ in the soils of young pine forests planted on forest land (I–III sites) and in sand where there was no forest before (IV site), it was found that the stands where pines had begun to grow recently were distinguished by significantly higher rates of microbial activity based on S and H′. We found that in sand growing pines stands, the activity of microorganisms that used different carbon sources was about twice as high as in other stands where pines had grown for many years. Shipper et al. [55] noticed that functional diversity was initially low in non-planted (underdeveloped) areas, but increased rapidly as vegetation was established, and decreased in older successions. This is consistent with the findings of our study. The activity and functional diversity of microorganisms in dunes may have been higher due to ongoing natural selection in newly pine-occupied areas [56].
5. Conclusions
The Simpson’s reciprocal diversity index of microorganisms that use carbon compounds in the soil in stands of native P. sylvestris was found to be significantly higher than that of equivalent microorganisms in alien P. mugo stand soil. Furthermore, the Shannon diversity of these microorganisms was found to increase with the age of stands. Its value was lowest in young pine stand soils and highest in mature pine stand soils. The use of multiple indices helped us to better assess our data; for instance, H′ revealed differences in the functional diversity of microorganisms in the soils of pine stands of different ages while 1/D showed significant differences between the functional diversity of microorganisms in the soils of different pine species stands. Summarizing this and the findings of our previous study [29], we can assume that the alien P. mugo and the native P. sylvestris have different effects on soil. Altered soil chemical composition, lower enzyme activity and fungal abundance [29], and lower functional diversity of microorganisms, can affect the ecosystem in the long run with possibility of problems associated with invasive growth. This study supplemented existing knowledge on the metabolic activity of microorganisms and their functional diversity in different pine forests in the Curonian Spit. In the future, this study should be extended to include DNA extraction, targeted marker gene amplification, and sequencing to determine microbial community composition. This would help to assess not only the functional diversity of soil microorganisms but also the differences in taxonomic diversity.
Author Contributions
Conceptualization, V.B. and D.J.; Data curation, V.B.; Formal analysis, G.J.; Funding acquisition, V.B.; Investigation, D.J. and V.B.; Methodology, V.B. and D.J.; Project administration, Resources, Supervision, and Validation V.B.; Writing-original draft G.J. All authors have read and agreed to the published version of the manuscript.
Funding
This research received no external funding.
Acknowledgments
Long-term state-budget-funded research project “Genetic determination of the traits of agricultural and forest plants, development of modern cultivars”.
Conflicts of Interest
The authors declare no conflict of interest.
Appendix A

Table A1.
Location of sampling sites on the Curonian Spit, Lithuania.
| No. | Species | Place of Sampling | Age Class * | Location Sites of Samplings ** | Latitude *** N | Longitude E | Altitude (m) |
|---|---|---|---|---|---|---|---|
| 1 | Pinus mugo | 1 | 2 | I | 55°35′03.02″ | 21°07′29.49″ | 24 |
| 2 | P. sylvestris | 1 | 2 | I | 55°35′03.02″ | 21°07′29.49″ | 24 |
| 3 | P. mugo | 2 | 1 | I | 55°34′21.45″ | 21°06′55.71″ | 12 |
| 4 | P. sylvestris | 2 | 1 | I | 55°34′21.45″ | 21°06′55.71″ | 12 |
| 5 | P. mugo | 3 | 1 | I | 55°33′47.79″ | 21°06′23.44″ | 2 |
| 6 | P. sylvestris | 3 | 1 | I | 55°33′47.79″ | 21°06′23.44″ | 2 |
| 7 | P. sylvestris | 4 | 3 | I | 55°33′00.90″ | 21°06′38.22″ | 27 |
| 8 | P. mugo | 4 | 3 | I | 55°33′12.58″ | 21°06′45.52″ | 36 |
| 9 | P. mugo | 5 | 3 | I | 55°31′10.56″ | 21°06′03.25″ | 12 |
| 10 | P. sylvestris | 5 | 3 | I | 55°31′10.56″ | 21°06′03.25″ | 12 |
| 11 | P. mugo | 6 | 2 | I | 55°29′00.19″ | 21°05′02.58″ | 3 |
| 12 | P. sylvestris | 6 | 2 | I | 55°29′00.19″ | 21°05′02.58″ | 3 |
| 13 | P. sylvestris | 7 | 3 | II | 55°24′37.82″ | 21°04′52.43″ | 9 |
| 14 | P. mugo | 7 | 3 | II | 55°24′37.82″ | 21°04′52.43″ | 9 |
| 15 | P. sylvestris | 8 | 3 | II | 55°22′40.81″ | 21°03′32.80″ | 20 |
| 16 | P. mugo | 8 | 3 | II | 55°22′40.81″ | 21°03′32.80″ | 20 |
| 17 | P. sylvestris | 9 | 2 | II | 55°19′34.07″ | 21°01′13.37″ | 10 |
| 18 | P. mugo | 9 | 2 | II | 55°19′34.07″ | 21°01′13.37″ | 10 |
| 19 | P. sylvestris | 10 | 1 | II | 55°19′24.14″ | 21°01′00.62″ | 10 |
| 20 | P. mugo | 10 | 1 | II | 55°19′24.14″ | 21°01′00.62″ | 10 |
| 21 | P. mugo | 11 | 1 | II | 55°19′15.61″ | 21°00′50.09″ | 11 |
| 22 | P. sylvestris | 11 | 1 | II | 55°19′15.61″ | 21°00′50.09″ | 11 |
| 23 | P. mugo | 12 | 2 | II | 55°18′12.73″ | 20°59′33.97″ | 26 |
| 24 | P. sylvestris | 12 | 2 | II | 55°18′12.73″ | 20°59′33.97″ | 26 |
| 25 | P. sylvestris | 13 | 3 | III | 55°35′23.10″ | 21°07′37.10″ | 10 |
| 26 | P. mugo | 13 | 3 | III | 55°35′23.10″ | 21°07′37.10″ | 10 |
| 27 | P. mugo | 14 | 2 | III | 55°37′48.95″ | 21°06′52.52″ | 5 |
| 28 | P. sylvestris | 14 | 2 | III | 55°37′48.95″ | 21°06′52.52″ | 5 |
| 29 | P. sylvestris | 15 | 1 | III | 55°40′46.44″ | 21°07′14.33″ | 16 |
| 30 | P. mugo | 15 | 1 | III | 55°40′46.44″ | 21°07′14.33″ | 16 |
| 31 | P. sylvestris | 16 | 1 | III | 55°40′46.12″ | 21°07′42.89″ | 13 |
| 32 | P. mugo | 16 | 1 | III | 55°40′46.12″ | 21°07′42.89″ | 13 |
| 33 | P. sylvestris | 17 | 3 | III | 55°40′42.68″ | 21°07′59.21″ | 4 |
| 34 | P. mugo | 17 | 3 | III | 55°40′42.68″ | 21°07′59.21″ | 4 |
| 35 | P. sylvestris | 18 | 2 | III | 55°41′04.85″ | 21°06′39.80″ | 9 |
| 36 | P. mugo | 18 | 2 | III | 55°41′04.85″ | 21°06′39.80″ | 9 |
| 37 | P. mugo | 19 | 1 | IV | 55°41′52.84″ | 21°06′04.28″ | 4 |
| 38 | P. sylvestris | 19 | 1 | IV | 55°41′52.84″ | 21°06′04.28″ | 4 |
| 39 | P. mugo | 20 | 1 | IV | 55°42′38.36″ | 21°05′58.94″ | 5 |
| 40 | P. sylvestris | 20 | 1 | IV | 55°42′38.36″ | 21°05′58.94″ | 5 |
| 41 | P. mugo | 21 | 1 | IV | 55°42′36.05″ | 21°05′48.84″ | 3 |
| 42 | P. sylvestris | 21 | 1 | IV | 55°42′36.05″ | 21°05′48.84″ | 3 |
* 1—14 to 20 year old juvenile trees, 2—50 to 65 year old middle-aged trees, 3—110 to 120 year old mature trees. ** I-Juodkrante forest enterprise, II-Nida forest enterprise, III-Smiltyne forest enterprise 1st site, IV-Smiltyne forest enterprise, 2nd site. *** WGS-84 LMS coordinate system.
References
- UNESCO (United Nations Educational Scientific and Cultural Organization). Coronian Spit. Available online: https://whc.unesco.org/en/list/994/ (accessed on 15 March 2020).
- Von Wichdorf, H. Geologie der Kurischen Nehrung; Preussische Geologische Landesanstallt: Berlin, Germany, 1919; p. 198. (In German) [Google Scholar]
- Genys, J.B. Management of coastal dunes on the Curonian Spit—Neringa. In Coastal Conservation and Management in the Baltic Region. In Proceedings of the EUCC-WWF Conference Rīga–Klaipėda–Kaliningrad, Klaipėda, Lithuania, 3–7 May 1994; Gudelis, V., Ed.; University Publishers: Klaipėda, Lithuania, 1995; pp. 211–218. [Google Scholar]
- Cleary, M.; Laas, M.; Oskay, F.; Drenkhan, R. First report of Lecanosticta acicola on non-native Pinus mugo in southern Sweden. For. Pathol. 2019, 49, e12507. [Google Scholar] [CrossRef]
- Strakauskaite, N. Klaipeda and the Curonian Spit Guide; R. Paknio Publishing: Klaipeda, Lithuania, 2004; p. 80. ISBN 9986-830-87-7. [Google Scholar]
- Aučina, A.; Rudawska, M.; Leski, T.; Ryliškis, D.; Pietras, M.; Riepšas, E. Ectomycorrhizal fungal communities on seedlings and conspecific trees of Pinus mugo grown on the coastal dunes of the Curonian Spit in Lithuania. Mycorrhiz 2011, 21, 237–245. [Google Scholar] [CrossRef] [PubMed] [Green Version]
- Gaigalas, A.; Pazdur, A. Chronology of buried soils, forest fires and extreme migration of dunes on the Kuršių nerija spit (Lithuanian coast). Landf. Anal. 2008, 9, 187–191. [Google Scholar]
- Vilà, M.; Espinar, J.L.; Hejda, M.; Hulme, P.E.; Jarošík, V.; Maron, J.L.; Pergl, J.; Schaffner, U.; Sun, Y.; Pyšek, P. Ecological impacts of invasive alien plants: A meta-analysis of their effects on species, communities and ecosystems. Ecol. Lett. 2011, 14, 702–708. [Google Scholar] [CrossRef] [PubMed]
- Van Kleunen, M.; Weber, E.; Fischer, M. A meta-analysis of trait differences between invasive and non-invasive plant species. Ecol. Lett. 2010, 13, 235–245. [Google Scholar] [CrossRef] [PubMed] [Green Version]
- Vilà, M.; Weiner, J. Are invasive plant species better competitors than native plant species?—Evidence from pair-wise experiments. Oikos 2004, 105, 229–238. [Google Scholar] [CrossRef]
- Maron, J.L.; Marler, M. Field-based competitive impacts between invaders and natives at varying resource supply. J. Ecol. 2008, 96, 1187–1197. [Google Scholar] [CrossRef]
- Niu, H.B.; Liu, W.X.; Wan, F.H.; Liu, B. An invasive aster (Ageratina adenophora) invades and dominates forest understories in China: Altered soil microbial communities facilitate the invader and inhibit natives. Plant Soil 2007, 294, 73–85. [Google Scholar] [CrossRef]
- Wu, H.; Lin, J.M.; Zhang, J.B. Allelopathic effects of Eucalyptus salubris F. Muell and E. Brockwayii CA gardner on germination and seedlings growth of prairie ground cherry (Physalis hederifolia A. Gray). Allelopath. J. 2019, 46, 109–119. [Google Scholar] [CrossRef]
- Hawkes, C.V.; Wren, I.F.; Herman, D.J.; Firestone, M.K. Plant invasion alters nitrogen cycling by modifying the soil nitrifying community. Ecol. Lett. 2005, 8, 976–985. [Google Scholar] [CrossRef]
- Batten, K.M.; Scow, K.M.; Davies, K.F.; Harrison, S.P. Two invasive plants alter soil microbial community composition in serpentine grasslands. Biol. Invasions 2006, 8, 217–230. [Google Scholar] [CrossRef]
- Broz, A.K.; Manter, D.K.; Vivanco, J.M. Soil fungal abundance and diversity: Another victim of the invasive plant Centaurea maculosa. ISME J. 2007, 1, 763–765. [Google Scholar] [CrossRef] [PubMed] [Green Version]
- Kourtev, P.S.; Ehrenfeld, J.G.; Häggblom, M. Exotic plant species alter the microbial community structure and function in the soil. Ecology 2002, 83, 3152–3166. [Google Scholar] [CrossRef]
- Liao, J.D.; Boutton, T.W. Soil microbial biomass response to woody plant invasion of grassland. Soil Biol. Biochem. 2008, 40, 1207–1216. [Google Scholar] [CrossRef] [Green Version]
- Majewska, M.L.; Błaszkowski, J.; Nobis, M.; Rola, K.; Nobis, A.; Łakomiec, D.; Czachura, P.; Zubek, S. Root-inhabiting fungi in alien plant species in relation to invasion status and soil chemical properties. Symbiosis 2015, 65, 101–115. [Google Scholar] [CrossRef] [Green Version]
- Thoms, C.; Gleixner, G. Seasonal differences in tree species’ influence on soil microbial communities. Soil Biol. Biochem. 2013, 66, 239–248. [Google Scholar] [CrossRef]
- Thorpe, A.S.; Callaway, R.M. Interactions between invasive plants and soil ecosystem: Positive feedbacks and their potential to persist. In Conceptual Ecology and Invasion Biology: Reciprocal Approaches to Nature; Springer: Dordrecht, The Netherlands, 2006; pp. 323–341. [Google Scholar] [CrossRef]
- Boudsocq, S.; Niboyet, A.; Lata, J.C.; Raynaud, X.; Loeuille, N.; Mathieu, J.; Blouin, M.; Abbadie, L.; Barot, S. Plant preference for ammonium versus nitrate: A neglected determinant of ecosystem functioning? Am. Nat. 2012, 180, 60–69. [Google Scholar] [CrossRef] [Green Version]
- Callaway, R.M.; Cipollini, D.; Barto, K.; Thelen, G.C.; Hallett, S.G.; Prati, D.; Stinson, K.; Klironomos, J. Novel weapons: Invasive plant suppresses fungal mutualists in America but not in its native Europe. Ecology 2008, 89, 1043–1055. [Google Scholar] [CrossRef] [Green Version]
- Wolfe, B.E.; Klironomos, J.N. Breaking new ground: Soil communities and exotic plant invasion. Bioscience 2005, 55, 477–487. [Google Scholar] [CrossRef]
- Rodgers, V.L.; Wolfe, B.E.; Werden, L.K.; Finzi, A.C. The invasive species Alliaria petiolata (garlic mustard) increases soil nutrient availability in northern hardwood-conifer forests. Oecologia 2008, 157, 459–471. [Google Scholar] [CrossRef]
- Weidenhamer, J.D.; Callaway, R.M. Direct and indirect effects of invasive plants on soil chemistry and ecosystem function. J. Chem. Ecol. 2010, 36, 59–69. [Google Scholar] [CrossRef] [PubMed]
- Wu, B.; Wang, S.; Wei, M.; Zhou, J.; Jiang, K.; Du, D.; Wang, C. The invasive tree staghorn sumac affects soil N2-fixing bacterial communities in north China. Plant Biol. 2019, 21, 951–960. [Google Scholar] [CrossRef] [PubMed]
- Leege, L.M.; Murphy, P.G. Ecological effects of the non-native Pinus nigra on sand dune communities. Can. J. Bot. 2001, 79, 429–437. [Google Scholar] [CrossRef]
- Janušauskaitė, D.; Baliuckas, V.; Dabkevičius, Z. Needle litter decomposition of native Pinus sylvestris L. and alien Pinus mugo at different ages affecting enzyme activities and soil properties on dune sands. Balt. For. 2013, 19, 50–60. Available online: https://www.balticforestry.mi.lt/bf/PDF_Articles/2013-19[1]/Janusauskaite%20Dalia.pdf (accessed on 4 March 2020).
- Garland, J.L.; Mills, A.L. Classification and characterization of heterotrophic microbial communities on the basis of patterns of community-level sole-carbon-source utilization. Appl. Environ. Microbiol. 1991, 57, 2351–2359. Available online: https://aem.asm.org/content/57/8/2351.short (accessed on 6 March 2020). [CrossRef] [Green Version]
- Garland, J.L. Analysis and interpretation of community-level physiological profiles in microbial ecology. FEMS Microbiol. Ecol. 1997, 24, 289–300. [Google Scholar] [CrossRef]
- Insam, H. A new set of substrates proposed for community characterization in environmental samples. In Microbial Communities: Functional Versus Structural Approaches; Insam, H., Rangger, A., Eds.; Springer: Insbruck, Austria, 1997; pp. 259–260. [Google Scholar]
- Konopka, A.; Oliver, L.; Turco, R.F., Jr. The use of carbon substrate utilization patterns in environmental and ecological microbiology. Microb. Ecol. 1998, 35, 103–115. [Google Scholar] [CrossRef]
- Preston-Mafham, J.; Boddy, L.; Randerson, P.F. Analysis of microbial community functional diversity using sole-carbon-source utilisation profiles–a critique. FEMS Microbiol. Ecol. 2002, 42, 1–14. [Google Scholar] [CrossRef]
- Stefanowicz, A. The Biolog Plates Technique as a Tool in Ecological Studies of Microbial Communities. Pol. J. Environ. Stud. 2006, 15, 669–676. Available online: https://pdfs.semanticscholar.org/8d94/dc356ca20c5e5521fbebb252343d428032c0.pdf (accessed on 10 March 2020).
- Kumar, U.; Shahid, M.; Tripathi, R.; Mohanty, S.; Kumar, A.; Bhattacharyya, P.; Lala, B.; Gautama, P.; Rajaa, R.; Pandaa, B.B.; et al. Variation of functional diversity of soil microbial community in sub-humid tropical rice-rice cropping system under long-term organic and inorganic fertilization. Ecol. Indic. 2017, 73, 536–543. [Google Scholar] [CrossRef]
- Kaneda, S.; Krištůfek, V.; Baldrian, P.; Malý, S.; Frouz, J. Changes in functional response of soil microbial community along chronosequence of spontaneous succession on post mining forest sites evaluated by Biolog and SIR methods. Forests 2019, 10, 1005. [Google Scholar] [CrossRef] [Green Version]
- Garau, G.; Morillas, L.; Roales, J.; Castaldi, P.; Mangia, N.P.; Spano, D.; Mereu, S. Effect of monospecific and mixed Mediterranean tree plantations on soil microbial community and biochemical functioning. Appl. Soil Ecol. 2019, 140, 78–88. [Google Scholar] [CrossRef]
- Song, B.; Chen, M.; Ye, S.; Xu, P.; Zeng, G.; Gong, J.; Li, J.; Zhang, P.; Cao, W. Effects of multi-walled carbon nanotubes on metabolic function of the microbial community in riverine sediment contaminated with phenanthrene. Carbon 2019, 144, 1–7. [Google Scholar] [CrossRef]
- Zhao, M.; Yin, C.; Tao, Y.; Li, C.; Fang, S. Diversity of soil microbial community identified by Biolog method and the associated soil characteristics on reclaimed Scirpus mariqueter wetlands. SN Appl. Sci. 2019, 1, 1408. [Google Scholar] [CrossRef] [Green Version]
- Chavan, S.; Nadanathangam, V. Shifts in metabolic patterns of soil bacterial communities on exposure to metal engineered nanomaterials. Ecotoxicol. Environ. Saf. 2020, 189, 110012. [Google Scholar] [CrossRef] [PubMed]
- Motiekaityte, V. Changes of sand dune plan communities of the Lithuanian coastal zone in the 20th century. Ekologija 2000, 1, 7–15. [Google Scholar]
- WRB; IUSS Working Group; FAO ISRIC. World Reference Base for Soil Resources 2006; FAO: Rome, Italy, 2006; Volume 103, p. 145. [Google Scholar]
- Insam, H.; Goberna, M. Use of Biolog® for the community level physiological 451 profiling (CLPP) of environmental samples. Mol. Microb. Ecol. Man. 2008, 452, 853–860. [Google Scholar]
- Okpiliya, F.I. Ecological diversity indices: Any hope for one again. J. Environ. Earth Sci. 2012, 2, 45–52. [Google Scholar]
- Mandaville, S.M. Benthic Macroinvertebrates in Freshwater—Taxa Tolerance Values, Metrics, and Protocols, Project H-1. (Nova Scotia: Soil & Water Conservation Society of Metro Halifax). 2002. Available online: http://citeseerx.ist.psu.edu/viewdoc/download?doi=10.1.1.516.2776&rep=rep1&type=pdf (accessed on 17 March 2020).
- Türkmen, G.; Kazancı, N. Applications of various diversity indices to benthic macroinvertebrate assemblages in streams of an atural park in Turkey. Rev. Hidrobiol. 2010, 32, 111125. Available online: https://d1wqtxts1xzle7.cloudfront.net/3935006/ffp-1765.pdf (accessed on 17 March 2020).
- Weber, K.P.; Gehder, M.; Legge, R.L. Assessment of changes in the microbial community of constructed wetland mesocosms in response to acid mine drainage exposure. Water Res. 2008, 42, 180–188. [Google Scholar] [CrossRef]
- Pielou, E.C. The measurement of diversity in different types of biological collections. J. Theor. Biol. 1966, 13, 131–144. [Google Scholar] [CrossRef]
- Zhao, Y.; Liu, B.; Zhang, W.; Hu, C.; An, S. Effects of plant and influent C: N: P ratio on microbial diversity in pilot-scale constructed wetlands. Ecol. Eng. 2010, 36, 441–449. [Google Scholar] [CrossRef]
- McIntosh, R.P. An index of diversity and the relation of certain concepts to diversity. Ecology 1967, 48, 392–404. Available online: http://www.jstor.org/stable/1932674?origin=JSTOR-pdf (accessed on 17 March 2020).
- Augustaitis, A.; Kliučius, A. Kuršių Nerijos nacionalinio parko pušynų būklės dinamika [An analysis of pine stands health in Curonian Spit Kuršių Nerija National Park]. Miškinikystė For. Sci. 1996, 1, 5–12, (In Lithuanian with English summary). [Google Scholar]
- Bauhus, J.; Pare, D. Effects of tree species, stand age and soil type on soil microbial biomass and its activity in a southern boreal forest. Soil Biol. Biochem. 1998, 30, 1077–1089. [Google Scholar] [CrossRef]
- Dirnböck, T.; Dullinger, S.; Köck, R. Organic matter accumulation following Pinus mugo Turra establishment in subalpine pastures. Plant. Ecol. Divers. 2008, 1, 59–66. [Google Scholar] [CrossRef]
- Schipper, L.A.; Degens, B.P.; Sparling, G.P.; Duncan, L.C. Changes in microbial heterotrophic diversity along five plant successional sequences. Soil Biol. Biochem. 2001, 33, 2093–2103. [Google Scholar] [CrossRef]
- Verhoeven, R. Response of soil microfauna to organic fertilisation in sandy virgin soils of coastal dunes. Biol. Fertil. Soils 2001, 34, 390–396. [Google Scholar] [CrossRef]
Figure 1.
The Curonian Spit. Locations of sampling sites: I-Juodkrante forest enterprise, II-Nida forest enterprise, II-Smiltyne I forest enterprise, IV-Smiltyne II forest enterprise. We used Geoportal.lt (Geoportal.lt, Vilnius, Lithuania) maps.
Figure 1.
The Curonian Spit. Locations of sampling sites: I-Juodkrante forest enterprise, II-Nida forest enterprise, II-Smiltyne I forest enterprise, IV-Smiltyne II forest enterprise. We used Geoportal.lt (Geoportal.lt, Vilnius, Lithuania) maps.

Figure 2.
Dependence of different carbon sources (indicated by average well color development (AWCD) on age class and pine species. Carbon substrate groups: AA: amino acids; A: amines and amides; P: polymers; PC: phenolic compounds; CA: carboxylic acids; CH: carbohydrates; Redundancy analysis (RDA).

Figure 3.
Mean indices (± SD) of metabolic activity of microorganisms in mineral soil (at 0–10 cm depth) around Pinus mugo (pm) and Pinus sylvestris (ps) in different stands. AWCD: the average well color development; S: substrate richness; H′—Shannon’s diversity index, E: Pielou Evenness; 1/D: Simpson’s reciprocal diversity index; Mc: McIntosh diversity index. Capital letters show differences between stands, determined via Waller–Duncan K-ratio t test.

Figure 4.
The AWCD of different microbial carbon-source groups in mineral soil (at 0–10 cm depth) around Pinus mugo and P. sylvestris stands at different sites. Stands: pm1: I-III sites of P. mugo; ps1: I-III sites of P. sylvestris; pm2: IV sites of P. mugo; ps2: IV sites of P. sylvestris. Carbon substrate groups: AA: amino acids; A: amines and amides; P: polymers; PC: phenolic compounds; CA: carboxylic acids; CH: carbohydrates.

Table 1.
Mean indices (± SD) of the metabolic activity of microorganisms in mineral soil (at 0–10 cm depth) at different growth sites. (Two-way ANOVA test, bold numbers show significant differences, n = 3.)
Table 1.
Mean indices (± SD) of the metabolic activity of microorganisms in mineral soil (at 0–10 cm depth) at different growth sites. (Two-way ANOVA test, bold numbers show significant differences, n = 3.)
| Level of Age Class | AWCD | Substrate Richness (S) | Shannon’s Diversity Index (H′) | Pielou Evenness (E) | Simpson’s Reciprocal Diversity Index (1/D) | McIntosh Diversity Index (Mc) |
|---|---|---|---|---|---|---|
| Mean ± SD | Mean ± SD | Mean ± SD | Mean ± SD | Mean ± SD | Mean ± SD | |
| Pinus mugo | ||||||
| 1 | 0.35 ± 0.18 | 16.00 ± 4.36 | 2.70 ± 0.30 | 0.98 ± 0.01 | 35.33 ± 12.46 | 0.92 ± 0.02 |
| 2 | 0.42 ± 0.16 | 19.00 ± 2.65 | 2.90 ± 0.13 | 0.99 ± 0.01 | 43.45 ± 5.25 | 0.93 ± 0.01 |
| 3 | 0.39 ± 0.03 | 21.00 ± 1.00 | 2.99 ± 0.05 | 0.98 ± 0.00 | 46.45 ± 3.62 | 0.94 ± 0.01 |
| Pinus sylvestris | ||||||
| 1 | 0.33 ± 0.04 | 18.67 ± 1.53 | 2.87 ± 0.08 | 0.98 ± 0.00 | 45.20 ± 3.08 | 0.94 ± 0.00 |
| 2 | 0.44 ± 0.09 | 21.33 ± 2.08 | 3.01 ± 0.09 | 0.98 ± 0.00 | 46.85 ± 5.05 | 0.93 ± 0.01 |
| 3 | 0.63 ± 0.25 | 23.67 ± 3.21 | 3.12 ± 0.16 | 0.99 ± 0.01 | 52.44 ± 1.88 | 0.94 ± 0.00 |
| F value/p value | ||||||
| Species | 1.29/0.278 | 4.01/0.068 | 3.25/0.096 | 0.00/4.75 | 4.75/0.049 | 0.85/0.374 |
| Age class | 1.83/0.202 | 5.14/0.024 | 4.38/0.037 | 0.49/3.24 | 3.24/0.075 | 1.13/0.356 |
| Species × Age class | 1.27/0.317 | 0.01/0.993 | 0.05/0.954 | 1.16/0.345 | 0.41/0.675 | 1.04/0.384 |
Table 2.
Eigenvalues and percentages of inertia (redundancy analysis).
| F1 Axis | F2 Axis | |
|---|---|---|
| Eigenvalue | 0.031 | 0.001 |
| Constrained inertia (%) | 97.730 | 2.270 |
| Cumulative % | 97.730 | 100.000 |
| Total inertia | 11.101 | 0.258 |
| Cumulative % (%) | 11.101 | 11.359 |
Publisher’s Note: MDPI stays neutral with regard to jurisdictional claims in published maps and institutional affiliations. |
© 2020 by the authors. Licensee MDPI, Basel, Switzerland. This article is an open access article distributed under the terms and conditions of the Creative Commons Attribution (CC BY) license (http://creativecommons.org/licenses/by/4.0/).
Share and Cite
MDPI and ACS Style
Jurkšienė, G.; Janušauskaitė, D.; Baliuckas, V. Microbial Community Analysis of Native Pinus sylvestris L. and Alien Pinus mugo L. on Dune Sands as determined by Ecoplates. Forests 2020, 11, 1202. https://doi.org/10.3390/f11111202
AMA Style
Jurkšienė G, Janušauskaitė D, Baliuckas V. Microbial Community Analysis of Native Pinus sylvestris L. and Alien Pinus mugo L. on Dune Sands as determined by Ecoplates. Forests. 2020; 11(11):1202. https://doi.org/10.3390/f11111202
Chicago/Turabian StyleJurkšienė, Girmantė, Dalia Janušauskaitė, and Virgilijus Baliuckas. 2020. "Microbial Community Analysis of Native Pinus sylvestris L. and Alien Pinus mugo L. on Dune Sands as determined by Ecoplates" Forests 11, no. 11: 1202. https://doi.org/10.3390/f11111202
Note that from the first issue of 2016, this journal uses article numbers instead of page numbers. See further details here.