Differences in the Spatial Structure of Two Pinus cembra L. Populations in the Carpathian Mountains


1
Department of Biogeography, University of Bayreuth, Universitätsstraße 30, 95447 Bayreuth, Germany
2
GIB Department of Geography, University of Bayreuth, 95447 Bayreuth, Germany
3
BayCEER Bayreuth Center of Ecology and Environmental Research, University of Bayreuth, 95448 Bayreuth, Germany
*
Author to whom correspondence should be addressed.
Forests 2019, 10(4), 326; https://doi.org/10.3390/f10040326
Submission received: 9 February 2019
/
Revised: 5 April 2019
/
Accepted: 9 April 2019
/
Published: 11 April 2019
(This article belongs to the Section Forest Ecology and Management)
Abstract
:Pinus cembra L. is a key species of high elevation forest ecosystems in Europe. However, in most mountain ranges, its importance has declined considerably. Remnant populations are often isolated and their dynamics and functioning are not well understood. Here, we apply novel approaches in pattern analysis to two P. cembra populations in the Carpathian Mountains in order to identify commonalities and divergences in their spatial structure and dynamics. Four study sites (1.2 ha each) were investigated within the treeline ecotone in two protected areas that differ in terms of protection status. Based on height and diameter, the individuals were classified into three size-classes: sapling, intermediate and adult trees. Spatial distribution and interactions between tree sizes were analyzed using point pattern analysis. The overall structure of all trees was aggregated at a small distance and regular at a greater distance in the population from the Natura 2000 site (p = 0.002), while in the National Park population it was a random pattern. However, the general patterns do not apply to tree size classes and the relationship among them. In the Natura 2000 site, there was no correlation, all the trees were mixed, regardless of their size. In the National Park, the sapling and intermediate were strongly clustered (p = 0.001), but the adult trees were spatially separated from all juveniles, forming patches at a lower elevation. In both areas, spatial patterns indicate the dynamics of the P. cembra population. Whereas in the National Park population, there is evidence of an upward shift, which cannot be confirmed in Natura 2000, where size classes are completely mixed and the dynamic does not translate into an expansion of the population area. The spatial differences between the two populations indicate that conservation strategies need to be developed more individually to support the regeneration of these isolated populations.
1. Introduction
Spatial patterns are essential for understanding the structure, dynamics, and functioning of plant communities [1,2]. As contrasted with stochastic distributions, these scale-dependent patterns are controlled by processes such as seed dispersal, biotic interactions, and nutrient or water availability, each of which in turn is scale-dependent [2,3,4]. Moreover, facilitation and competition are important drivers of the spatial structure of the species [5,6]. In harsh conditions, high density of young and mature tree species can increase the growth and survivorship [5,7]. Establishment and survival of seedlings have been explained by several theories, such as dispersal limitation and Janzen–Connell hypothesis. Janzen–Connell hypothesis asserts that seed predators, herbivores, intraspecific competition, and pathogens affect the establishment and survival of seedlings near the parent trees [8,9]. Therefore, the hypothesis predicts a higher survival of seedlings at a greater distance from the conspecific trees. This hypothesis has been developed for tropical forests, but has been applied and also confirmed in temperate forests [10,11]. Processes that influence the spatial structure and forest dynamics can be provided by analyzing spatial patterns and tree relationships [12]. Point pattern analysis effectively detects the spatial structure and relationships established between trees by using the size structure and distribution of the age or height of tree populations [13].
Pinus cembra L. is a tree species endemic to the European region, and a component of the subalpine forests [14]. The species is abundant in the central Alps, but only small and isolated populations exist in the Carpathian Mountains [14,15]. Among these, the populations from the Tatra and Retezat Mountains are the largest, with over one thousand individuals, and greater genetic diversity than those in the Alps [16,17,18,19]. However, most of the Carpathian populations have a very low number of individuals, under 150 [16,19], which makes them more prone to inbreeding depression and low genetic variation [17,18]. Generally, marginal populations tend to exhibit lower density than central populations [20,21], resulting in increased sensitivity towards environmental and anthropogenic impacts. These aspects highlight their importance in ecology and conservation [17]. Studying the current spatial patterns and the structural dynamics of isolated or marginal populations may help us to understand the processes that influence their expansion or retraction [12]. In the Romanian Carpathians, P. cembra grows at an elevation between 1350 m and 2200 m a.s.l., and has Picea abies Karst. as its main competitor [16]. A single bird species, Nucifraga caryocatactes L., is the only vector for seed dispersal for P. cembra. The N. caryocatactes occurrence is abundant in the Romanian Carpathians [22]. Biotic factors, such as seed deposition, seed predation, overstorey, and understorey vegetation, are considered to be more important for the species’ natural establishment and regeneration than abiotic factors [23]. P. cembra has a restrictive habitat in Romania and is part of the protected habitat types of the Natura 2000 network [24]. However, the species is threatened by human activities (such as livestock grazing and tourism) that have fragmented its natural habitat, reducing its regeneration [15].
In the harsh climate of the treeline ecotone, forest dynamics and structure have been strongly altered by human land use [25]. The treeline ecotone is a transition zone between the closed forest and the upper limit of the isolated individuals [26,27]. The treeline ecotone range (Table S1) varies mainly due to thermal limitations, anthropogenic influences, and mechanical causes [26]. In the Romanian Carpathians, P. cembra occurs always inside protected areas [19] and may fall sometimes under areas with different status of protection. Protected areas contribute to habitat maintenance by controlling deforestation and pastoralism [28,29]. Human pressure varies significantly with protection status [29]. Between 1880 and 2000 deforestation close to the treeline ecotone was more intense in the Carpathians compared to the Swiss Alps [30,31]. In recent years human influence has decreased in both areas [25,32]. In Romania, the coverage of protected areas increased from 4.1% in 1989 to 24% in 2017 of the total country area [22]. In addition to the well-known IUCN protected area categories, the Natura 2000 network was created at the European Union level. Its aim is to facilitate the protection of threatened species and natural habitats not through strict protection but rather through a sustainable approach to promote traditional practices [22]. Unlike national parks (IUCN category II), the lack of funding for the European Natura 2000 network leads to social and economic tensions rather than actual conservation and development [22]. National parks often have core zones with more restrictive management than the Natura 2000 network. To capture also possible differences induced by the protection status, two populations of P. cembra were sampled in two areas: a Natura 2000 site, established in 2007, which does not benefit from strict protection; and a National Park (IUCN category II), which has been under protection since 1935. The Natura 2000 site was influenced by past anthropogenic disturbances and presents a higher grazing intensity than the Retezat National Park [33]. So far, P. cembra populations were mainly analyzed by dendrochronology, to reconstruct the past climate [34,35]. In addition, responses to present and future climate change were assessed [14]. Although the spatial structure has been analyzed in the Alps [25,36], little is known about the spatial distribution of individuals and spatial patterns of the tree sizes in the Carpathian Mountains.
The purpose of this paper is to study the spatial structure and dynamics of two isolated populations of P. cembra in the protected areas of the Carpathian Mountains. Our specific objectives are to: (1) characterize the spatial structure of P. cembra populations, (2) evaluate and compare the spatial relationship within and between the two populations, and (3) assess their tree size hierarchy. The achievement of these objectives will provide insights into processes that enhance the dynamics and functioning of isolated populations and can be made inferences about their future distribution at the treeline ecotone.
2. Methods
2.1. Study Area
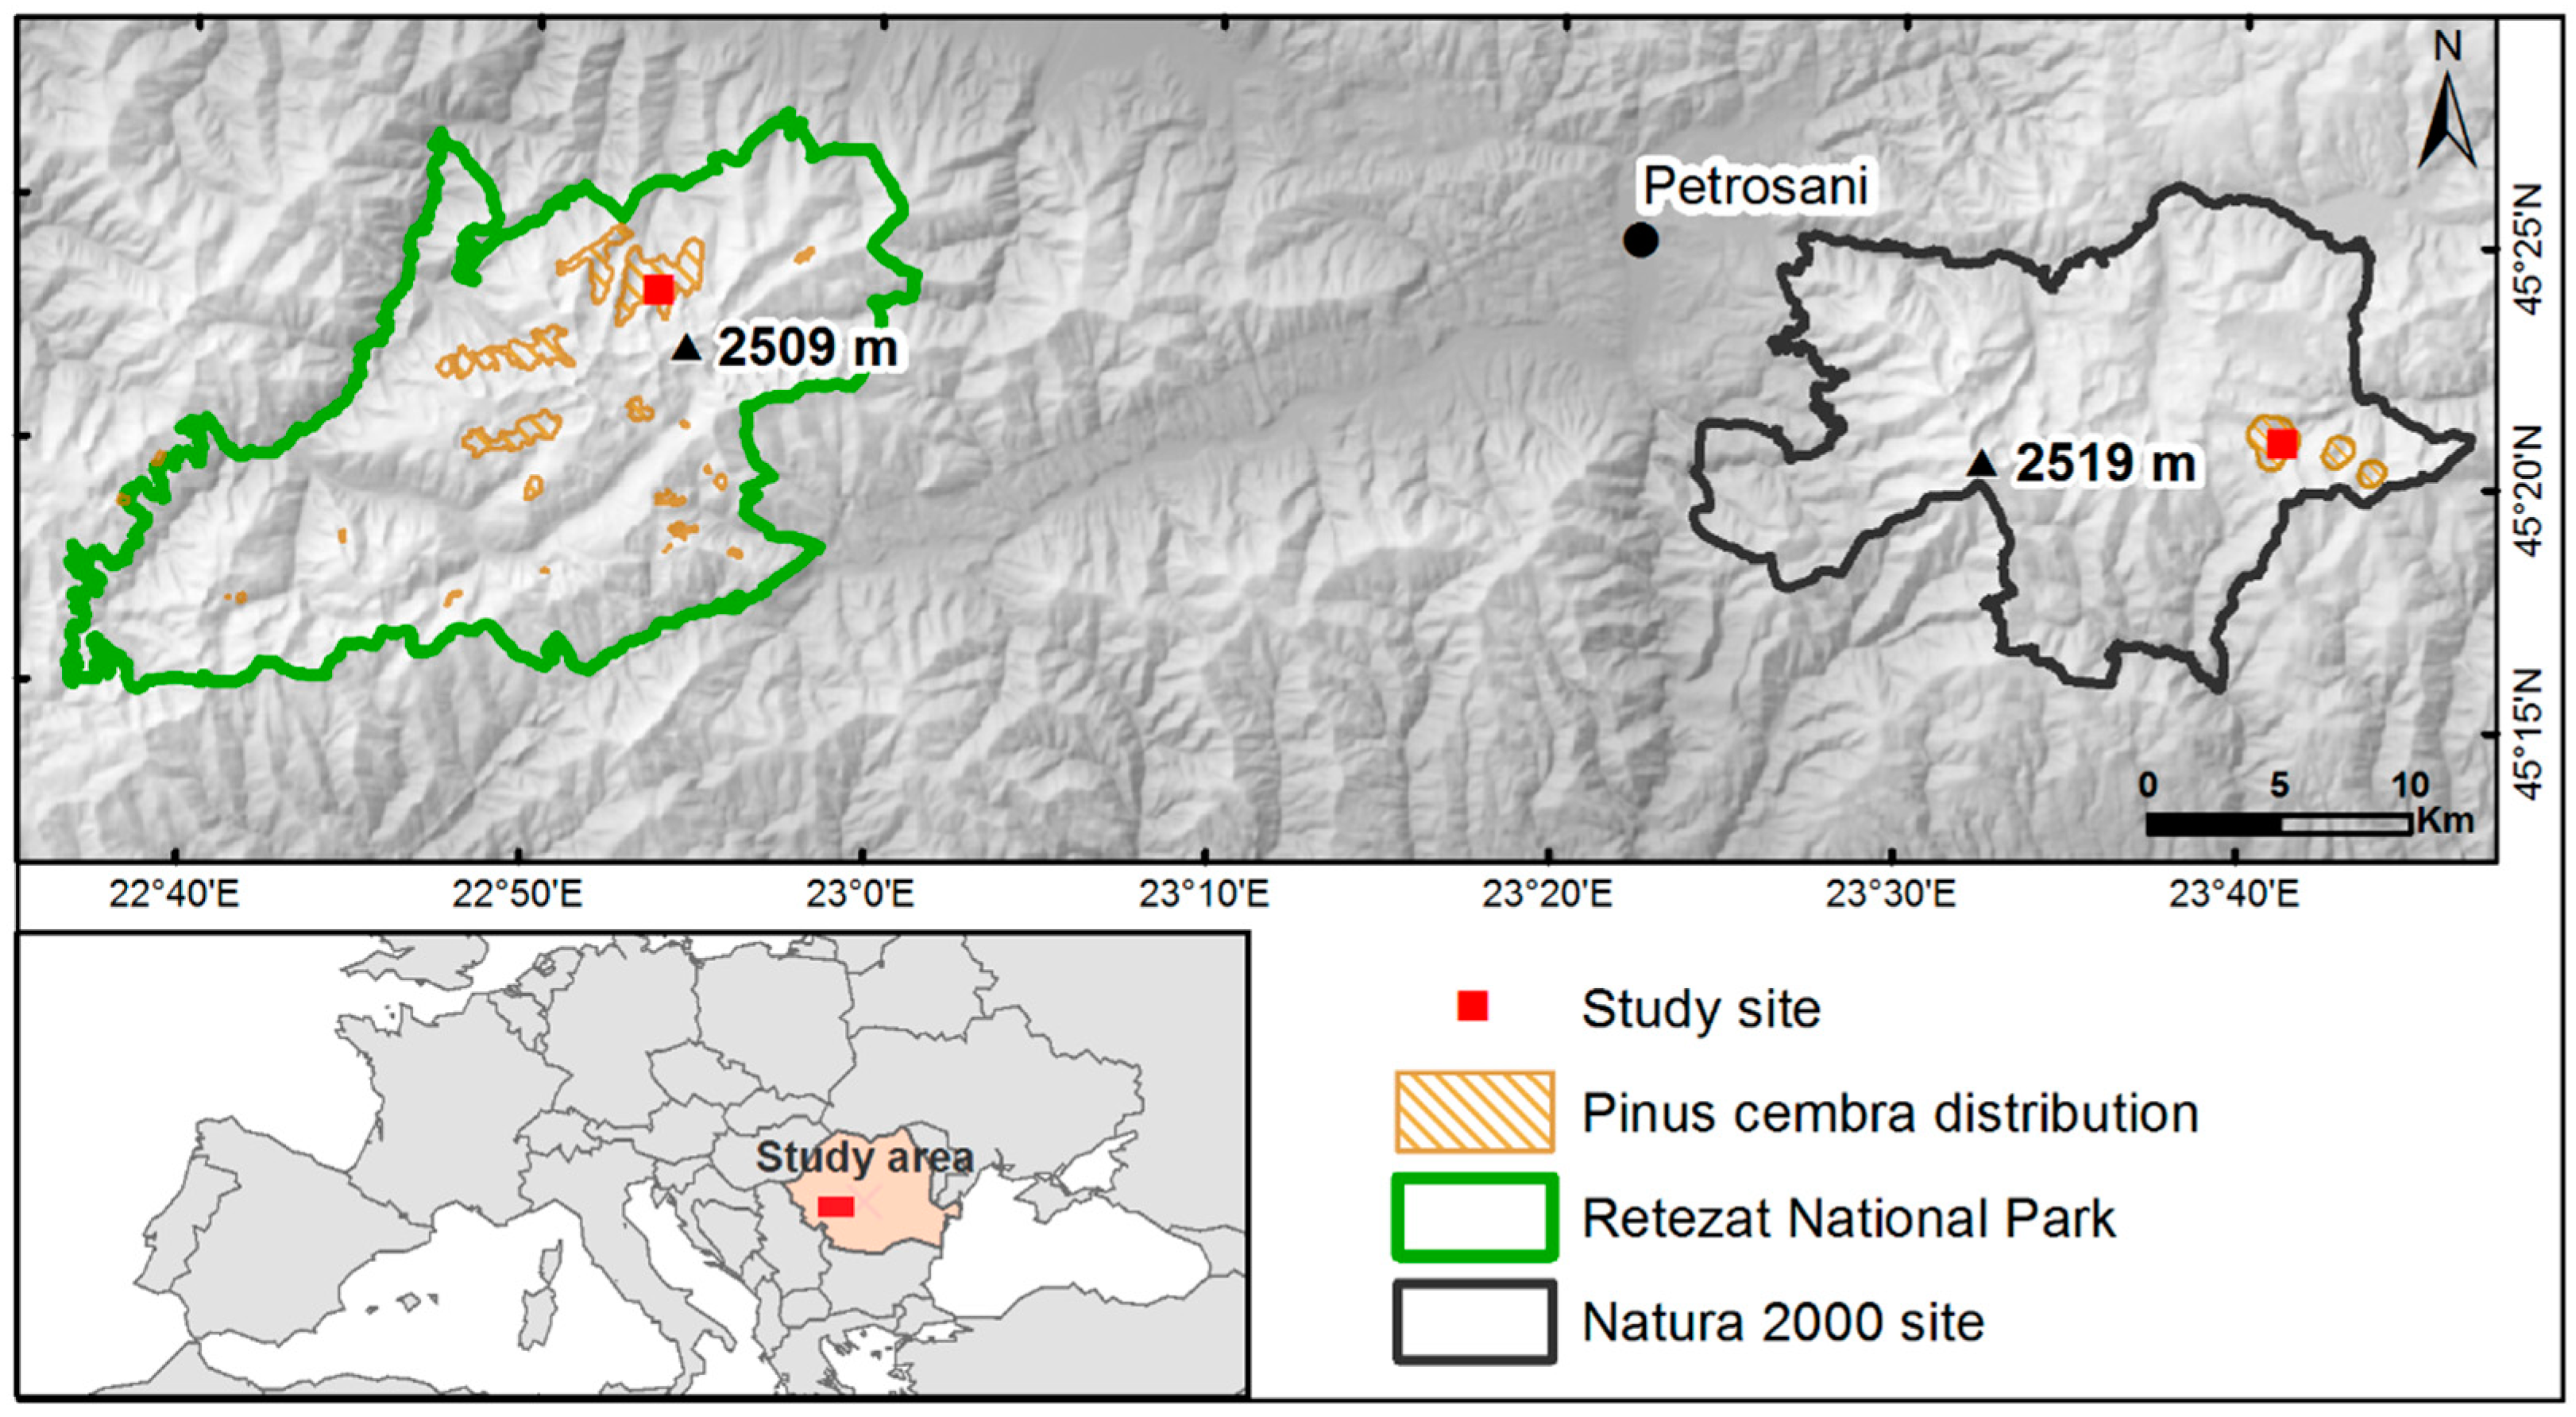
The study sites are located in the treeline ecotone, in two subdivisions of the Southern Carpathians, Romania (Figure 1). One of the study sites is located in the Retezat National Park (IUCN category II). In addition, this protection status overlaps with other categories of protected areas, including a scientific reserve (IUCN category Ia). The second study site is located in the Parâng Mountains, with the site having been included in the Natura 2000 network since 2007, under the Habitats Directive, as a site of community importance (SCI). The elevation of the treeline ecotone depends on the study sites. In the site from the Retezat National Park, the treeline ecotone has a range between ~1730 and 2058 m a.s.l., whereas in the Natura 2000 site only between ~1670 and 1820 m a.s.l. (Table S1). The tree population has a small and isolated distribution (Figure 1). There is clear evidence of historic and present-day mixed land-use near the site, a high density of roads passing through the site, and at the treeline ecotone old stumps and remains of Pinus mugo Turra, Picea abies and P. cembra have been observed. The intensity of grazing is higher in the Natura 2000 site than in the Retezat National Park, with a 0.42 sheepfold/km² compared to 0.19 sheepfold/km² [33].
Both massifs have a glacial morphology with a maximum elevation of 2509 m a.s.l. (Peleaga peak) in the Retezat Mountains, and 2519 m a.s.l. (Parângul Mare peak) in the Parâng Mountains. The soils are orthic podzols with a crystalline schist bedrock. The mean annual temperature is −0.5 °C at 2190 m a.s.l. (1959–2009) in the Retezat Mountains and below −1 °C above 2200 m a.s.l. in the Parâng Mountains; the mean annual precipitation is almost similar across both sites: 1100–1400 mm in the Retezat Mountains, and 1000–1200 mm in the Parâng Mountains [37,38].
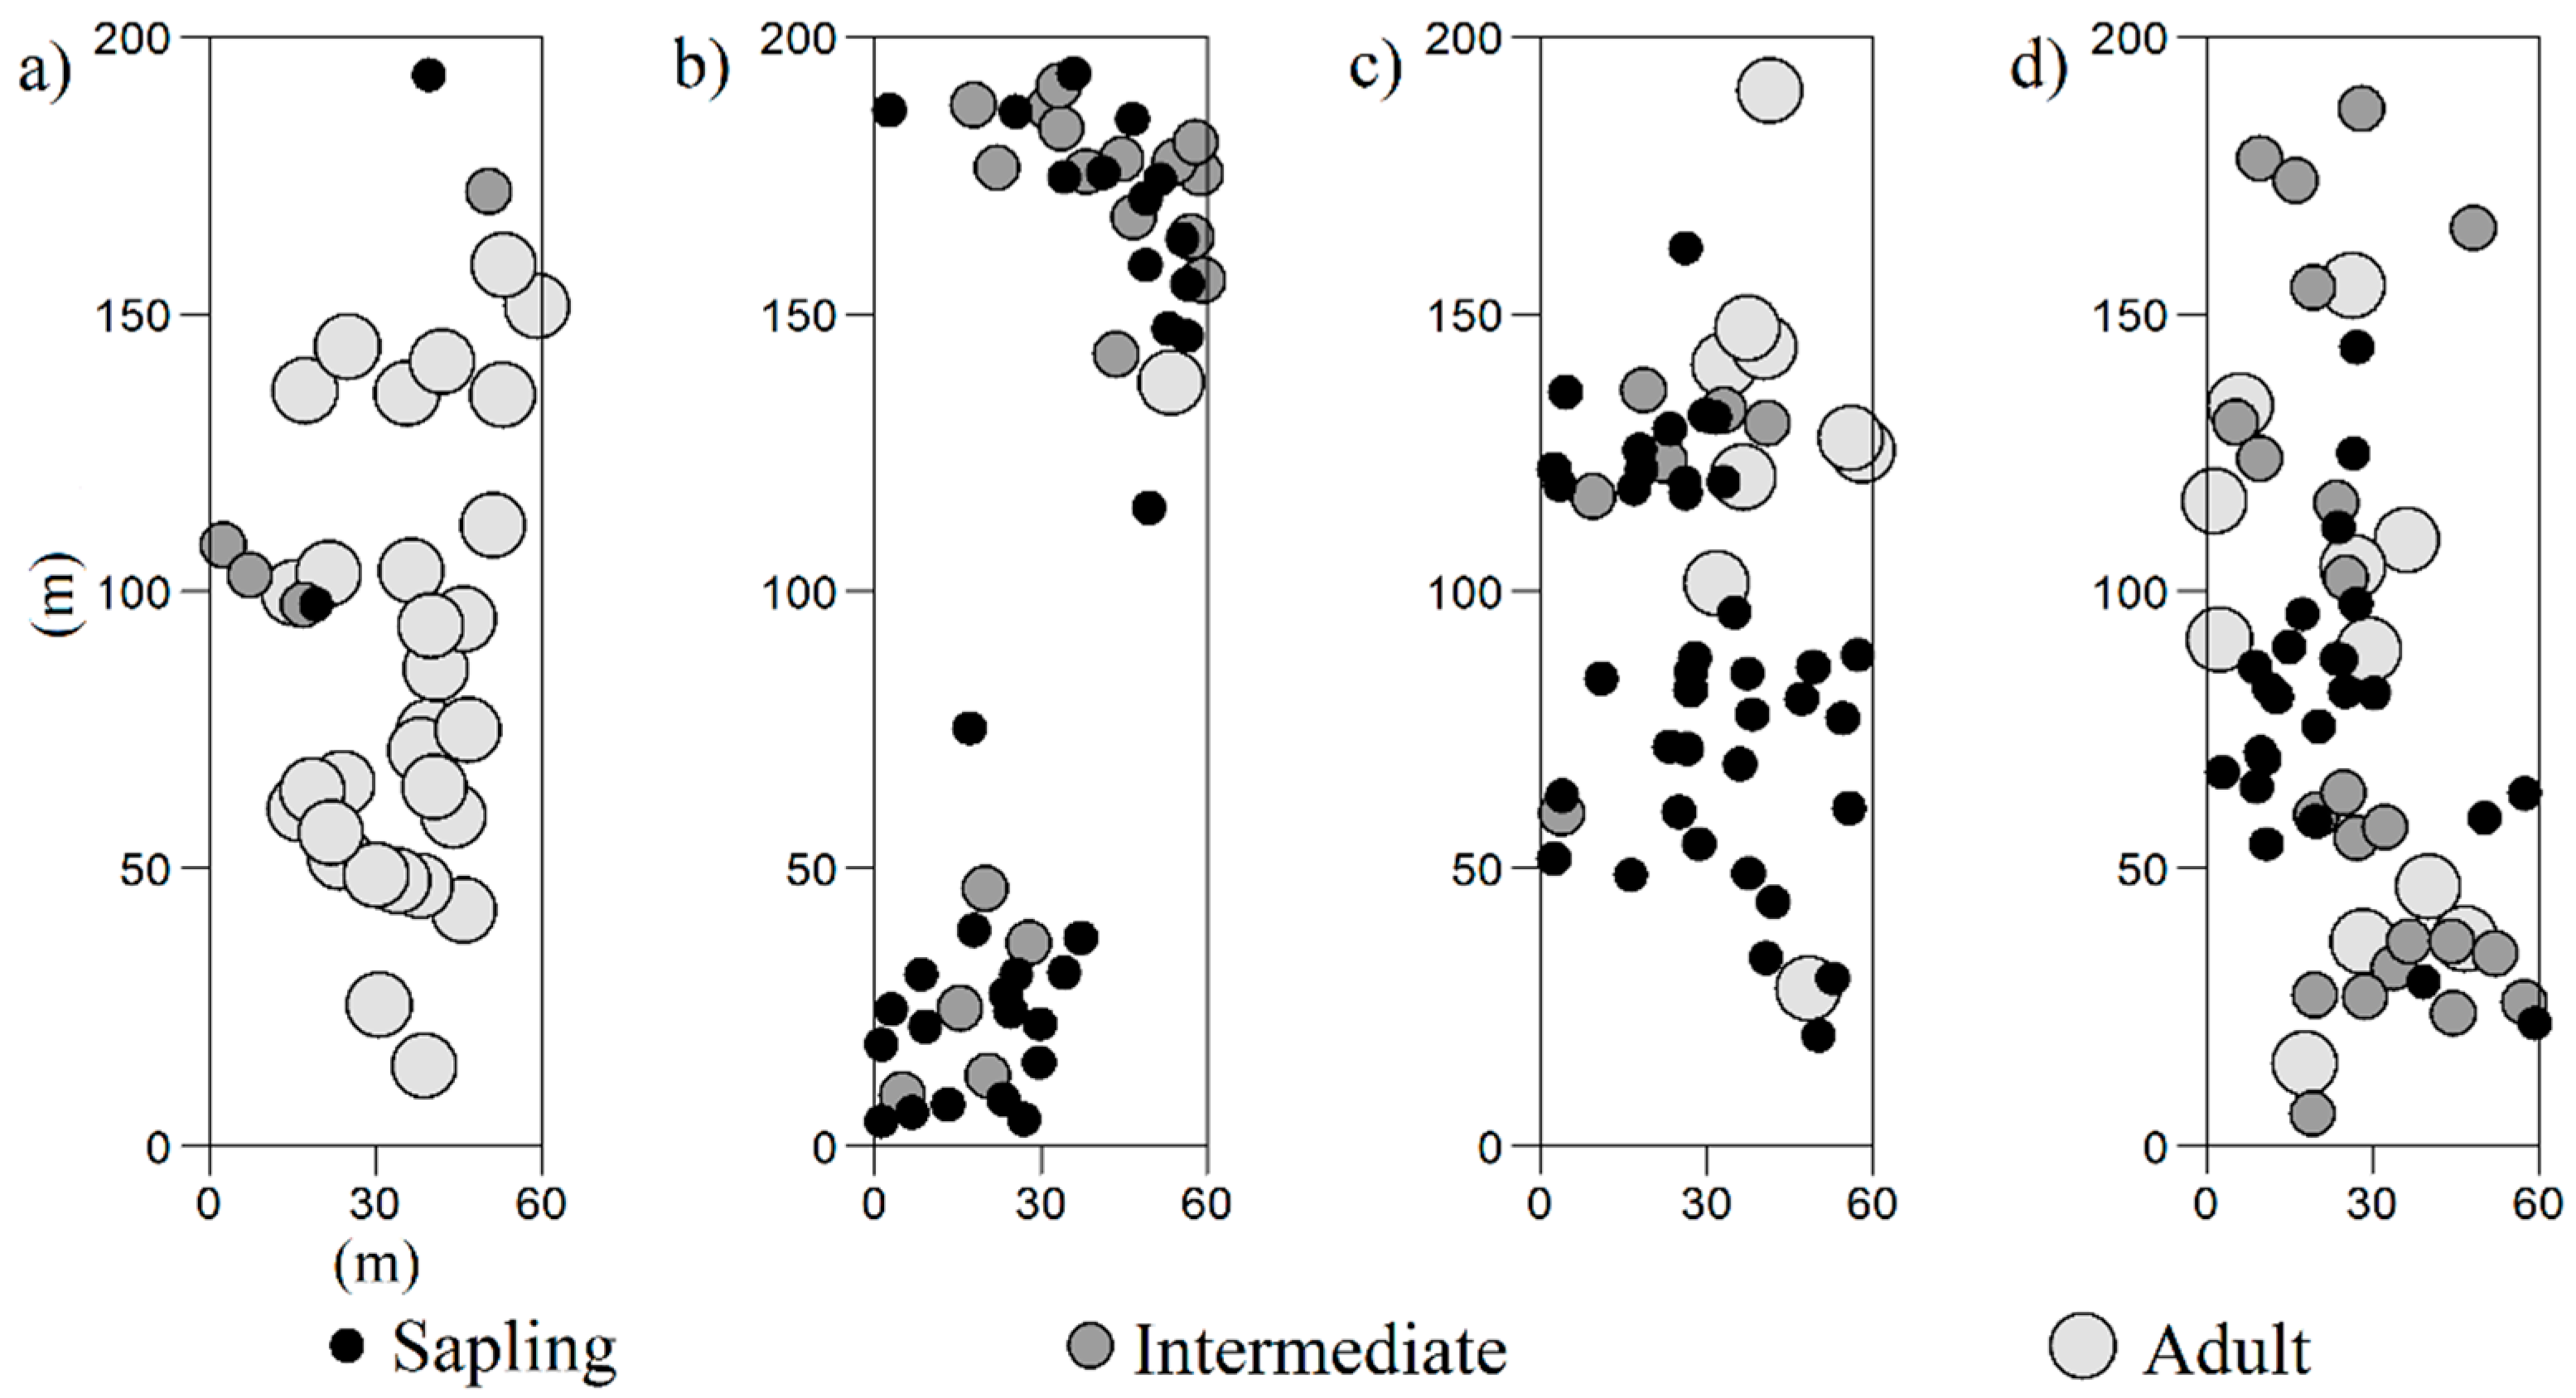
Four large rectangular plots (200 × 60 m, 1.2-ha) were established in the treeline ecotone (Figure 2). All plots were aligned from low to high elevations (Table S1). Two plots were established in the Rea Valley—Retezat National Park. One plot was situated at an elevation of 1754 m a.s.l. (Figure 2a), on a 8%–38% northeast slope, with 55% Pinus mugo, 40% P. cembra and 5% herbaceous plants. The other plot was situated at 1886 m a.s.l., on a 38%–76% northeast slope (Figure 2b), with 40% P. mugo, 25% P. cembra, 20% rock outcrops and 15% Vaccinium–Rhododendron shrubs and herbaceous plants. The other two plots were established in the Dengheru Valley—Parâng Mountains. One plot was situated at an elevation of 1719 m a.s.l. (Figure 2c), with the understory dominated by 60% Vaccinium–Rhododendron shrubs and herbaceous plants, 20% P. cembra and 20% Picea abies. The other plot was situated at 1726 m a.s.l. (Figure 2d), with 70% Vaccinium–Rhododendron shrubs and herbaceous plants, 20% P. cembra and 10% Picea abies. Both plots had a northwest slope with a variation between 14% and 38%. Tree distributions contain areas of lower density that can be caused by habitat heterogeneity, such as edaphic conditions.
In both study sites, P. cembra occurs in association with Picea abies at a lower elevation, forming a mixed forest, and at higher elevation occurs with Pinus mugo, Sorbus aucuparia L., and Alnus viridis DC. The height of all P. cembra individuals taller than 10 cm was measured in all plots. The diameter was measured at 1.3 m height for all individuals ≥1.3 m. Where multiple stems were growing from the same base, only the largest was measured. The locations of trees were mapped using a global positioning system (GPS) device with an accuracy of 1 to 3.5 m (Garmin GPSMAP 62). In total, 112 individuals were mapped and measured in the Natura 2000 site, and 88 individuals in the Retezat National Park. The trees were categorized into three classes: sapling, intermediate and adults (Table 1). The data was collected during two field surveys, one in 2016 and the other in 2017.
2.2. Spatial Patterns Analysis
To assess whether all the trees in each site had a clumped (grouped together), random or regular spatial distribution a point pattern analysis was used. The univariate inhomogeneous pair correlation function (ginhom(r)) can be applied for heterogeneous plots and is defined as:
where Kinhom′(r) is the derivative of the inhomogeneous K function and r is the distance. This function accounts for spatial heterogeneity [39,40].
The inhomogeneous g(r) with the heterogeneous Poisson null model (HP) was applied to account for second-order effect [41]. Large-scale aggregation is attributed to environmental heterogeneity (soil, nutrients, elevation, slope) and small-scale clustering (<20 m) is attributed to plant–plant interactions [42]. Values above the totally random distribution curve (HP—the 95% confidence interval) indicates a clumped distribution, within the HP indicates a random distribution and below the HP a regular distribution. The univariate inhomogeneous pair-correlation function ginhom(r) was used with 1000 Monte Carlo simulations and 95% confidence interval to analyze and compare the distribution patterns (regular, clustered or random) of tree individuals. The bandwidth was determined for each dataset by using the cross-validated bandwidth selection function [43]. The Epanechnikov kernel and Ripley’s isotropic edge correction were applied to the data [43]. The function g(r) accounts for point density at a specific distance, while the related inhomogeneous K(r) is a cumulative distribution function that calculates the average number of points in a given radius r [41]. From an ecological point of view, K(r) makes the interpretation of the results more difficult but has the advantage of better testing of the goodness-of-fit [44]. Therefore, we used both inhomogeneous g(r) for detecting fine-scale patterns and K(r) for the confirmation of the null model.
2.3. Modelling the Spatial Relationship between Tree Sizes
Analysis of bivariate pattern revealed the interaction structure between two types of points (e.g., sapling vs. adult). If the points had extra information attached to them (called quantitative marks: the attribute of the point, such as tree height or diameter) then a bivariate analysis can be carried out [37,39]. Bivariate cross-k multitype analysis (Kij(r)) can be defined by analogy to Ripley’s K-function:
The function estimates the expected (E) density (λ) of points of type j (e.g., “sapling”) within a given distance r of a point of type i (e.g., “adult”) [43,45,46]. The cross-k analysis was used to assess the intra-size spatial relationship between different tree size classes. Type j points are positively correlated, random or negatively correlated, with type i points when the observed cross-k curve is above, within or below the 95% confidence interval [13]. Ecologically, a positive correlation means attraction between tree size classes (such as between sapling and intermediate individuals), the random pattern signifies spatial independence, therefore there is no relationship and a negative correlation means segregation or repulsion between tree size classes. The cross-k function was used under complete spatial randomness (CSR) with a 1000 Monte Carlo simulations, a bandwidth of 9 m and an isotropic edge correction [13,43]. In addition, we also used the cross-type pair correlation function to confirm the spatial patterns detected by the cross-k function.
2.4. Spatial Correlation and Autocorrelation
In order to evaluate the spatial correlation of the given marks of P. cembra, mark correlation function kmm(r) for multitype point processes was used:
where denotes the conditional probability given that there are points at the location 0 and u separated by a distance r; M(0) and M(u) are the marks attached of those two points and P is the probability of drawing independently random marks from the marginal distribution of marks that are equal to each other (M = M’) [43]. The function helps to test if the quantitative marks of individuals are spatially aggregated or segregated. If marks (S—sapling, I—intermediate, and A—adult) assigned to points are independent, then the function is equal to one for all distances. If kmm(r) > 1 it means that points located apart at distance r tend to have larger marks indicating a positive correlation. A kmm(r) < 1 indicates negative correlation and points tend to have smaller marks [47]. From an ecological point of view, the values of the function can be associated with interaction effects such as independence, attraction or mutual stimulation, inhibition or mutual suppression of the trees [48].
The mark correlation function can detect only the multitude of sizes at a given distance r but mark variogram γ(r) can show if individuals have the same or different size at a certain distance from one another, therefore, both analyses were necessary to assess the local size hierarchy of the trees. The function calculates the squared difference between the marks of the pairs of points, within a certain distance r where x and x + r are the points at location x and x + r; E is the expectation [47,49]:
γ(r) = ½ E(m(x) − m(x + r))²; r > 0
Values of γ(r) < 1 signify a positive autocorrelation, suggesting a similar size of the neighbors, and individuals with similar marks tend to be found together. Values of γ(r) > 1 suggest a negative autocorrelation, which entails a strong difference in the marks, with trees of different sizes more likely to be close to each other [50]. Within the resulting graphs, along the line representing the observed values, the troughs show groups of tall trees, while the crests show groups of small trees [47,51,52]. In bivariate analysis (kmm(r)) the data are highly correlated, spatially independent or negatively correlated when above, within or below the 95% confidence interval, while the reverse is true for mark variogram (γ(r)).
The markcorr and markvario functions were used under complete spatial randomness (CSR) with a 1000 Monte Carlo simulation of the null model. Moreover, the bandwidth (h = 9.5 m) was calculated and the isotropic edge correction was applied to the data [13,43]. The p-value corresponds to the Loosmore and Ford goodness-of-fit test (GoF) for spatial point patterns. The GoF test was computed for each analysis in order to evaluate the suitability of the models [53]. For the design of the plots ArcGIS 10.5 software (ESRI, Redlands, CA, USA) was used, and the statistical analysis was carried out using the open source software R version 3.5.1 (R Core Team) [39] with the ‘spatstat’ package [43].
3. Results
3.1. General Spatial Distribution Pattern
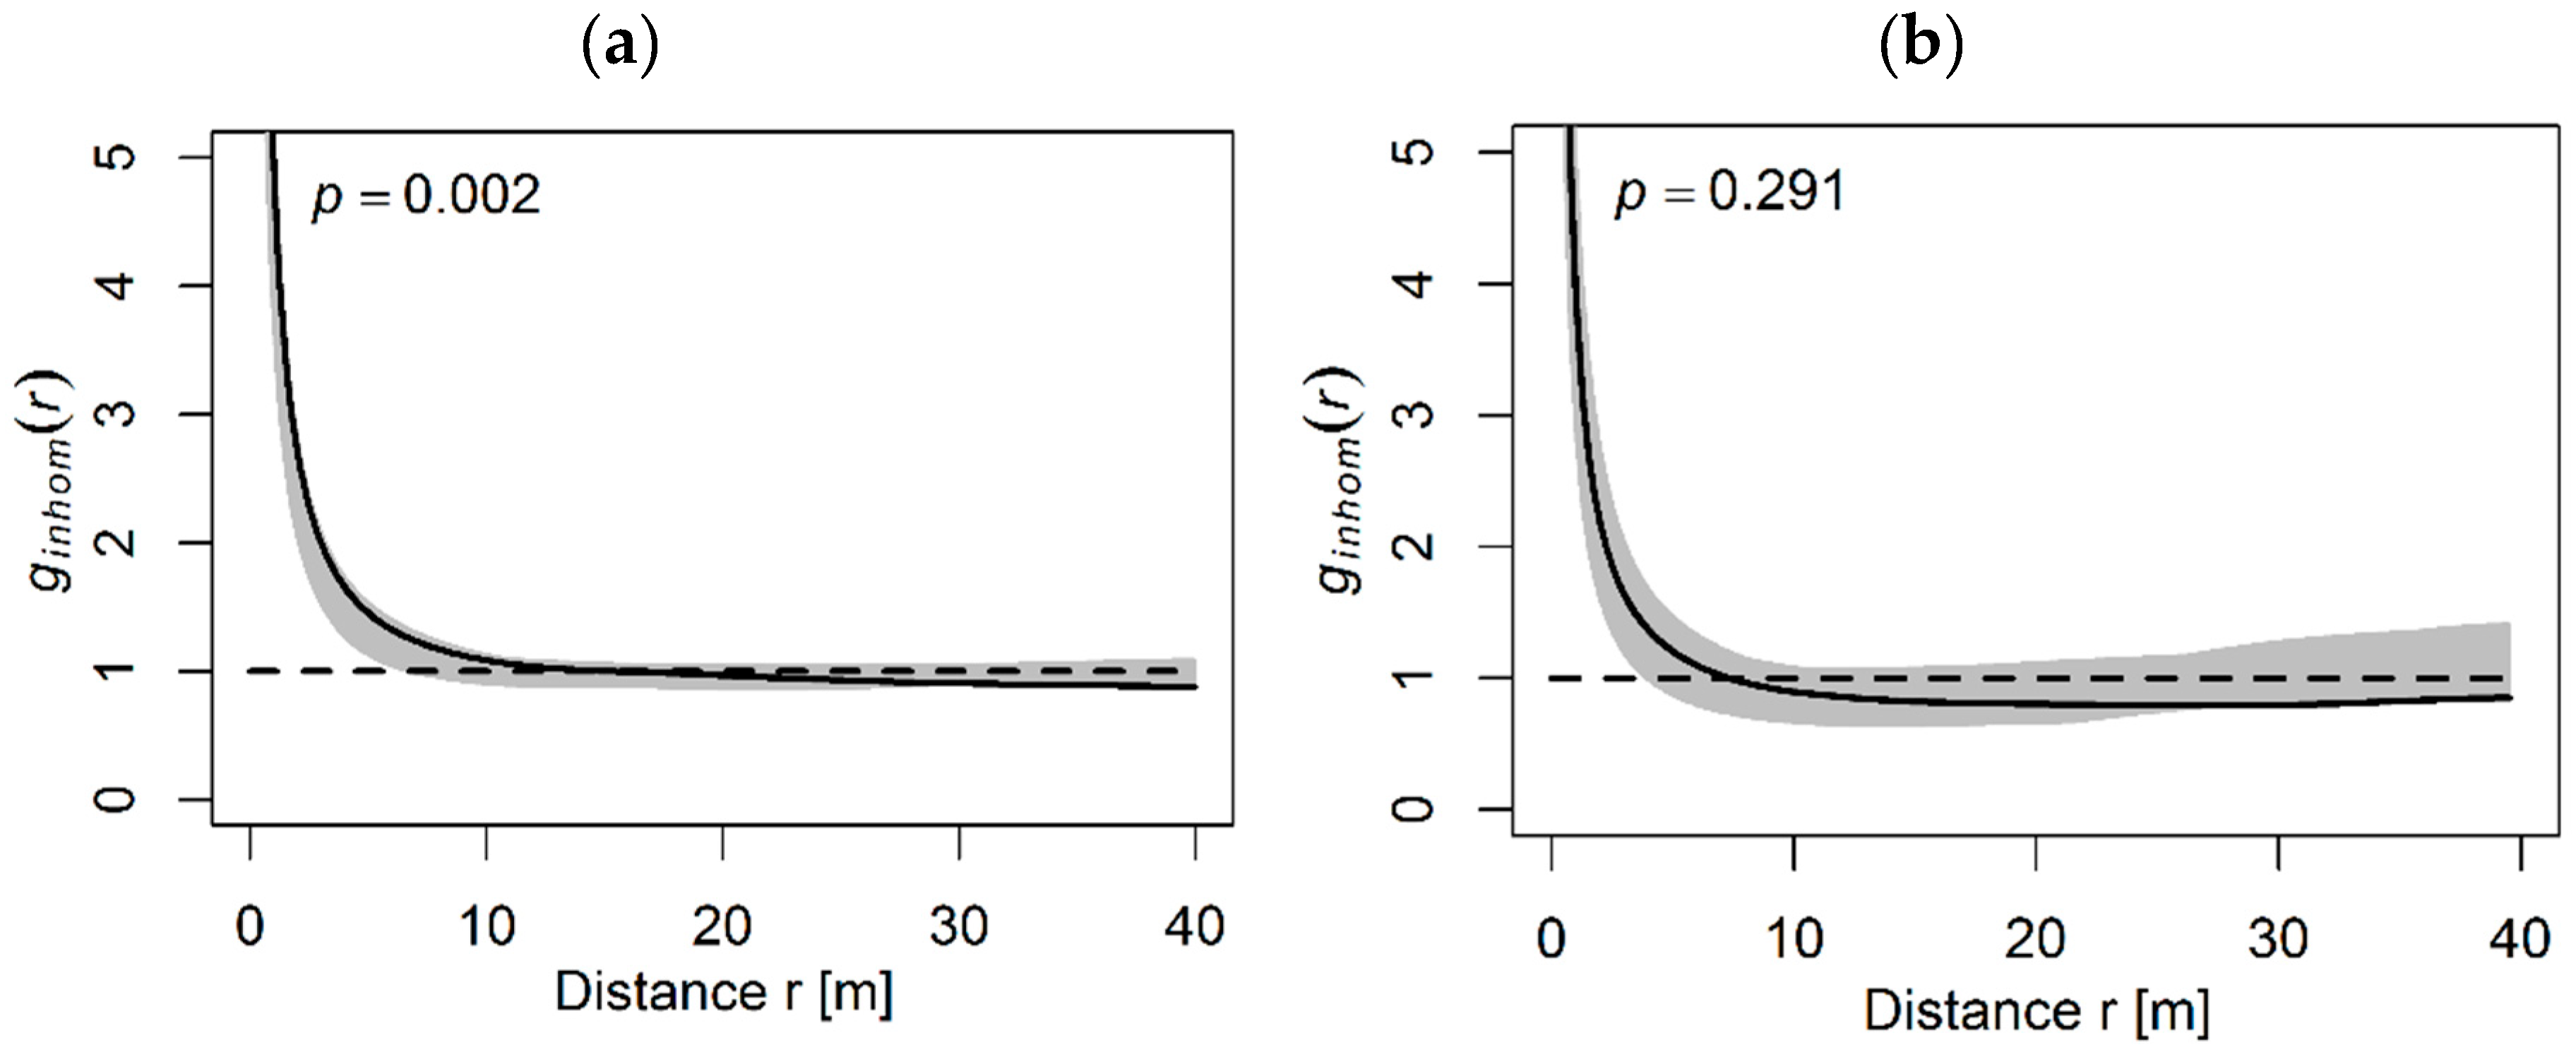
The spatial distribution of all P. cembra individuals showed a significant aggregation pattern in the Natura 2000 site and a random pattern in the Retezat National Park. In the Natura 2000, the trees were clustered at a small distance, up to 5 m, random between 5 and 30 m and regular at a greater distance (30–40 m). Although the pattern varied from clustered to regular, it was significant (p = 0.002, Figure 3a). The significant pattern was also confirmed by the inhomogeneous K(r) function. In the Retezat National Park, although the trees appeared aggregated in the plots, due to habitat heterogeneity, the analysis showed a random pattern that was in a continuous decline to a regular pattern at a greater distance (30–40 m) (Figure 3b). The random patterns indicated an independent spatial location of the trees. Most of the observed values fell within the confidence interval, indicating a random distribution (p = 0.291). These results were confirmed also by “Ripley’s K function”, as inhomogeneous K(r) values showed a decreasing pattern from random to regular but significant (p = 0.009).
3.2. Spatial Distribution of the Tree Size Classes
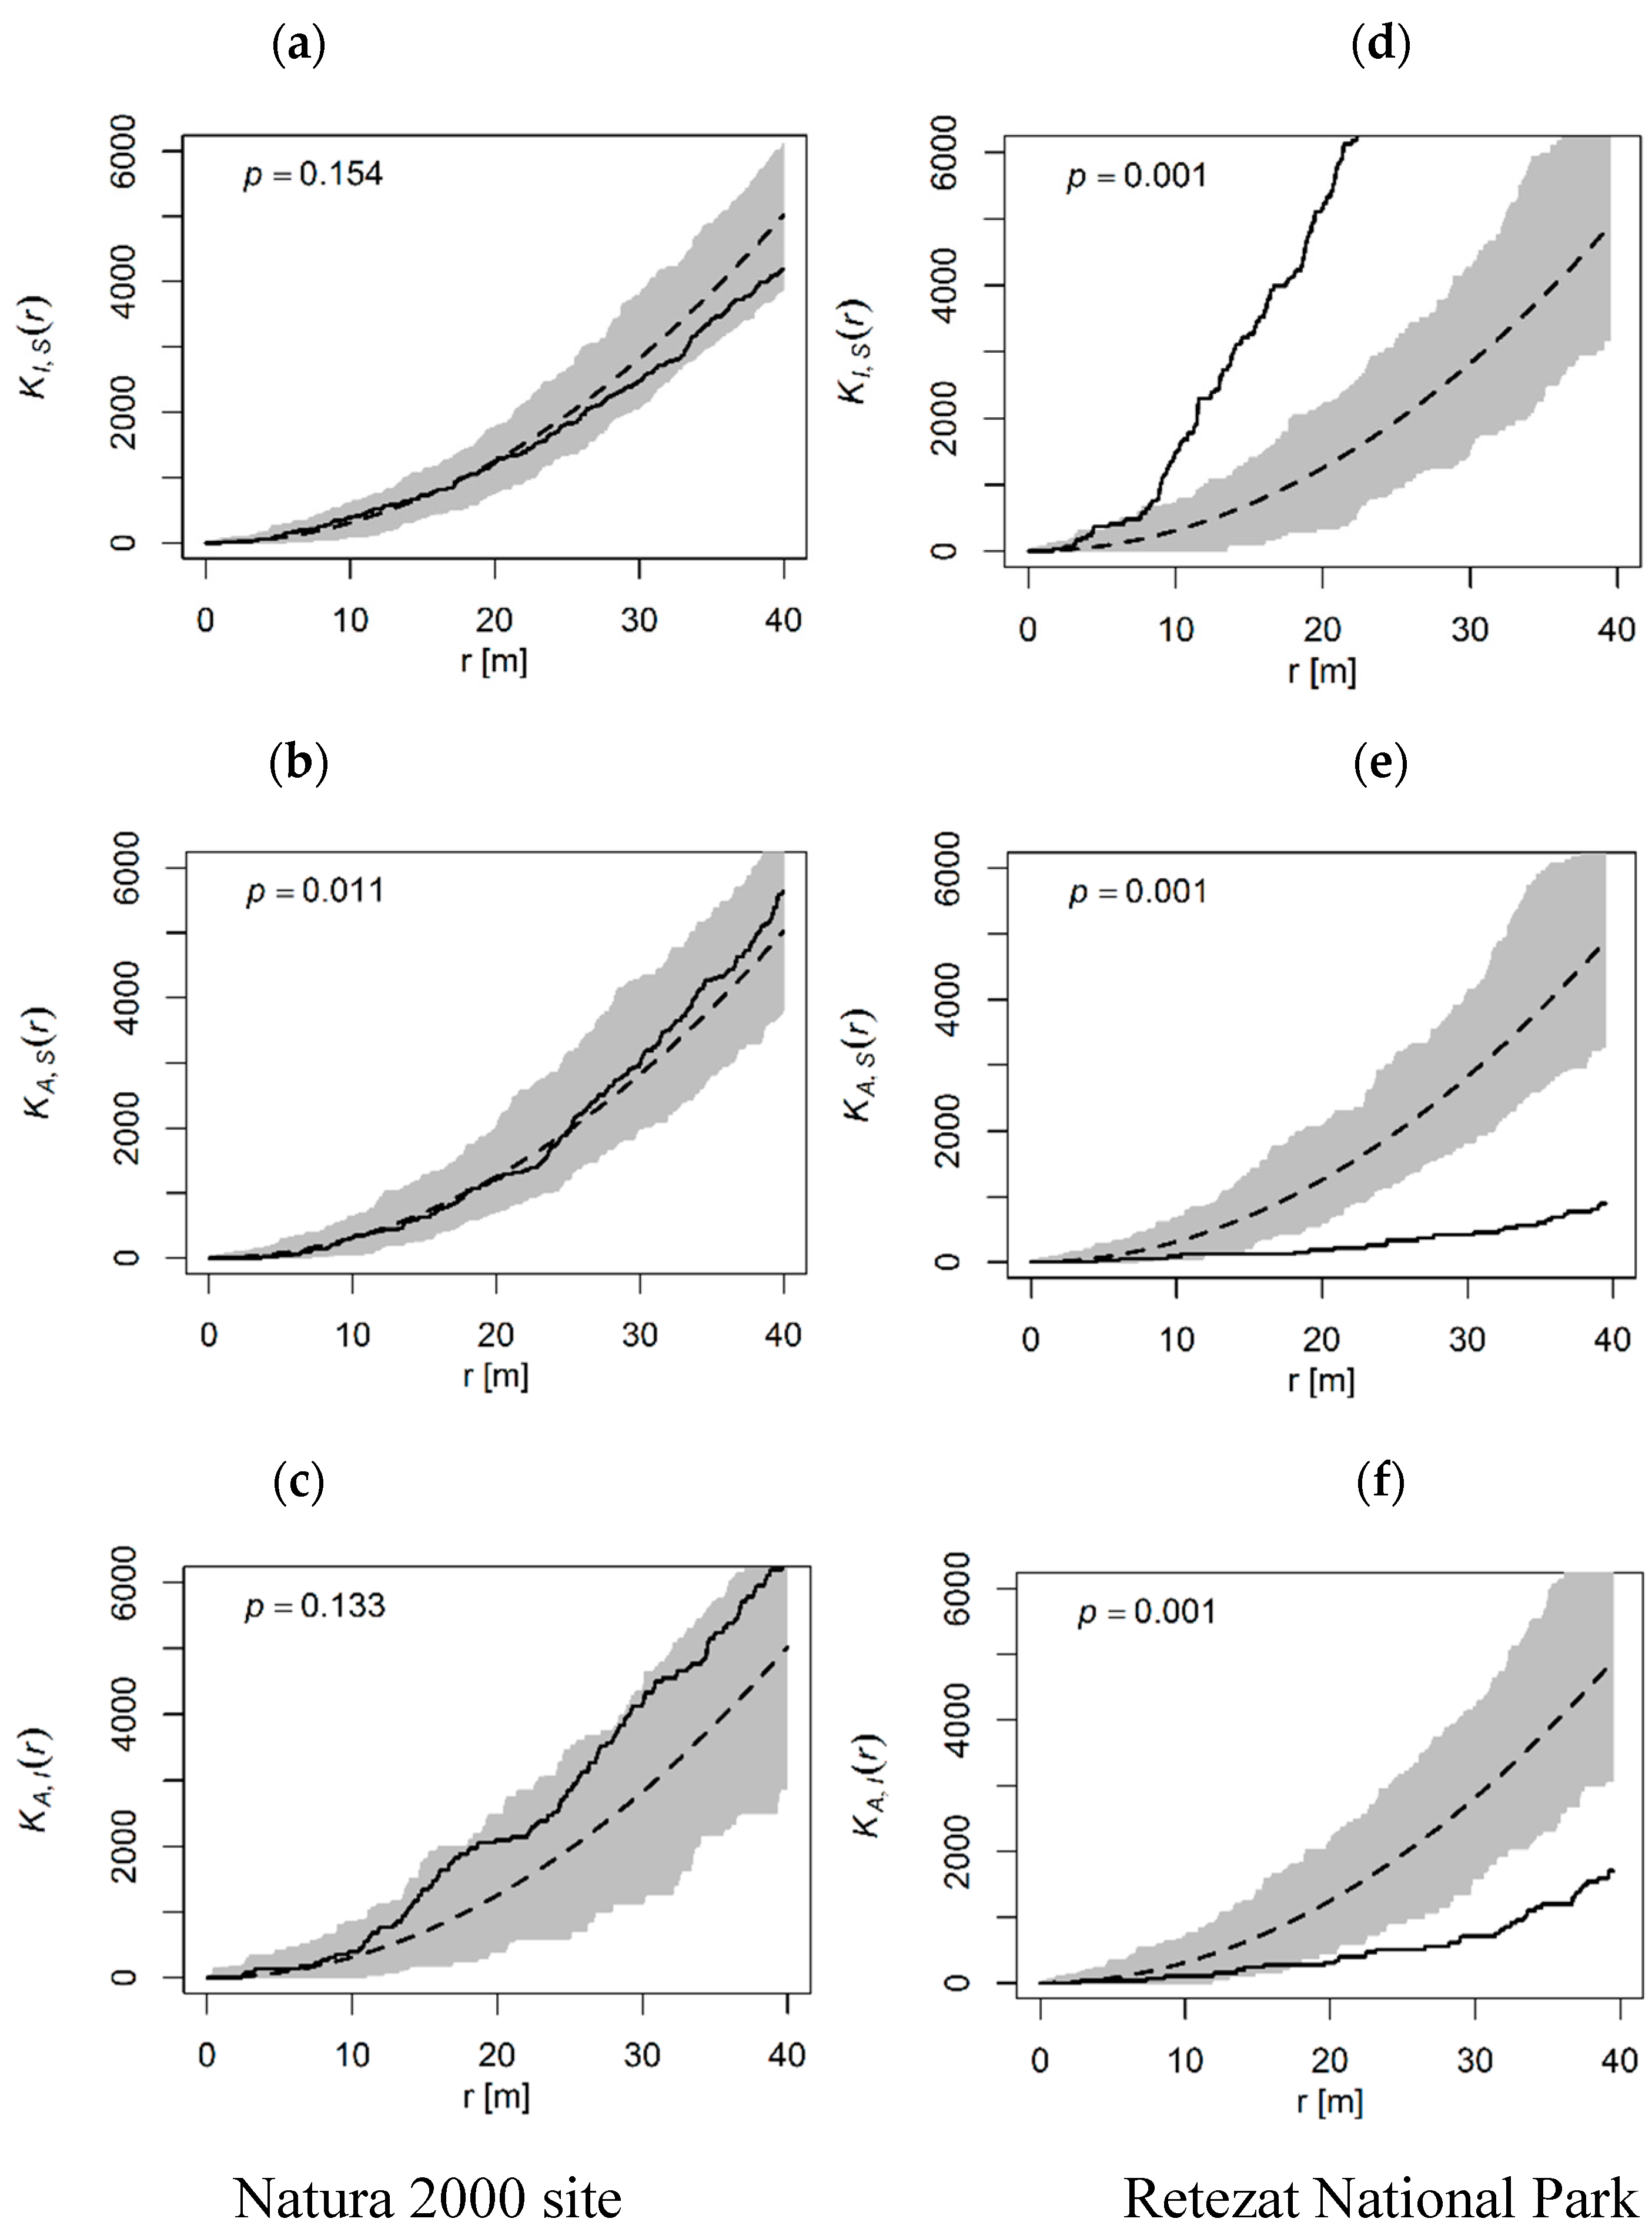
The spatial distribution of tree size classes showed different patterns between the protected areas. In the Natura 2000 site was not a significant pattern between the tree size classes (p > 0.05), although there were variations depending on the spatial structure of the species (Figure 4a–c). The cross-type pair correlation function confirmed the random pattern (p > 0.05).
In the Retezat National Park, only one class presented a positive correlation, the other two had a negative correlation. Although the saplings displayed strong aggregation around the intermediate trees (p = 0.001, Figure 4d), especially at a distance greater than 3 m, they showed a significant negative correlation toward the adults at distances greater than 10 m (p = 0.001, Figure 4e). The cross-type pair correlation function confirmed the significance of spatial patterns (p < 0.001) and presented a similar scale of clustering and segregation. The intermediate trees displayed also a strong negative correlation with respect to adult trees (p = 0.001, Figure 4f), but the values of the cross-type pair correlation presented some variations. The observed values were outside the confidence interval only between 20–30 m, but the overall result was not significant (p > 0.05). This indicates that the pattern was not very strong and the intermediate trees were segregated at a distance of 20–30 m from the adult trees.
3.3. Size Hierarchies
The distribution of the heights and diameters, kmm(r) values, showed different pattern within each protected area. In the Natura 2000 site, both intermediate to sapling and adult to sapling classes displayed a positive correlation, indicating the dominance of trees with larger marks at distances between 10 and 20 meter (p = 0.001, p = 003, Figure 5a,b). The adult to intermediate class showed a random distribution (p = 0.868, Figure 5c). In the Retezat National Park, the adult to sapling and adult to intermediate classes displayed a positive significant correlation (p = 0.001, Figure 5e,f). The pattern was significant at a distance greater than 5 m, indicating an attraction or mutual stimulation effect. Intermediate to sapling size classes displayed a random distribution at all distances (p = 0.889, Figure 5d).
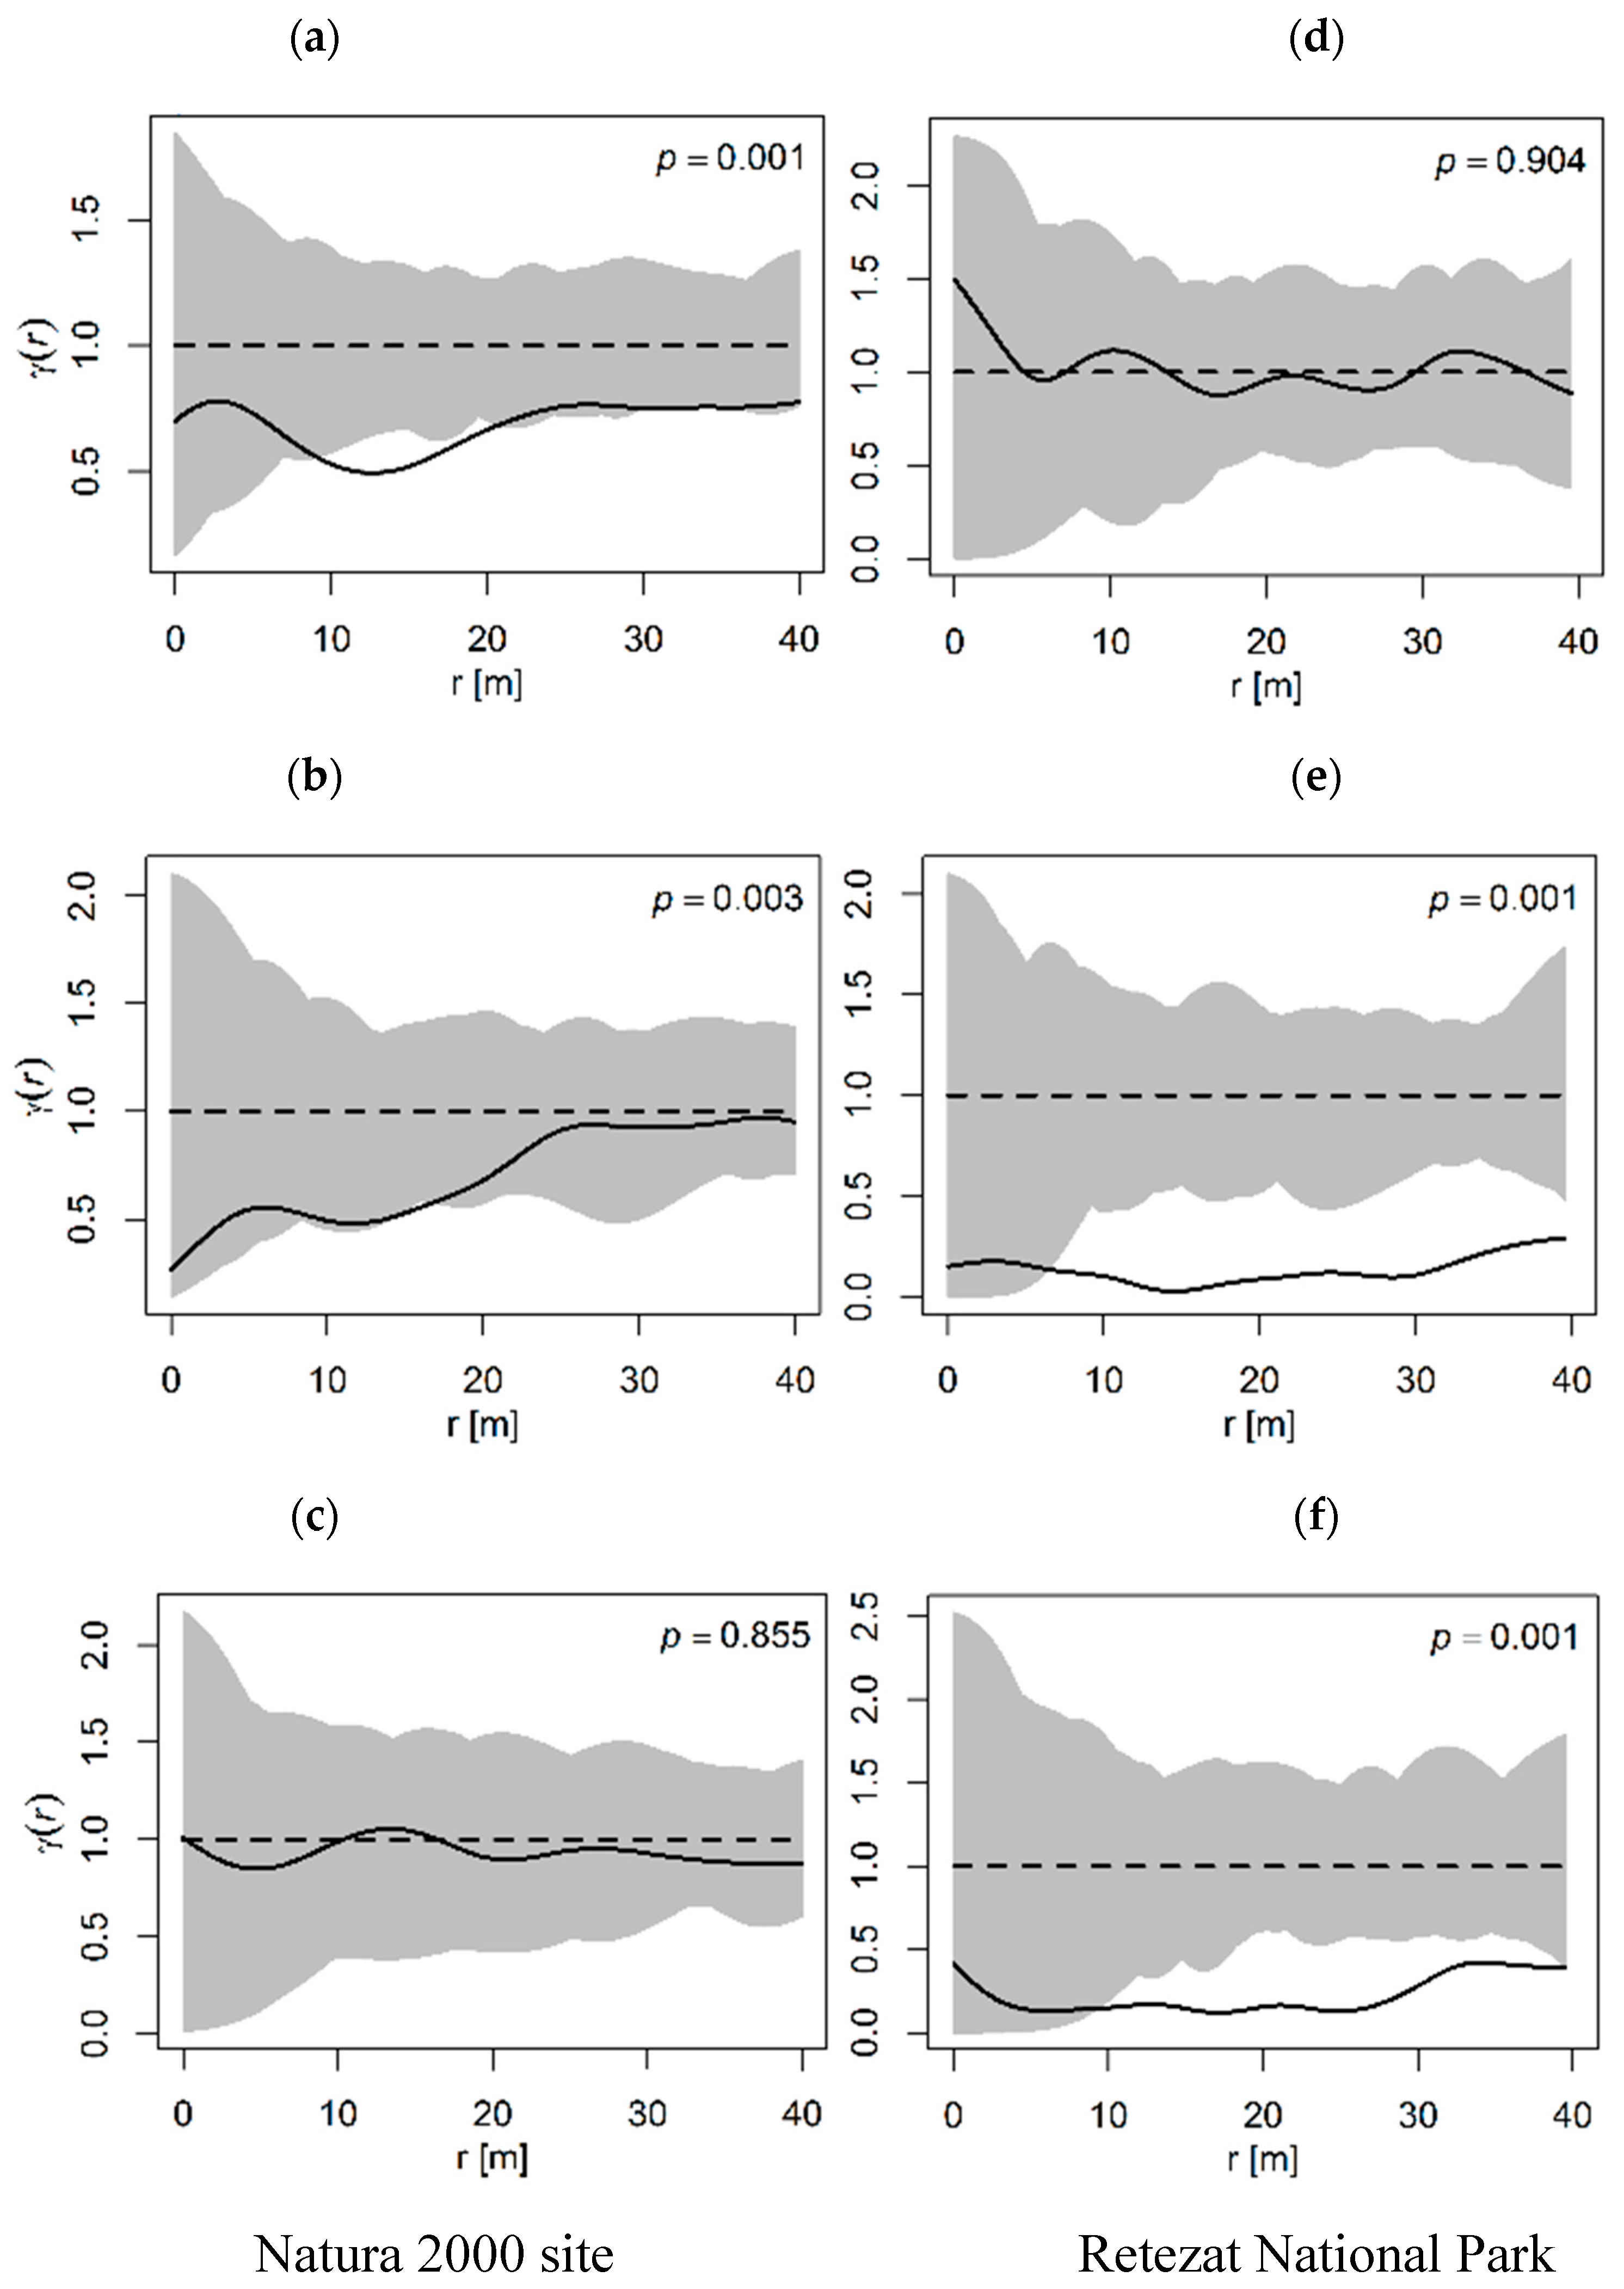
The analysis of the spatial autocorrelation, i.e., mark variogram, showed the distribution and similarity of tree marks, supporting the previous analysis. In the Natura 2000 site, between the intermediate and sapling class was a positive autocorrelation (p = 0.001, Figure 6a). Therefore, at a distance of 10 to 20 m, trees of similar size were more likely to be found together than trees of different sizes. Although the generated line was almost in the confidence interval, the adult to sapling class showed a positive correlation (p = 0.003, Figure 6b). The adult to intermediate class displayed a random pattern (p = 0.855, Figure 6c). In the Retezat National Park, the intermediate to sapling class presented a random distribution (p = 0.904, Figure 6d). The adult to sapling and the adult to intermediate classes displayed a stronger autocorrelation, starting with a distance of 5 m (p = 0.001, Figure 6e,f). In all figures corresponding to mark correlation and mark variogram functions, the troughs and crests of the observed values denoted the oscillations between groups of different sizes. These oscillations showed how different group sizes alternated along the distance r, even if they were not always significantly different. Also, large Kmm (r) values can indicate that patches of large trees were located at a greater distance between them.
4. Discussion
The main objective of the study was to assess the spatial structure and dynamics of isolated populations of P. cembra L. at the treeline ecotone in the Carpathian Mountains. Univariate point pattern analysis was performed to identify the general patterns at the treeline and bivariate point pattern analysis to assess the relationships established between tree size classes and to detect tree size hierarchy. The significant differences detected between and within the protected areas are evidence of population dynamics.
4.1. Spatial Patterns at the Treeline
Despite the heterogeneity of the sites, the spatial patterns of all P. cembra individuals showed different population dynamics. In the Natura 2000 site, the species presented aggregation at a small scale and regularity at a greater scale, whereas in the Retezat National Park was a random to a regular pattern. The observed patterns might have several possible explanations.
Firstly, the clustered pattern might be caused by the selective seed distribution by N. caryocatactes. The bird can cache several thousands of seeds each year. Although the range of activity of N. caryocatactes varies, it can easily cover 700 m in elevation [27], which explains the wide range of P. cembra (~1730–2058 m a.s.l.) above the timberline (forest line) in the Retezat National Park. N. caryocatactes prefers convex topography, with less snow cover, such as small ridges, slopes, and especially rocky outcrops, where makes groups of caches at short distance between them [27,36,54].
Secondly, biotic interactions are another important factor in the establishment of P. cembra. Species establishment is higher above the timberline when there is less seed predation [23]. However, above 2160 m, the mortality increases due to lower temperature limitation [55]. Thicker snow cover and late snowmelt influence the development of snow fungi which are a major factor of sapling mortality [54], leading to the establishment of the species only in certain patches. Recent studies have shown that climatic warming correlated with water limitation can lead to range contraction of Picea engelmannii [56].
Thirdly, large-scale heterogeneity can influence the spatial dynamics of trees [40]. Therefore, using the inhomogeneous functions, we excluded the large-scale variation in habitat, quantifying only the direct plant-plant interaction on the spatial patterns. The regular patterns indicate that trees tend to be at a certain distance apart. Regular patterns are specific to larger trees since competition leads to regularity during the time. However, both sites showed random patterns, often between 10 and 30 m, suggesting that the trees are distributed randomly and that there is no competition or segregation between them. These results are partly in agreement with a previous study conducted in the Stelvio National Park, the Alps, where at the treeline was a clustered pattern, but at the timberline was an aggregated to a regular pattern [25].
4.2. Spatial Structure and Facilitation
The spatial relationship between individuals of different tree sizes can be a consequence of the different protection status of the study sites, which can imply deviations in the spatial structure. Areas with a low level of protection status (such as Natura 2000) and past disturbances, showed spatial patterns that were random. In undisturbed environments, the spatial structure of the species presented cases of strong aggregation but also segregation depending on the main environmental variables. However, in the following paragraphs, we make several assumptions for the existing patterns.
Human disturbance affects the forest structure and tree species can react differently, for instance, regeneration and tree-ring growth decrease or increase depending on the ability of the species to adapt to the disturbance [57,58]. It was shown that after disturbances, the regeneration density decreases with distance from the remnant trees [57]. However, the Natura 2000 site has been protected since 2007 and may not show any visible signs of a regeneration pattern. P. cembra recruitment increased in the Alps after grazing and human disturbances decreased [58]. In addition, in areas disturbed by grazing, the advance of the treeline is curtailed [59,60]. Therefore, a high density of trees at the timberline is expected, but not at the treeline, which can explain the random pattern among tree classes and the low P. cembra range from the Natura 2000 site. Shade-tolerant species, such as Tsuga heterophylla Sarg. had high intraspecific competition in young and old stands [6]. However, random patterns do not support competition between P. cembra size classes. A recent study showed that due to climatic warming, Pinus flexilis E.James established above the treeline even in soils that are a core habitat for Pinus longaeva D.K.Bailey [61]. Our study does not include information about neighboring species, therefore, even if there is no intraspecific competition, further research is needed to verify interspecific competition.
The clustered pattern between intermediate and sapling class from the Retezat National Park population indicates attraction and facilitation relationship among individuals. Facilitation and competition can shape the structure and dynamics of the species and their balance changes over different life stages of the species [5,6]. Saplings were strongly segregated from the adult trees in the Retezat National Park, but independent in the Natura 2000. Although it has been shown that N. caryocatactes hides the seeds near tree trunks [62], the results suggest that the saplings recruitment is higher at a greater distance from the adult trees in the Retezat National Park.
Growth and establishment of this species are strongly linked to temperature [58,59,63]. In the Retezat National Park, the majority of the intermediate trees and sapling individuals were found on the plot located at the upper elevation (1886 m a.s.l.). The results have shown that saplings were strongly aggregated around the intermediate trees, indicating that they grow together at a similar elevation. Moreover, the segregation pattern of adult from the sapling and intermediate individuals confirm that is a different spatial distribution between the adult and the juvenile trees. In the last 60 years, many tree species, including P. cembra advanced in elevation, colonizing the treeline ecotone, as a result of recent warming [64]. Long-term protection status conferred by the Retezat National Park can be translated into a natural establishment of P. cembra at a higher elevation. Since neither seed distribution nor human disturbance limited the distribution of the species, it can shift to a higher elevation. Along the Romanian Carpathian range, Rodna National Park (IUCN category II) benefits from a long conservation history, such as the Retezat National Park, hence, P. cembra is well-represented there. Whereas in areas with a low level of protection status and influenced by past disturbances, such as Natura 2000 sites or natural parks (IUCN category V), the species is mostly underrepresented [16,19]. In undisturbed areas of the Alps, recruitment and growth of P. cembra started at the treeline around 1850. This increase was attributed to higher summer temperatures [58]. The general upward shift of the treeline due to a higher temperature is accepted and supported by several studies [59,64,65]. Therefore, the spatial segregation of adults from the sapling and intermediate individuals is not strictly related to the lack of facilitation, but rather to the recent increase in temperature. Our findings reveal that sapling recruitment is not directly enhanced by the presence of larger trees nearby, being in agreement with the Janzen–Connell hypothesis. This seems to be a pattern available for both areas, but further research is needed to provide possible explanations for this.
4.3. Local Size Hierarchies
The positive spatial correlations, as well as autocorrelations between the intermediate to sapling size classes and adult to sapling size classes from the Natura 2000 population, indicate that similar-sized trees formed patches, whereas adult and intermediate trees were mixed. In the National Park, although the adult to sapling size classes and adult to intermediate size classes formed groups of the same size, the sapling to intermediate trees were mixed together. Beside the patchy structure, the positive spatial correlations indicate an attraction and mutual stimulation between trees with similar size [46,66]. Trees in patches tend to be larger than those outside a patch [50,52]. On the one hand, these patterns could have been produced because of variations in microsite conditions such as nutrient and light availability. On the other hand, might be the effect of a self-thinning process [67]. Due to the limitations induced by the accuracy of the data, inhibition at a lower scale can be obscured, but larger-scale patterns can be clearly detected [68].
Such positive autocorrelations are usually characteristic of a natural forest, where trees are distributed in a clumped or random manner [52]. Therefore, even the protection status offered by the Natura 2000 network can be beneficial for the species in the long term, since low aggregation was already detected. Another study showed a spatial aggregation of P. cembra in the Alps after a long period of time without human disturbances [28]. Similar results have been observed also at the initial stage of a subalpine Abies forest [52].
5. Conclusions
The study evaluated the spatial structure and dynamics of two Pinus cembra populations at the treeline ecotone in the Carpathian Mountains. There is strong evidence of variation within P. cembra’s spatial structure when comparing the two sites. Firstly, there was a variation of tree spatial structure among protected areas. The spatial distribution of all trees showed clustered patterns at a small distance and regular patterns at greater distances in the Natura 2000 site, whereas in the Retezat National Park showed a random pattern. Secondly, there were also different relationships between the tree size classes within each study site. The spatial patterns within the Natura 2000 population were mainly random, with few positive autocorrelations, but in the Retezat National Park population, adult trees formed their own groups, spatially separated from the sapling and intermediate trees. In addition, sapling and intermediate trees were highly aggregated, forming groups at higher elevations in the Retezat National Park, indicating an upward shift.
These results contribute to a new background in the debate regarding the treeline dynamics and the mechanisms that are controlling it. This study demonstrates that there are several similarities and dissimilarities in the spatial structure depending on the past and present forest management, anthropogenic disturbances and natural regeneration of P. cembra. Considering spatial patterns of two isolated populations of P. cembra at the treeline ecotone, we captured the differences and similarities of their dynamics and functioning. There are numerous arguments that support our findings, but further research is needed in order to generalize them. The quantitative description of P. cembra’s spatial patterns provides forest managers with specific information to enhance the regeneration to maintain the genetic diversity of these isolated tree populations. Further research is needed to reveal the relationships between P. cembra individuals and heterospecific neighboring trees.
Supplementary Materials
The following are available online at https://www.mdpi.com/1999-4907/10/4/326/s1, Table S1: Plots design. The treeline ecotone range and the elevation of the plots. Pinus cembra L. size classes: sapling, intermediate, adult.
Author Contributions
Both authors contributed to the formulation of the study; M.B. collected the data; M.B. analyzed the data; M.B. and C.B. wrote the paper. All authors have seen and agreed to the submitted version of the manuscript.
Funding
We acknowledge support from the ECOPOTENTIAL project EU Horizon 2020 research and innovation programme, grant agreement No. 641762.
Acknowledgments
We would like to thank Reinhold Stahlmann for the map graphic design, Ion Catalin Petritan for the constructive comments and suggestions provided and the administration of the Retezat National Park for the help for data collection. We thank Timothy James Smith for the English language suggestions.
Conflicts of Interest
The authors declare no conflict of interest.
References
- Hanski, I. Metapopulation Dynamics. Nature 1998, 396, 41–49. [Google Scholar] [CrossRef]
- Nathan, R.; Muller-Landau, H.C. Spatial patterns of seed dispersal, their determinants and consequences for recruitment. Trends Ecol. Evol. 2000, 15, 278–285. [Google Scholar] [CrossRef] [Green Version]
- MacArthur, R.H. Geographical Ecology. Patterns in the Distribution of Species; Harper and Row: New York, NY, USA, 1972. [Google Scholar]
- Levin, S.A. The problem of pattern and scale in ecology: the Robert H. MacArthur award lecture. Ecology 1992, 73, 1943–1967. [Google Scholar] [CrossRef]
- Callaway, R.M.; Walker, L.R. Competition and facilitation: a synthetic approach to interactions in plant communities. Ecology 1997, 78, 1958. [Google Scholar] [CrossRef]
- Getzin, S.; Dean, C.; He, F.; Trofymow, J.A.; Wiegand, K.; Wiegand, T. Spatial patterns and competition of tree species in a Douglas-fir chronosequence on Vancouver Island. Ecography 2006, 29, 671–682. [Google Scholar] [CrossRef] [Green Version]
- Bruno, J.F.; Stachowicz, J.J.; Bertness, M.D. Inclusion of facilitation into ecological theory. Trends Ecol. Evol. 2003, 18, 119–125. [Google Scholar] [CrossRef]
- Janzen, D.H. Herbivores and the number of tree species in tropical forests. Am. Nat. 1970, 104, 501–528. [Google Scholar] [CrossRef]
- Connell, J.H. On the role of natural enemies in preventing competitive exclusion in some marine animals and in rain forest trees. In Dynamics of Populations; Boer, P.J.D., Gradwell, G.R., Eds.; Centre for Agricultural Publication and Documentation: Wageningen, The Netherlands, 1971; pp. 298–312. [Google Scholar]
- Martínez, I.; González Taboada, F.; Wiegand, T.; Obeso, J.R. Spatial patterns of seedling-adult associations in a temperate forest community. For. Ecol. Manag. 2013, 296, 74–80. [Google Scholar] [CrossRef]
- Hille Ris Lambers, J.; Clark, J.S.; Beckage, B. Density-dependent mortality and the latitudinal gradient in species diversity. Nature 2002, 417, 732–735. [Google Scholar] [CrossRef]
- Camarero, J.J.; Gutiérrez, E.; Fortin, M.-J.; Ribbens, E. Spatial patterns of tree recruitment in a relict population of Pinus uncinata: forest expansion through stratified diffusion. J. Biogeogr. 2005, 32, 1979–1992. [Google Scholar] [CrossRef]
- Wiegand, T.; Moloney, K.A. Handbook of Spatial Point-Pattern Analysis in Ecology; Chapman and Hall/CRC: Boca Raton, FL, USA, 2014. [Google Scholar]
- Casalegno, S.; Amatulli, G.; Camia, A.; Nelson, A.; Pekkarinen, A. Vulnerability of Pinus cembra L. in the Alps and the Carpathian Mountains under present and future climates. For. Ecol. Manag. 2010, 259, 750–761. [Google Scholar] [CrossRef]
- Farjon, A.; Pinus Cembra. The IUCN Red List of Threatened Species 2017: E.T42349A95684563. Available online: https://doi.org/10.2305/IUCN.UK.2017-2.RLTS.T42349A95684563.en (accessed on 12 September 2018).
- Blada, I. Pinus cembra distribution in the Romanian Carpathians. Ann. For. Res. 2008, 51, 115–132. [Google Scholar]
- Höhn, M.; Gugerli, F.; Abran, P.; Bisztray, G.; Buonamici, A.; Cseke, K.; Hufnagel, L.; Quintela-Sabarís, C.; Sebastiani, F.; Vendramin, G.G. Variation in the chloroplast DNA of Swiss stone pine (Pinus cembra L.) reflects contrasting post-glacial history of populations from the Carpathians and the Alps. J. Biogeogr. 2009, 36, 1798–1806. [Google Scholar] [CrossRef]
- Dzialuk, A.; Chybicki, I.; Gout, R.; Mączka, T.; Fleischer, P.; Konrad, H.; Curtu, A.L.; Sofletea, N.; Valadon, A. No reduction in genetic diversity of Swiss stone pine (Pinus cembra L.) in Tatra Mountains despite high fragmentation and small population size. Conserv. Genet. 2014, 15, 1433–1445. [Google Scholar] [CrossRef] [Green Version]
- Blada, I. Zâmbrul: I. Importanță și Areal; Editura Silvică, Seria ‘Manuale, tratate, monografii’: Voluntari, Romania, 2015. (In Romanian) [Google Scholar]
- Vucetich, J.A.; Waite, T.A. Spatial patterns of demography and genetic processes across the species’ range: null hypotheses for landscape conservation genetics. Conserv. Genet. 2003, 4, 639–645. [Google Scholar] [CrossRef]
- Hampe, A.; Petit, R.J. Conserving biodiversity under climate change: The rear edge matters. Ecol. Lett. 2005, 8, 461–467. [Google Scholar] [CrossRef]
- Iojă, C.I.; Pătroescu, M.; Rozylowicz, L.; Popescu, V.D.; Vergheleţ, M.; Zotta, M.I.; Felciuc, M. The efficacy of Romania’s protected areas network in conserving biodiversity. Biol. Conserv. 2010, 143, 2468–2476. [Google Scholar] [CrossRef]
- Neuschulz, E.L.; Merges, D.; Bollmann, K.; Gugerli, F.; Böhning-Gaese, K. Biotic interactions and seed deposition rather than abiotic factors determine recruitment at elevational range limits of an alpine tree. J. Ecol. 2018, 106, 948–959. [Google Scholar] [CrossRef]
- Evans, D. Building the European Union’s Natura 2000 network. Nat. Conserv. 2012, 1, 11–26. [Google Scholar] [CrossRef] [Green Version]
- Lingua, E.; Cherubini, P.; Motta, R.; Nola, P. Spatial structure along an altitudinal gradient in the Italian central Alps suggests competition and facilitation among coniferous species. J. Veg. Sci. 2008, 19, 425–436. [Google Scholar] [CrossRef] [Green Version]
- Körner, C.; Paulsen, J. A world-wide study of high altitude treeline temperatures. J. Biogeogr. 2004, 31, 713–732. [Google Scholar] [CrossRef]
- Holtmeier, F.-K. Mountain Timberlines: Ecology, Patchiness, and Dynamics, 2nd ed.; Preface. Advances in global change research; Springer: Dordrecht, The Netherlands, 2009. [Google Scholar]
- Watson, J.E.M.; Dudley, N.; Segan, D.B.; Hockings, M. The performance and potential of protected areas. Nature 2014, 515, 67–73. [Google Scholar] [CrossRef]
- Gray, C.L.; Hill, S.L.L.; Newbold, T.; Hudson, L.N.; Börger, L.; Contu, S.; Hoskins, A.J.; Ferrier, S.; Purvis, A.; Scharlemann, J.P.W. Local biodiversity is higher inside than outside terrestrial protected areas worldwide. Nat. Commun. 2016, 7, 12306. [Google Scholar] [CrossRef] [Green Version]
- Gehrig-Fasel, J.; Guisan, A.; Zimmermann, N.E. Tree line shifts in the Swiss Alps: Climate Change or Land Abandonment? J. Veg. Sci. 2007, 18, 571–582. [Google Scholar] [CrossRef]
- Shandra, O.; Weisberg, P.; Martazinova, V. Influences of climate and land use history on forest and timberline dynamics in the Carpathian Mountains during the twentieth century. In The Carpathians: Integrating Nature and Society Towards Sustainability; Kozak, J., Ostapowicz, K., Bytnerowicz, A., Wyżga, B., Eds.; Springer: Berlin/Heidelberg, Germany, 2013; pp. 209–223. [Google Scholar]
- Mihai, B.; Savulescu, I.; Sandric, I. Change detection analysis (1986–2002) of vegetation cover in Romania: a study of alpine, subalpine, and forest landscapes in the Iezer Mountains, Southern Carpathians. Mt. Res. Dev. 2007, 27, 250–258. [Google Scholar] [CrossRef]
- Urdea, P.; Törok-Oance, M.; Ardelean, M.; Vuia, F.; Voiculescu, M. Geomorphological aspects of the human impact in the alpine area of Southern Carpathians (Romania). Hrvat. Geogr. Glas. 2009, 71, 19–31. [Google Scholar] [CrossRef]
- Oberhuber, W. Influence of climate on radial growth of Pinus cembra within the Alpine timberline Ecotone. Tree Physiol. 2004, 24, 291–301. [Google Scholar] [CrossRef]
- Popa, I.; Kern, Z. Long-term summer temperature reconstruction inferred from tree-ring records from the Eastern Carpathians. Clim. Dyn. 2009, 32, 1107–1117. [Google Scholar] [CrossRef]
- Carrer, M.; Urbinati, C. Spatial analysis of structural and tree-ring related parameters in a timberline forest in the Italian Alps. J. Veg. Sci. 2001, 12, 643–652. [Google Scholar] [CrossRef]
- Urdea, P.; Vuia, F. Aspects of the periglaciar relief in the Parâng Mountains. Rev. Geomorfol. 2000, 2, 35–39. Available online: http://www.geomorfologie.ro/wp-content/uploads/2015/07/Revista-de-geomorfologie-nr.-2-2000-p.-35-39.pdf (accessed on 14 November 2018).
- Vespremeanu-Stroe, A.; Urdea, P.; Popescu, R.; Vasile, M. Rock glacier activity in the Retezat Mountains, Southern Carpathians, Romania. Permafr. Periglac. Process. 2012, 23, 127–137. [Google Scholar] [CrossRef]
- R Core Team R: A Language and Environment for Statistical Computing; R Foundation for Statistical Computing: Vienna, Austria, 2018; Available online: https://www.R-project.org (accessed on 20 August 2018).
- Getzin, S.; Wiegand, T.; Wiegand, K.; He, F. Heterogeneity influences spatial patterns and demographics in forest stands. J. Ecol. 2008, 96, 807–820. [Google Scholar] [CrossRef] [Green Version]
- Baddeley, A.J.; Møller, J.; Waagepetersen, R. Non- and semi-parametric estimation of interaction in inhomogeneous point patterns. Stat. Neerl. 2000, 54, 329–350. [Google Scholar] [CrossRef]
- Wiegand, T.; Gunatilleke, S.; Gunatilleke, N. Species associations in a heterogeneous Sri Lankan Dipterocarp forest. Am. Nat. 2007, 170, E77–E95. [Google Scholar] [CrossRef]
- Baddeley, A.; Rubak, E.; Turner, R. Spatial Point Pattern Analysis, Model-Fitting, Simulation, Tests. 2019, p. 830. Available online: ftp://ftp.math.ethz.ch/sfs/pub/Software/R-CRAN/web/packages/spatstat/spatstat.pdf (accessed on 15 January 2019).
- Stoyan, D.; Penttinen, A. Recent applications of point process methods in forestry statistics. Stat. Sci. 2000, 15, 61–78. [Google Scholar]
- Diggle, P.J.; Cox, T.F. Some distance-based tests of independence for sparsely-sampled multivariate spatial point patterns. Int. Stat. Rev. Rev. Int. De Stat. 1983, 51, 11. [Google Scholar] [CrossRef]
- Dixon, P.M. Nearest-neighbor contingency table analysis of spatial segregation for several species. Écoscience 2002, 9, 142–151. [Google Scholar] [CrossRef]
- Szmyt, J. Spatial statistics in ecological analysis: from indices to functions. Silva Fenn. 2014, 48. [Google Scholar] [CrossRef]
- Wälder, K.; Wälder, O. Analysing interaction effects in forests using the mark correlation function. Iforest Biogeosci. For. 2008, 1, 34–38. [Google Scholar] [CrossRef] [Green Version]
- Illian, J.; Penttinen, A.; Stoyan, H.; Stoyan, D. Statistical Analysis and Modelling of Spatial Point Patterns: Illian/Statistical Analysis and Modelling of Spatial Point Patterns; John Wiley & Sons, Ltd.: Chichester, UK, 2008. [Google Scholar] [CrossRef]
- Pommerening, A.; Särkkä, A. What mark variograms tell about spatial plant interactions. Ecol. Model. 2013, 251, 64–72. [Google Scholar] [CrossRef]
- Wälder, O.; Stoyan, D. On variograms in point process statistics. Biom. J. 1996, 38, 895–905. [Google Scholar] [CrossRef]
- Suzuki, S.N.; Kachi, N.; Suzuki, J.-I. Development of a local size hierarchy causes regular spacing of trees in an even-aged Abies forest: analyses using spatial autocorrelation and the mark correlation function. Ann. Bot. 2008, 102, 435–441. [Google Scholar] [CrossRef]
- Loosmore, N.B.; Ford, E.D. Statistical inference using the G or K point pattern spatial statistics. Ecology 2006, 87, 1925–1931. [Google Scholar] [CrossRef]
- Barbeito, I.; Brücker, R.L.; Rixen, C.; Bebi, P. Snow fungi-induced mortality of Pinus cembra at the alpine treeline: evidence from plantations. Arct. Antarct. Alp. Res. 2013, 45, 455–470. [Google Scholar] [CrossRef]
- Barbeito, I.; Dawes, M.A.; Rixen, C.; Senn, J.; Bebi, P. Factors driving mortality and growth at treeline: A 30-Year Experiment of 92 000 Conifers. Ecology 2012, 93, 389–401. [Google Scholar] [CrossRef]
- Kueppers, L.M.; Conlisk, E.; Castanha, C.; Moyes, A.B.; Germino, M.J.; de Valpine, P.; Torn, M.S.; Mitton, J.B. Warming and provenance limit tree recruitment across and beyond the elevation range of subalpine forest. Glob. Chang. Biol. 2017, 23, 2383–2395. [Google Scholar] [CrossRef]
- Asselin, H.; Fortin, M.-J.; Bergeron, Y. Spatial distribution of late-successional coniferous species regeneration following disturbance in southwestern Québec boreal forest. For. Ecol. Manag. 2001, 140, 29–37. [Google Scholar] [CrossRef]
- Vittoz, P.; Rulence, B.; Largey, T.; Freléchoux, F. Effects of climate and land-use change on the establishment and growth of cembran pine (Pinus cembra L.) over the altitudinal treeline ecotone in the Central Swiss Alps. Arct. Antarct. Alp. Res. 2008, 40, 225–232. [Google Scholar] [CrossRef]
- Grace, J. Impacts of climate change on the tree line. Ann. Bot. 2002, 90, 537–544. [Google Scholar] [CrossRef]
- Mihai, B.; Săvulescu, I.; Rujoiu-Mare, M.; Nistor, C. Recent forest cover changes (2002–2015) in the Southern Carpathians: a case study of the Iezer Mountains, Romania. Sci. Total Environ. 2017, 599–600, 2166–2174. [Google Scholar] [CrossRef]
- Smithers, B.V.; North, M.P.; Millar, C.I.; Latimer, A.M. Leap frog in slow motion: divergent responses of tree species and life stages to climatic warming in Great Basin subalpine forests. Glob. Chang. Biol. 2018, 24, e442–e457. [Google Scholar] [CrossRef]
- Närmann, F.; Küfmann, C.; Neuschulz, E.L. Präferenzen des Tannenhähers Nucifraga caryocatactes beim Anlegen von Samenverstecken. Ornithol. Anz. 2017, 55, 89–98. [Google Scholar]
- Rolland, C.; Petitcolas, V.; Michalet, R. Changes in radial tree growth for Picea abies, Larix decidua, Pinus cembra and Pinus uncinata near the alpine timberline since 1750. Trees 1998, 13, 40–53. [Google Scholar] [CrossRef]
- Theurillat, J.-P.; Guisan, A. Potential impact of climate change on vegetation in the European Alps: A Review. Clim. Chang. 2001, 50, 77–109. [Google Scholar] [CrossRef]
- Motta, R.; Nola, P. Growth trends and dynamics in sub-alpine forest stands in the Varaita Valley (Piedmont, Italy) and their relationships with human activities and global change. J. Veg. Sci. 2001, 12, 219–230. [Google Scholar] [CrossRef]
- Szmyt, J.; Stoyan, D. Spatial autocorrelation of tree attributes in naturally regenerated managed beech (Fagus sylvatica) forests in the Beskid Niski Mountains, Southern Poland. Dendrobiology 2014, 71, 129–136. [Google Scholar] [CrossRef]
- Reed, D.D.; Burkhart, H.E. Spatial autocorrelation of individual tree characteristics in Loblolly pine stands. For. Sci. 1985, 31, 575–587. [Google Scholar] [CrossRef]
- Freeman, E.A.; Ford, E.D. Effects of data quality on analysis of ecological pattern using the K(d) statistical function. Ecology 2002, 83, 35–46. [Google Scholar] [CrossRef]
Figure 1.
Study sites in the Southern Carpathians, Romania.

Figure 2.
Spatial distribution of Pinus cembra L. within the plots from the Retezat National Park (a,b); and from the Natura 2000 site (c,d). The quantitative marks indicate the tree sizes: sapling (10–130 cm height), intermediate (1–15 cm diameter breast height), adult (>15 cm diameter breast height).

Figure 3.
Spatial pattern (pair correlation g(r)) of all P. cembra L. individuals from the Natura 2000 site (a) and the Retezat National Park (b). The solid line shows observed g(r) values, the dashed line denotes the totally random distribution curve (HP) and the gray area represents the 95% confidence interval.

Figure 4.
The spatial relationship (cross-k function Kij (r)) between individuals belonging to different tree size classes. The solid line shows observed Kij (r) values, the dashed line denotes the complete spatial randomness (CSR) and the gray area represents the 95% confidence interval. (a,d): Intermediate–Sapling, (b,e): Adult–Sapling, (c,f): Adult–Intermediate.

Figure 5.
Multitude of size classes at distance r (mark correlation kmm(r)). The solid line shows observed kmm(r) values, the dashed line denotes the CSR and the gray area represents the confidence envelope. (a,d): Intermediate–Sapling, (b,e): Adult–Sapling, (c,f): Adult–Intermediate.
Figure 5.
Multitude of size classes at distance r (mark correlation kmm(r)). The solid line shows observed kmm(r) values, the dashed line denotes the CSR and the gray area represents the confidence envelope. (a,d): Intermediate–Sapling, (b,e): Adult–Sapling, (c,f): Adult–Intermediate.

Figure 6.
Spatial autocorrelation (mark variogram γ(r)) of Pinus cembra size classes. The solid line shows observed γ(r) values, the dashed line denotes the CSR and the gray area represents the confidence envelope. (a,d): Intermediate–Sapling, (b,e): Adult–Sapling, (c,f): Adult–Intermediate.
Figure 6.
Spatial autocorrelation (mark variogram γ(r)) of Pinus cembra size classes. The solid line shows observed γ(r) values, the dashed line denotes the CSR and the gray area represents the confidence envelope. (a,d): Intermediate–Sapling, (b,e): Adult–Sapling, (c,f): Adult–Intermediate.


Table 1.
Recorded individuals and diameter at breast height for three size classes of Pinus cembra L. in the Carpathian Mountains. Diameter at breast height (DBH).
Table 1.
Recorded individuals and diameter at breast height for three size classes of Pinus cembra L. in the Carpathian Mountains. Diameter at breast height (DBH).
| Plots | Natura 2000 Site | Retezat National Park |
|---|---|---|
| # sapling (10–130 cm height) | 64 | 33 |
| # intermediate (1–15 cm DBH) | 28 | 24 |
| # adult (>15 cm DBH) | 20 | 31 |
| DBH Intermediate (cm) (mean, min-max) | 5.4 (1.9–14.3) | 6.1 (0.6–14.9) |
| DBH Adult (cm) (mean, min-max) | 44.2 (15.2–111.4) | 32.6 (16.5–55.4) |
© 2019 by the authors. Licensee MDPI, Basel, Switzerland. This article is an open access article distributed under the terms and conditions of the Creative Commons Attribution (CC BY) license (http://creativecommons.org/licenses/by/4.0/).
Share and Cite
MDPI and ACS Style
Beloiu, M.; Beierkuhnlein, C. Differences in the Spatial Structure of Two Pinus cembra L. Populations in the Carpathian Mountains. Forests 2019, 10, 326. https://doi.org/10.3390/f10040326
AMA Style
Beloiu M, Beierkuhnlein C. Differences in the Spatial Structure of Two Pinus cembra L. Populations in the Carpathian Mountains. Forests. 2019; 10(4):326. https://doi.org/10.3390/f10040326
Chicago/Turabian StyleBeloiu, Mirela, and Carl Beierkuhnlein. 2019. "Differences in the Spatial Structure of Two Pinus cembra L. Populations in the Carpathian Mountains" Forests 10, no. 4: 326. https://doi.org/10.3390/f10040326
Note that from the first issue of 2016, this journal uses article numbers instead of page numbers. See further details here.