
Diversity, Distribution, and Habitat Association of Anuran Species from Keffa, Southwest Ethiopia
by
 ,
,
Abeje Kassie
1,* ,
,
Afework Bekele Simegn
1,
Bezawork Afework Bogale
1,
Sandra Goutte
2 and
Stephane Boissinot
2 1
Department of Zoological Sciences, College of Natural Sciences, Addis Ababa University, Addis Ababa 1000, Ethiopia
2
Center for Genomics and Systems Biology, New York University Abu Dhabi, Saadiyat Island, Abu Dhabi P.O. Box 129188, United Arab Emirates
*
Author to whom correspondence should be addressed.
Diversity 2023, 15(2), 300; https://doi.org/10.3390/d15020300
Submission received: 14 January 2023
/
Revised: 13 February 2023
/
Accepted: 14 February 2023
/
Published: 17 February 2023
Abstract
:The aim of the current study was to provide a description of the species composition and habitat association of anuran species found in the Keffa area of southwest Ethiopia, among the least studied natural areas in Ethiopia. Data were gathered in both the rainy and dry seasons. Opportunistic observations, audio, and visual encounters were used to perform the survey. To capture different frog species, drift fence and pitfall trap techniques were used. Three habitat types—wetlands, agricultural land, and riverine forests—were explored for the frog species. A total of 3672-person field hours were spent and 5678 individuals of 26 different anuran species from eight different families were recorded. Of these, six species were new records for the Keffa area. Species determination was assessed using morphology and validated with genetic barcoding. The mitochondrial 16S rRNA and COI gene sequence analysis have been used in molecular systematic analyses of the frog species. The Leptopelis ragazzii that was discovered to be present in the earlier study was actually Leptopelis vannutellii, as evidenced by DNA sequencing. The Hyperolius individuals were initially categorized as H. nasutus, but after conducting DNA barcoding, they were found to be H. microps. At least three potential new candidate species (Leptopelis sp. 1, Leptopelis sp. 2, and Phrynobatrachus sp. 1) were discovered. Hyperoliidae was the most abundant family from the recorded anurans, followed by Phrynobatrachidae, while Conrauidae was the least abundant. Most species were found in the wetland habitat, followed by riverine forest, while agricultural land had the least. Wetlands had the highest values for the Shannon diversity index (2.131), followed by agricultural land (1.58) and riverine forests (1.459). The environmental variables revealed that temperature had a considerable negative impact, while precipitation had a non-significantly positive relationship with anuran abundance. The Keffa area is rich in frog species, accounting for 35% of the country’s batrachofauna. However, the habitats have been fragmented and ruined by agricultural expansion, water drainage from the wetlands, and the conversion of horticulture to field crops. We recommend that non-governmental organizations, districts, regional officials, and local people in and around Keffa actively engage in wetland and forest conservation and protection.
1. Introduction
According to [1], over 8524 amphibian species have been identified worldwide and occupy virtually all habitats, with the exception of the coldest and driest regions, as well as the most remote oceanic islands [2]. Amphibians play critical roles in the functioning of ecosystems [3] and they are increasingly being used in pollution studies as bioindicator organisms [4].
The global amphibian decline has been consistently documented over time [5,6,7]. The magnitude of this decline varies by geographical region [8]. Hirschfeld and his colleagues published evidence of frog population declines in Africa [9]. Currently, amphibians are among the world’s most endangered animal groups [10,11,12]. Several factors contribute to amphibian decline, including anthropogenic habitat destruction [6,13], disease due to chytrid fungus [14], climate change [15,16], invasive species, over-exploitation, and pollution [12,17,18]. Among these factors, human-caused habitat destruction has significantly contributed to the global loss and extinction of amphibians [12]. According to studies by [19] and [20], habitat destruction has increased significantly in some parts of Sub-Saharan Africa. This undoubtedly would have an impact on the distribution of associated flora and fauna, including amphibians, that live in its forest and wetland habitats [5].
Ethiopia is among the world’s top 25 biodiversity-rich countries [21], and it is home to two of the world’s 34 biodiversity hotspots, the Eastern Afromontane and Horn of Africa hotspots [22]. This biodiversity of flora and fauna is strongly linked to the region’s geomorphological history [23,24,25], the country’s diverse vegetation, broad range of elevations (from Ras Dejen mountain which is 4533 m above sea level to the Afar Depression which is ~125 m below sea level), climate gradient [19] and the isolation of the Ethiopian highlands relative to other mountainous areas in Africa [25,26,27].
The Great East African Rift Valley divides the Ethiopian highlands into the northwestern and southeastern highlands [23,24]. As a result, these highlands have developed distinct vegetation and ecosystem types [19].
Ethiopia, being a tropical country, has a generally humid climate that favors the survival of different amphibian species. More than 80 amphibian species have been reported so far [1,28] and 40 species are endemic to the country.
Since the first half of the eighteenth century until 1986, very few studies have investigated the diversity of Ethiopian amphibians [29]. There are still significant gaps in our knowledge of the country’s amphibians although the last two decades have seen a renewed interest in the study of Ethiopian frogs [25,27,28,30,31,32,33,34,35,36,37]. These recent studies have uncovered an additional diversity and several new species have been discovered [27,28,31,32,37]. This suggests that the amphibian diversity of Ethiopia could still be underestimated. In particular, little is known about the frog diversity in the southwest region of the country and the goal of the present study is to fill this gap.
This study provides a detailed analysis of the patterns in amphibian species richness and distribution in relation to habitat types in the Keffa, southwest Ethiopia. Some morphological and molecular studies have been conducted on frog species, but these are few and do not include most of the frog species. The present study aimed to identify the taxonomic status of the frog species of Keffa. Frog samples collected from the area were utilized to compare genetic variation to other taxa, for which nucleotides of the mitochondrial 16S rRNA and COI have previously been sequenced. This clarified frog species taxonomy of the area. In addition to, this, the impact of environmental parameters on frog abundance was investigated. Our research provides insights into the variety and community ecology of amphibians in the Keffa forest and wetlands and emphasizes the significance of these areas for conservation.
2. Materials and Methods
2.1. Study Area
This study was carried out in different habitats located in the Keffa areas of southwest Ethiopia. Extreme slope gradients are formed by the altitudinal variation, ranging from flat lowlands to incredibly steep regions (Figure 1). The area, which is mainly highland, is a component of the Eastern Afromontane Biodiversity Hotspot, with evergreen montane cloud forest. Most of the plain areas are grassy wetlands that numerous rivers’ originate from.
2.2. Sampling Design
This study was carried out both during the wet and dry seasons from July 2018 to February 2022. The study area was stratified into three habitats: riverine forest, wetlands, and agricultural land (as shown in Figure S1). Seventeen sampling sites were randomly selected for data collection. In each study site, a 600 m rectangular transect, a north–south extension of 200 m, and an east–west extension of 100 m were built starting at a random point [38]. Fifty-one transects, i.e., three transects from each study site, were identified and analyzed (Table S1).
2.3. Data Collection
Standardized visual and acoustic transect sampling methods were used to collect data on frog species diversity and distribution [38,39]. Each transect was searched for four hours, six days each during the wet and dry seasons. A team of three people sampled three transects per day at a constant speed from 6:00 to 9:00 a.m. during the day and 6:00 to 9:00 p.m. at night using a head torch to maximize species number and abundance. Although many frog species call much later than 9:00 pm, we were not allowed to stay in the field after 9:00 pm due to security concerns. Visual encounter survey, opportunistic observations, acoustic encounter surveys, and drift fence and pitfall trap methods developed by [40] and ref. [38] were used to conduct the search. Drift fence and pitfall traps (Figure 2) were used to collect amphibian species from the riverine forest habitat [38]. The drift fence and pitfall traps were checked twice a day, early morning and before sunset. An active search for amphibians was conducted at random in locations away from the transect lines, which included turning over logs, leaf litter, tree holes, rocks, and other potential hiding places. All captured specimens were placed in a separate plastic bag with moist leaves or grass for further identification. When possible, species identification was done on the field using published papers, keys, and field guidebooks [29,32,37,41,42,43,44]. Individuals that were not identified on sites were collected as voucher specimens and euthanized by topical application of 20% benzocaine gel and fixed in a 10% formalin solution for 24–48 h. Then, it was subsequently transferred to 70% ethanol for preservation and finally deposited at the Ethiopian Biodiversity Institute Museum, Addis Ababa. Tissue (from muscle/liver) was collected for further DNA analysis and preserved in 97% or 100% ethanol. All environmental data of the study areas were obtained from [45]. Habitat type and geographic coordinates were recorded for all individual amphibians sighted where geographic coordinates were determined using a Garmin GPS 72.
2.4. DNA Barcoding
Species were identified in the field whenever possible, but liver/mucle tissue was also barcoded to ensure correct field identification and to determine whether any cryptic and/or candidate species were present. Liver or muscle tissue was taken and placed in 2.0 mL Eppendorf tubes containing 97% or 100% ethanol.
All DNA extractions were carried out using the Qiagen Tissue and Blood kit in accordance with the manufacturer’s instructions. Given the universal success of 16S primers and the widespread use of this mitochondrial region for anuran barcoding, we chose to amplify this region, sequencing at least two individual representatives from each morphologically identified species. The following were the PCR thermo-cycling conditions: 2 min at 94 °C, followed by 35 cycles of 94 °C for30 s, 48 °C for 30 s and 72 °C for 1 min, finishing with an elongation step of 72 °C for 1 min. A 48 μL master mix PCR reaction volume was used, using the primer pair 16S_F, 5′- CGCCTGTTTAYCAAAAACAT-3′ and 16S_R, 5′- CCGGTYTGAACTCAGATCAYGT-3′. For Leptopelis species, Cytochrome c oxidase I (COI) was also sequenced to improve taxonomic identification using the primer pair COILEP-F1, 5′-GCATAGTCGGAACCGCTTTA-3′ and COILEP-R1, 5′-GGGTCGAAGAATGTGGTGTT-3′.
The PCR thermocycling conditions for COI were; 2 min at 94 °C, followed by 30 cycles of 94 °C for 30 s, 58 °C for 30 s and 72 °C for 1 min, finishing with an extension step of 72 °C for 1 min. The BGISEQ-500 sequencing service was used to sequence unpurified PCR products in both the forward and reverse directions. All amplicons were sequenced at BGI using Sanger sequencing.
2.5. Data Analyses
The frog species diversity of each habitat and across the different sites was analyzed by using the formula of the Shannon–Wiener diversity index (H′) [46,47]:
where s is the number of frog species, Pi is the proportion of the total sample belonging to the i-th frog species and ln is a natural logarithm. Species richness was the total number of frog species recorded in one community.
The Simpson diversity index was calculated to determine the dominance of frog species using the formula:
The evenness index of frog species in the study area was calculated using the following equation [47]:
where E = Shannon evenness index,
E = H′/ln (s)
H′ = Shannon–Wiener diversity index,
ln = the natural logarithm, and
s = the number of frog species recorded in one community.
The evenness index has a range of values from 0 to 1; and as the value approaches 1, the species are evenly distributed and vice versa. Diversity indices between habitats were compared in Past software [48] with Multiple Hutcheson t-tests using Package ecolTest version 0.0.1 [49]. Frog species composition and turnover were compared between habitats and study sites using Sorenson’s Coefficient Similarity Index (SCSI) [50] and Jaccard’s Coefficient Similarity Index [51], calculated as JCSI = a/(a + b + c) and SCSI = 2a/(2a + b + c), where a is the number of species that are present in both habitats (site)1 and habitat (site)2, b is the number of species that are present only in one habitat (site)1, and c is the number of species that are present only in habitat (site)2. A low degree of similarity indicates a high rate of turn over as the index provides a range from 0 (there are no species shared by the two habitats) to 1 (two habitats have a completely identical set of species).
Sampling effort was assessed using a species accumulation curve generated by the vegan package’s specaccum function [52]. Frog species diversity was estimated by the habitat type using Hill numbers developed by [53], this is the second approach to measure species diversity. We considered q = 0 (frog species richness), q = 1(exponential of Shannon’s entropy index) and q = 2 (inverse of Simpson’s concentration index) and q representing the effective number of species. These analyses were performed using iNEXT online [54]. We chose this approach in addition to traditional estimators because it allows us to compare species richness despite differences in sampling effort and, most importantly, because it allows us to extrapolate and compare species richness at equal sample coverage even with the smallest samples [53]. The iNEXT package [55] was used to generate rarefaction curves with 200 bootstraps to estimate 95% confidence limits (CL) and only records from transects (26 frog species); general search records were excluded from these analyses.
To analyze the relative importance of some environmental parameters such as temperature, precipitation, altitude, and slope, we fitted generalized linear models [56] to the data using the GLM function implemented in the statistical package nlme [57]. Since our data were not over dispersed, the analyses were carried out with Poisson distribution and log link function. To demonstrate the significance of frog diversity indices at the p 0.05 level, the Diversity t-test and Multiple Hutcheson t-tests were used, and all analytical data procedures were carried out using the R software package version 4.2.1 [58] and Paleontological Statistics (PAST) version 4.11 educational software package [48].
Mitochondrial sequences were visualized, trimmed and aligned in MEGA11 Software [59] and were run through nucleotide BLAST (NCBI) to confirm frog species identity. Sequences retrieved from GenBank as well as the sequences we generated were used in a phylogenetic analysis using the Maximum Likelihood (ML) method [60], based on the Tamura–Nei distances. The final dataset that contained PCR products from all samples was 419 base pairs for Phrynobatrachus species and 505 base pairs for Leptopelis species. The GeneBank accession numbers were listed in Table 1. The robustness of the nodes was assessed by 1000 bootstrap replicas of the data [61]. Evolutionary distances between sequences were computed using the p-distance method [62].
3. Results
3.1. Anuran Abundance in the Keffa Area
A total of 3672 man-hours were spent for searching anurans in the study sites. A total of 5678 frogs were captured and identified. Although the majority of individuals could be identified unambiguously using morphology alone, it was not always the case, in particular for individuals belonging to the Ptychadena, Leptopelis and Phrynobatrachus genera, and hence barcoding was computed. Barcoding of Ptychadena confirmed the validity of our morphological assignment and indicated the presence in the study area of a number of endemic grass frogs such as P. beka, P. erlangeri, P. neumanni and P. doro (Table 2).
In this study, we discovered that the small Phrynobatrachus in the Keffa area probably belong to an undescribed species (Table 2, Figure 3). The ML phylogram distinguished this new species, provisionally called Phrynobatrachus sp. 1, as a taxon distinct from other small Phrynobatrachus species previously recorded from Ethiopia. Based on the genetic distance matrix, there is a distance of 5.7% between Phrynobatrachus sp. 1 and P. minutus, a distance of more than 4.8% between Phrynobatrachus sp. 1 and P. inexpectatus, and a distance of more than 9.5 % between Phrynobatrachus sp. 1 and the undescribed P. sp. “Oromia” (Table S2).
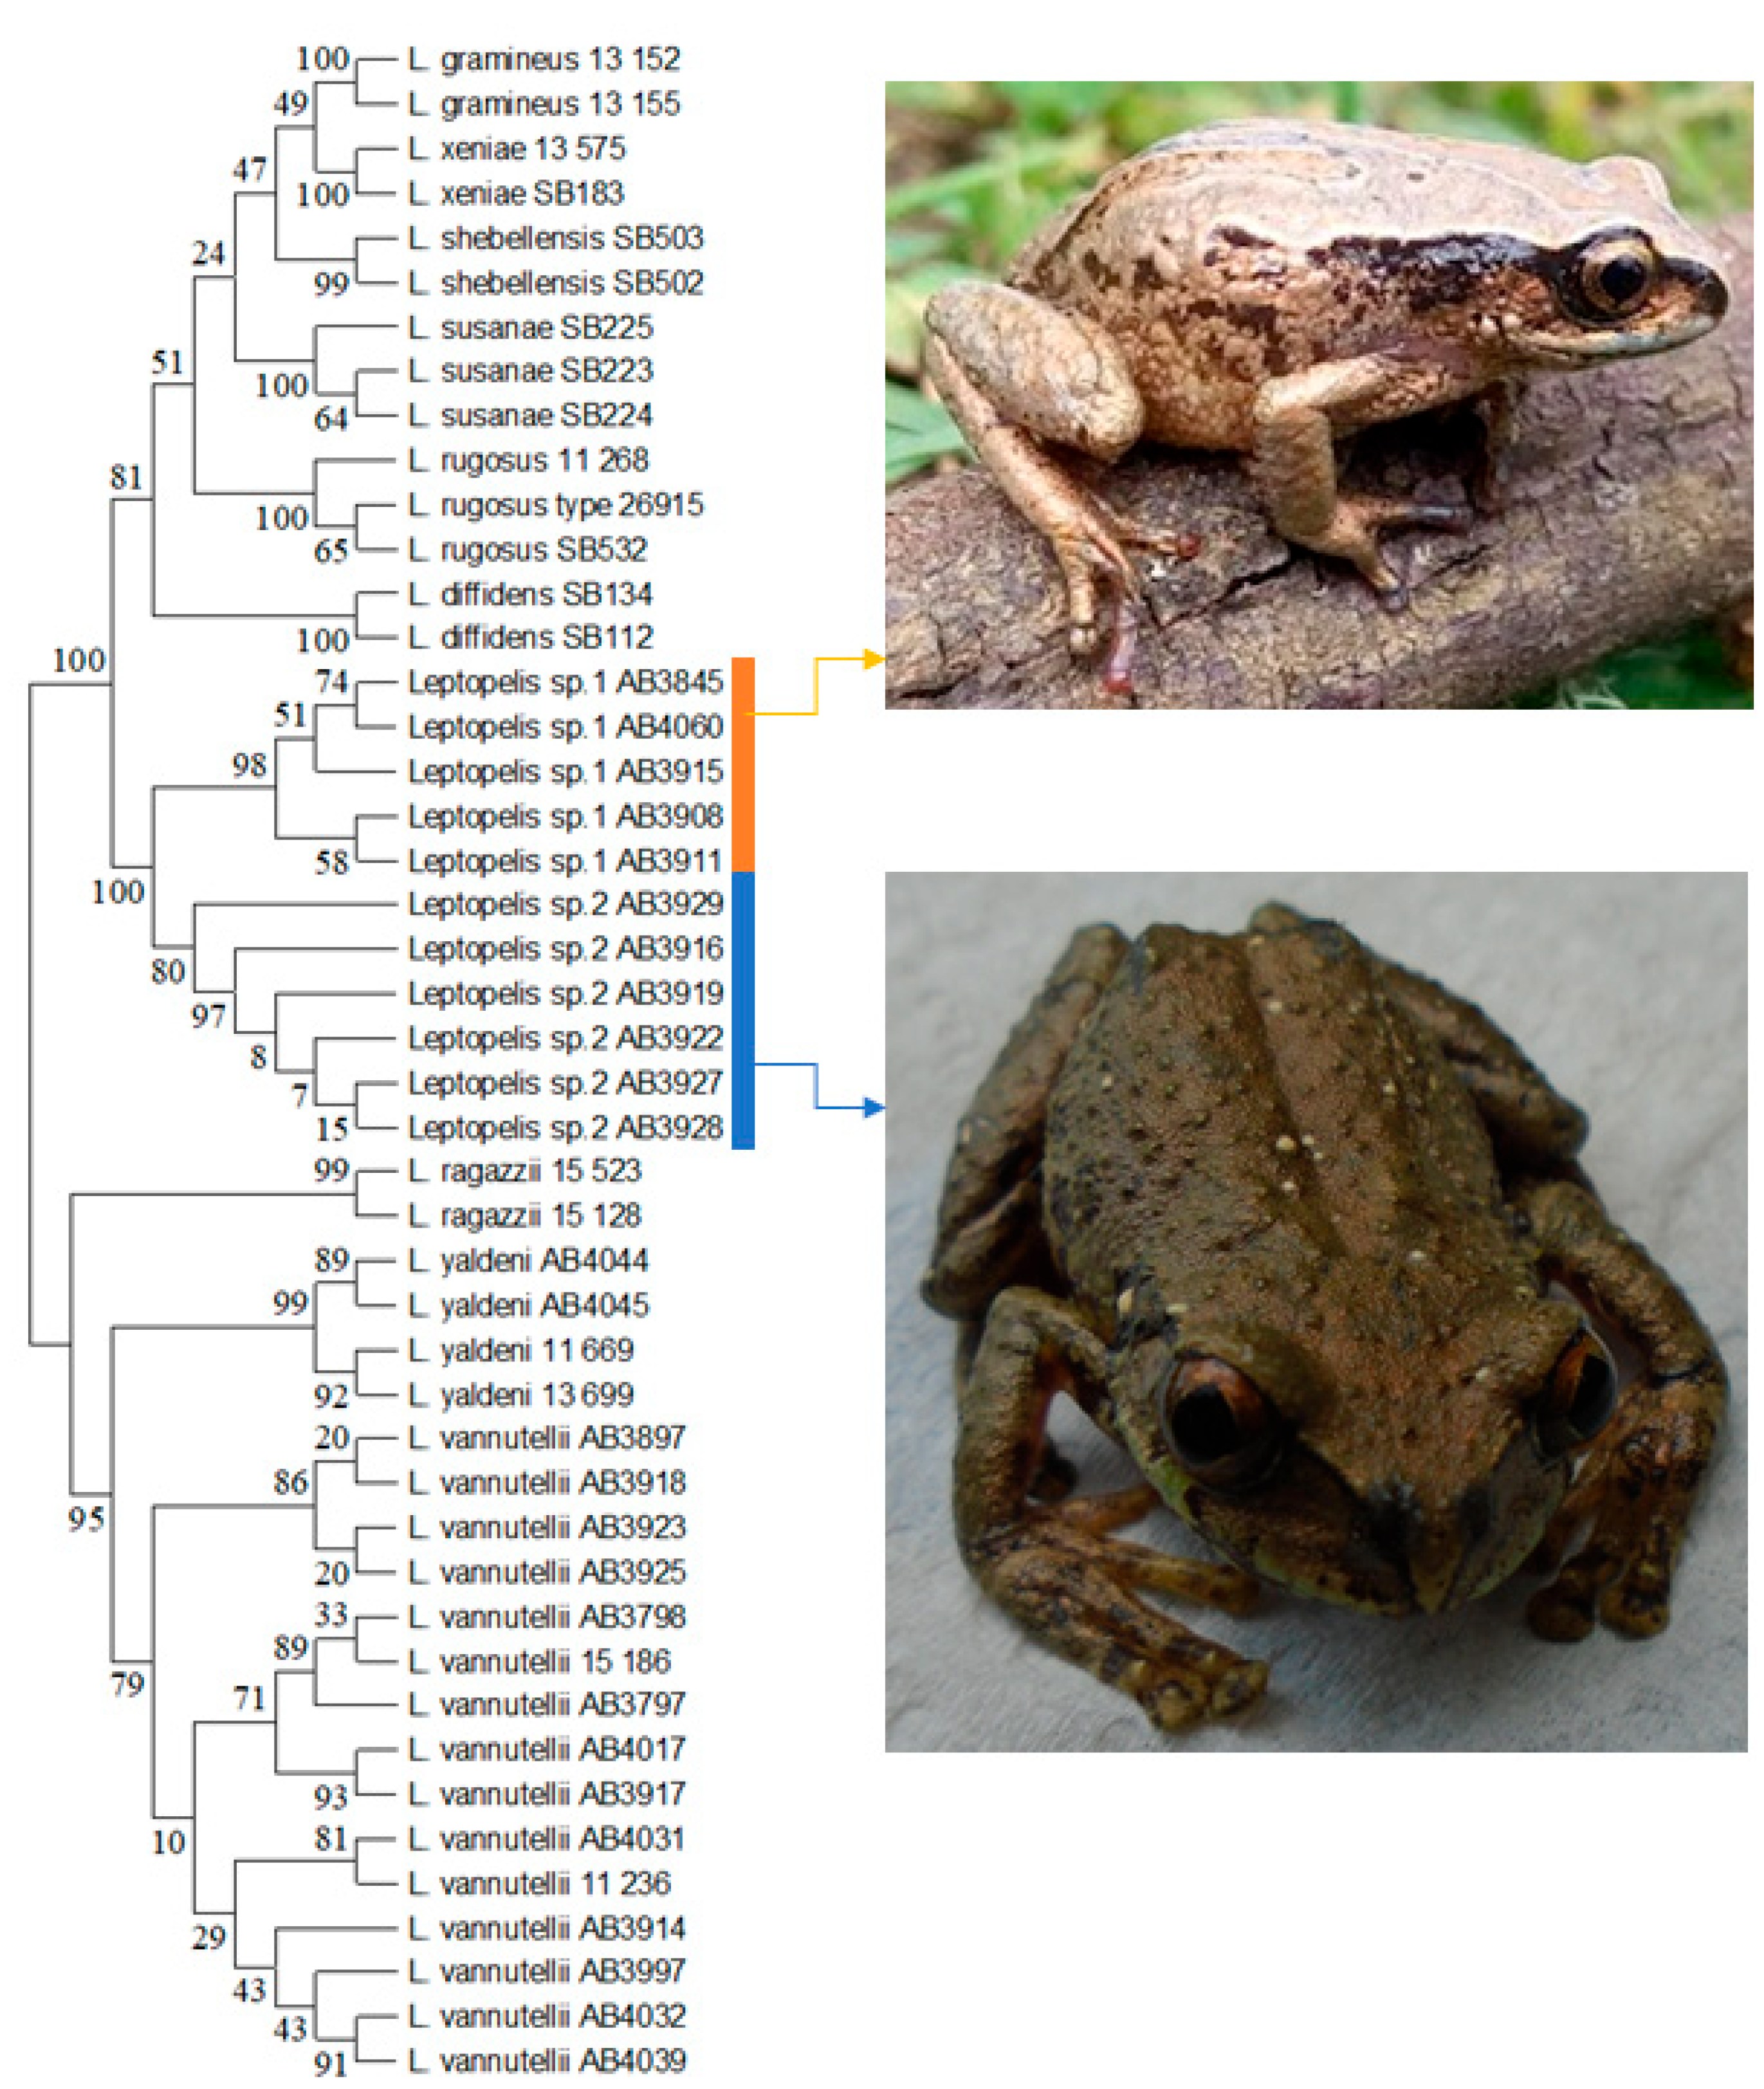
In addition, eleven specimens represent two undescribed Leptopelis species, Leptopelis sp. 1 and Leptopelis sp. 2 (Table 2, Figure 4). The DNA barcodes of Leptopelis sp. 1 and Leptopelis sp. 2 were distinguished from previously recorded Leptopelis species found in NCBI (National Center for Biotechnology Information) using nucleotide BLAST (Basic Local Alignment Search Tool). Moreover, the genetic distance between the undescribed Leptopelis species and others is higher as shown in Table S3 and Figure 4. Results of the ML tree (Figure 4) clearly grouped the Leptopelis sp. 1 and Leptopelis sp. 2 sequences separately, and with high bootstrap support, from all other Ethiopian taxa. Leptopelis sp. 1 is 4.0% genetically distinct from Leptopelis sp. 2, 9.1% distinct from Leptopelis susanae, and 12.9% distinct from Leptopelis vannutellii (Table S3). Individuals of Leptopelis sp. 1 were collected from a grassy wetland at an altitude of 2390 m, which is surrounded by pristine forest that is well preserved. Leptopelis sp. 1 has also been found in the Boqa wetland in Keffa’s Adiyo district at an elevation of 2428 m (Figure 1). Leptopelis sp. 2 was collected in an Enset plantation at an altitude of 2427 m in Ganeti village of Bita district, about 90 km northwest of Bonga town. Based on morphological characteristics such as the nature of the fingers and toe pads shape, the green dorsum, the black marking of a vertebral stripe, bifurcating anteriorly and confluent with the black interorbital bar that connects the upper eyelids (Figure 5), we identified as L. susanae in the previous study. However, it needs a DNA barcode to confirm L. susanae since this is relatively far from the only known locality for the species. As a result, we have given it the temporary name Leptopelis cf. susanae.
In the previous study, Hyperolius nasutus was reported from the Keffa area identified using morphological characteristics using different identification keys. This study compared the sequenced 16S gene with the existing Hyperolius species from NCBI using BLAST and it showed that it is H. microps, not H. nasutus.
Altogether, this study identified 26 different anuran species from eight different families in the area. According to the International Union for Conservation of Nature (IUCN), four of them (Leptopelis cf. susanae, Afrixalus clarkei, Xenopus largeni, and Afrixalus enseticola) are currently listed as threatened, while Ptychadena erlangeri is classified as near threatened (Table S4). Most species were found in the wetland habitat (19 species and 4457 individuals), followed by riverine forest (10 species and 720 individuals), while agricultural land supported the least (9 species and 501 individuals). The relative abundance of species varied with habitat types, with a few common species coexisting and with a significant number of rare species. Phrynobatrachus sp. 1 had the highest relative abundance (20.38) occurring in Riverine Forest and wetland habitats, followed by Phrynobatrachus natalensis (18.38%) only being recorded in wetland habitat. Afixalus clarkei (16.27%) occurred in all the three habitat types. Leptopelis cf. susanae had the least relative abundance (0.04) and were found only in wetland habitats (Table 2).
Hyperoliidae was the most abundant family (2204 individuals from seven species), followed by the Phrynobatrachidae (2201 individuals from 2 species) and Conrauidae was least (seven individuals from single species) (Table 3). Hyperoliidae (seven species), Ptychadenidae (seven species) and Arthroleptidae (four species) were the families with the highest species richness, while Conrauidae and Pyxicephalidae had the lowest (only one species each) (Table 3).
3.2. Diversity Indices of Anuran Species among the Habitat Types
Shannon–Wiener indices were determined to represent the diversity of frogs in the agricultural, riverine, and wetland habitats. The diversity of frogs found in the agricultural land was 1.58 (1.50, 1.65 at 95% CI), riverine forest 1.46 (1.38, 1.53 at 95% CI) and wetland 2.13 (2.10, 2.16 at 95% CI). Multiple Hutcheson t-tests showed that there was a significant difference between wetland and other habitats (p-value < 0.05), but no significant difference between agricultural land and riverine forest (p-value > 0.05).
The diversity t-test also indicated a significant difference between the wetland and agricultural land (t = −14.275, df = 806.66, p < 0.05) and wetland and riverine forest (t = −13.799, df = 912.98, p < 0.05) but differed between agricultural land and riverine forest (t = 1.62, df = 1274.7, p > 0.05). The Shannon–Wiener (H) and Simpson (D) diversity indices indicated that wetland had the highest species diversity compared to riverine forest and agricultural land. As shown in Figure 6D, in contrast to riverine forest, the species were more uniformly dispersed in agricultural land and wetland habitats.
3.3. Accumulation Curve
The species accumulation curve depicts the rate at which new species are added as the sampling effort continues. Figure 7 shows that new species are still being discovered in the study area, albeit at a slower rate. At this sampling effort, the rarefied number of species based on 51 transects resulted in 26 species.
3.4. Species Richness Estimation
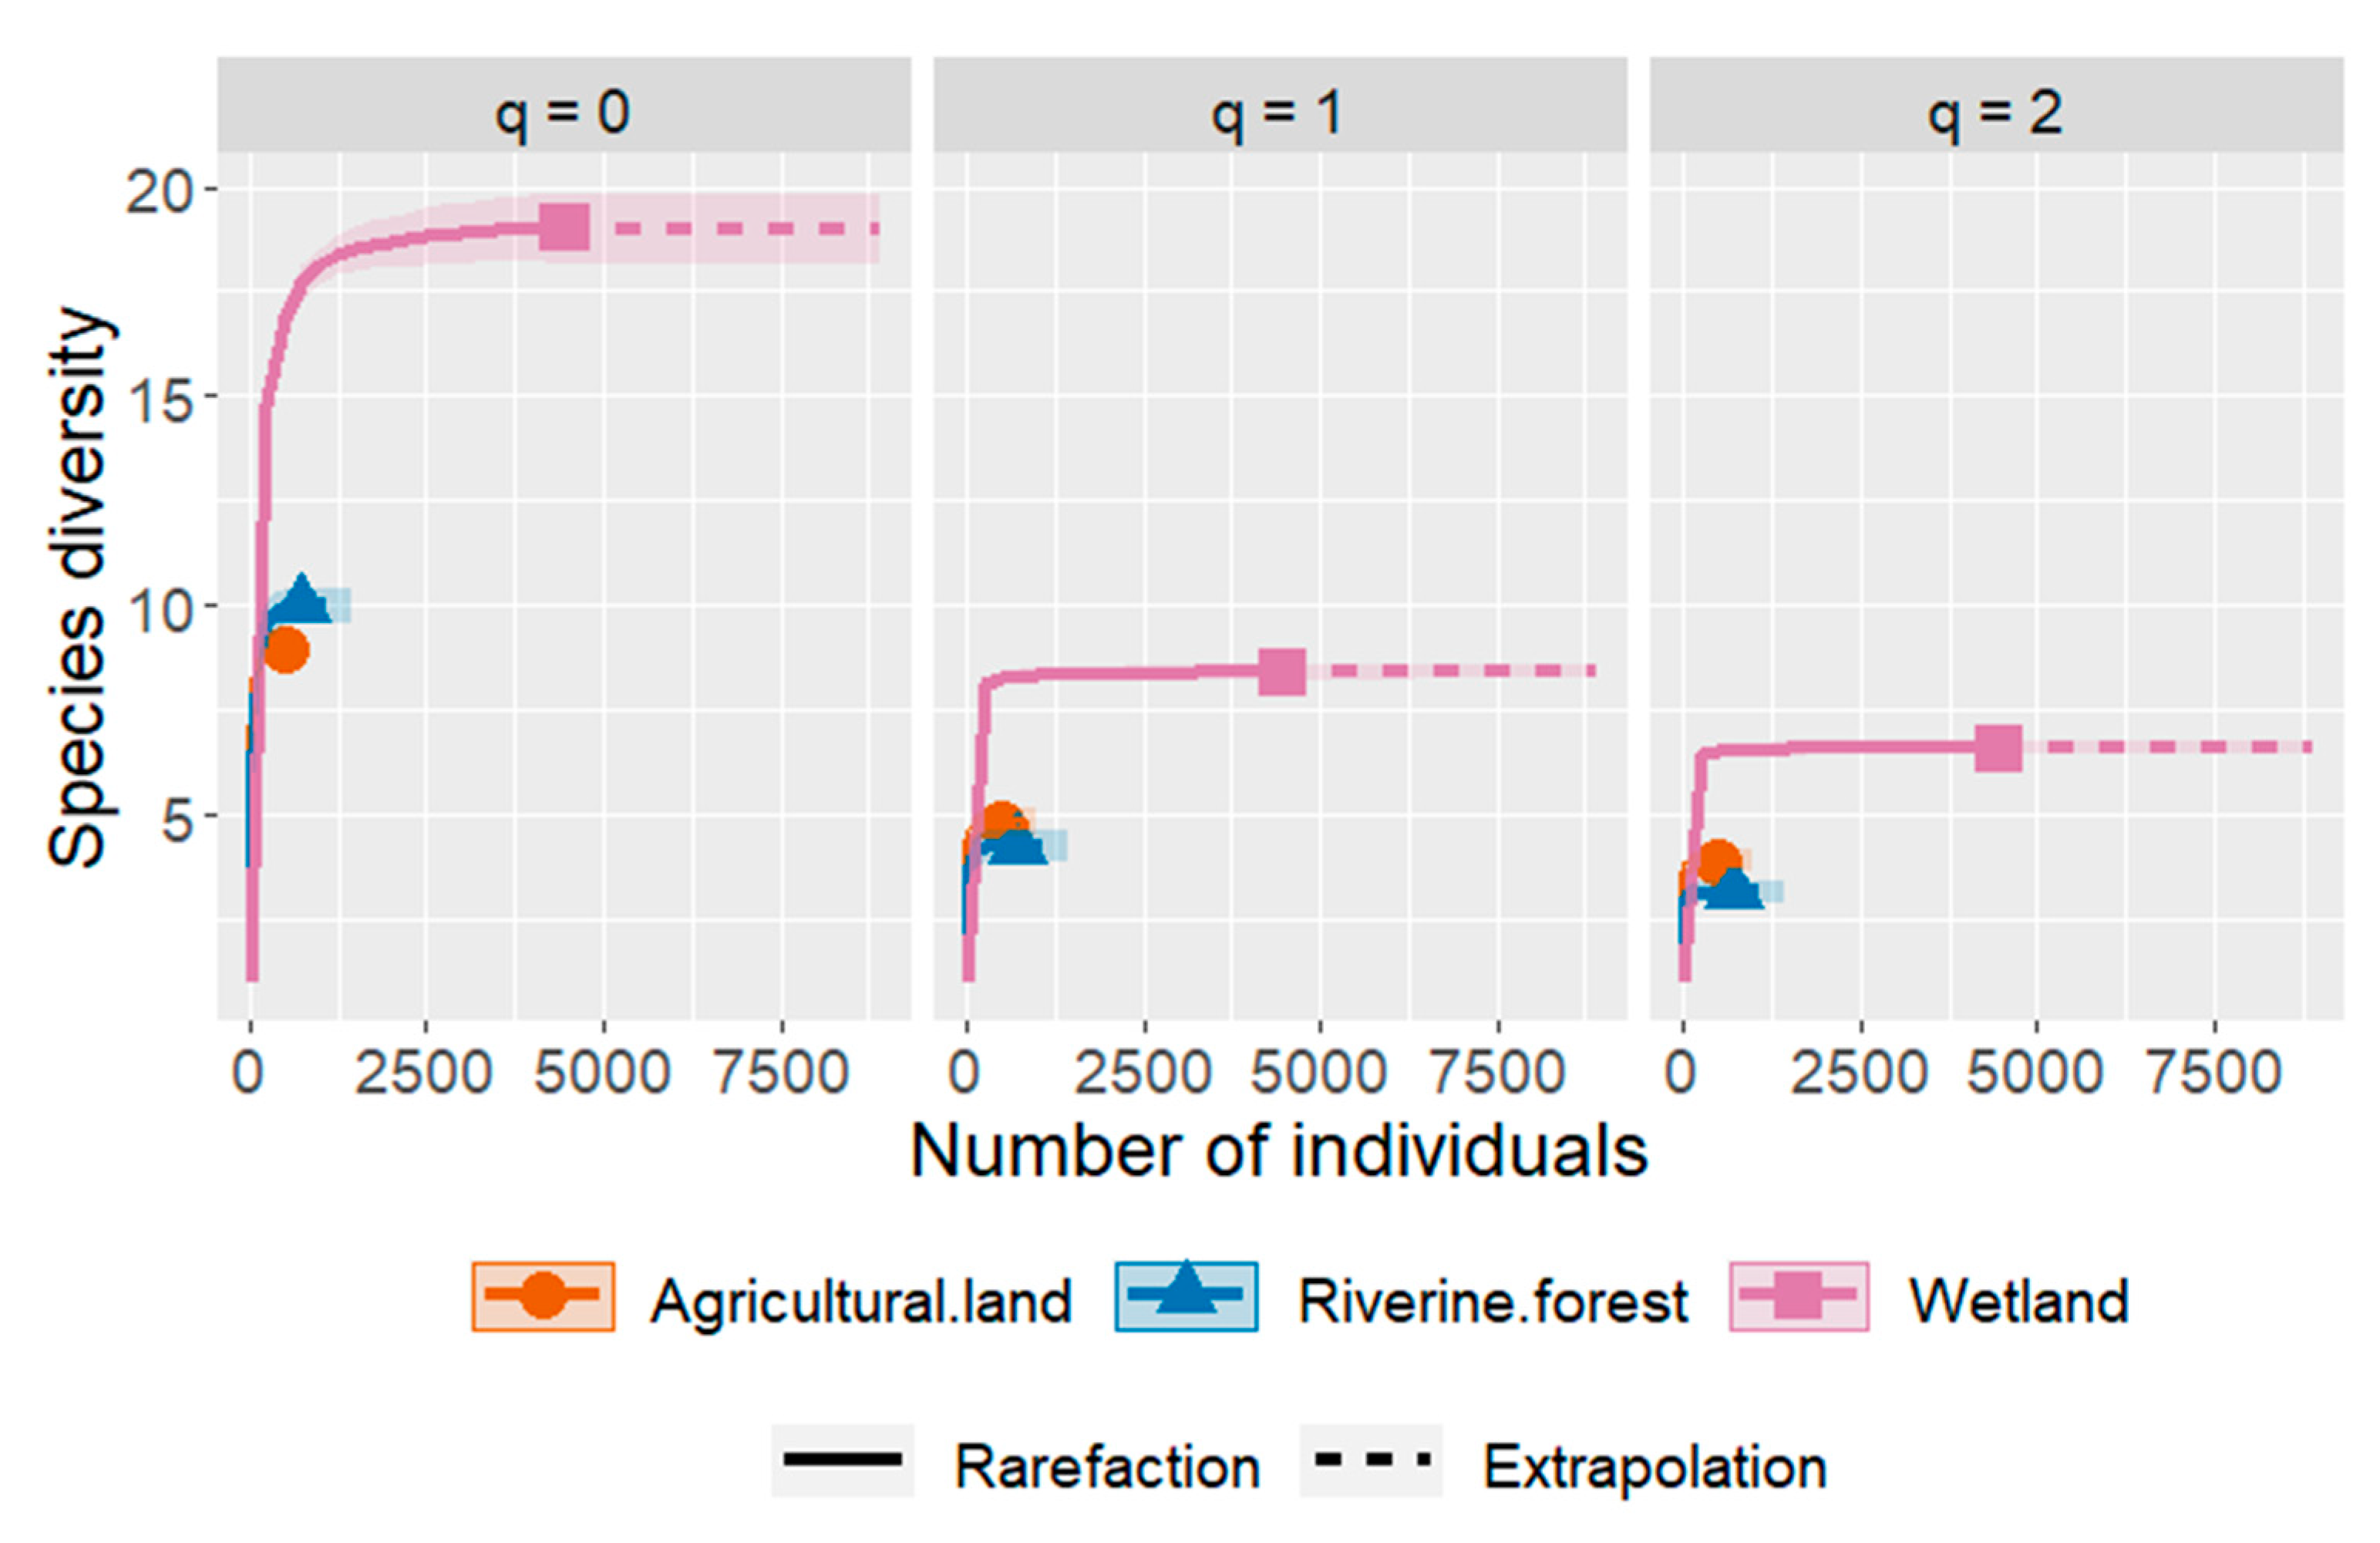
The Chao1 index was used to calculate the estimated total number of species per habitat type. Interpolation (rarefaction) and extrapolation curves showed that species richness ranged from 9 to 19 among habitats (Figure 8). Measures of diversity show that wetland habitat had the highest diversity (Chao1 = 19 ± 0.76, H = 8.79 ± 0.12), followed by the riverine forest in species richness (Chao1 = 10 ± 0.59, H = 4.55± 0.17) and agricultural land (Chao1 = 9 ± 0.00, H = 4.85 ± 0.20).
3.5. Similarity Indices of Frog Species between Habitats
Species similarity analysis between paired agricultural land and riverine forest habitats, agricultural land and wetland as well as riverine forest vs. wetland habitats showed SCSI and JCSI values of less than 0.50 representing 40%, 34% and 39% of species similarity by SCSI and 25%, 21% and 24% by JCSI, respectively (Table 4).
Utali vs. Shuneti had the highest Sorensen’s similarity indices of 92% followed by Bariacho vs. Nata, and Bariacho vs. Medabo, which had both 91%. Komba vs. Ganeti, Gojeb vs. Ganeti, and Shoreri vs. Gojeb sites had the least similarity index of 11%, 13%, and 14%, respectively. In terms of frog species composition, Utali and Shuneti, which had the highest percentage of Sorensen’s similarity indices (92 percent), were almost identical. All of the frog species found in Shuneti were also encountered in Utali, and they shared six frog species. However, one species was found in Utali that was not noticed in the Shuneti site. In general, the results showed that Sorensen’s similarity indices of frog species between all sites were low, falling below 50% in more than half of the paired sites (Table S5).
3.6. Seasonal Variation in Frog Species
During the rainy and dry seasons, there was a significant difference in Simpson 1-D diversity (t = 2.1738, df = 4636.7, p-value = 0.02) and Shannon H diversity (t = −2.17, df = 4791.2, p-value = 0.03) of frog species in the study sites (Table 5). The Hutcheson t-test used to compare Shannon diversity between rainy and dry seasons revealed a significant difference (Hutcheson t-statistic = 2.17, df = 4794, p-value = 0.023). During the rainy season, 25 frog species were observed, while 26 species were recorded during the dry season. When compared to the dry season, the rainy season had the highest number of frog abundance (Figure 9). However, the difference is not statistically significant (p < 0.05). Frogs are more abundant in all three habitats during the rainy season. Wetland had the highest frog abundance in both seasons compared to agricultural land and riverine forest, and there is a significant difference among the habitat types (p < 0.05).
3.7. Effects of Environmental Variables on Frog Species Abundance
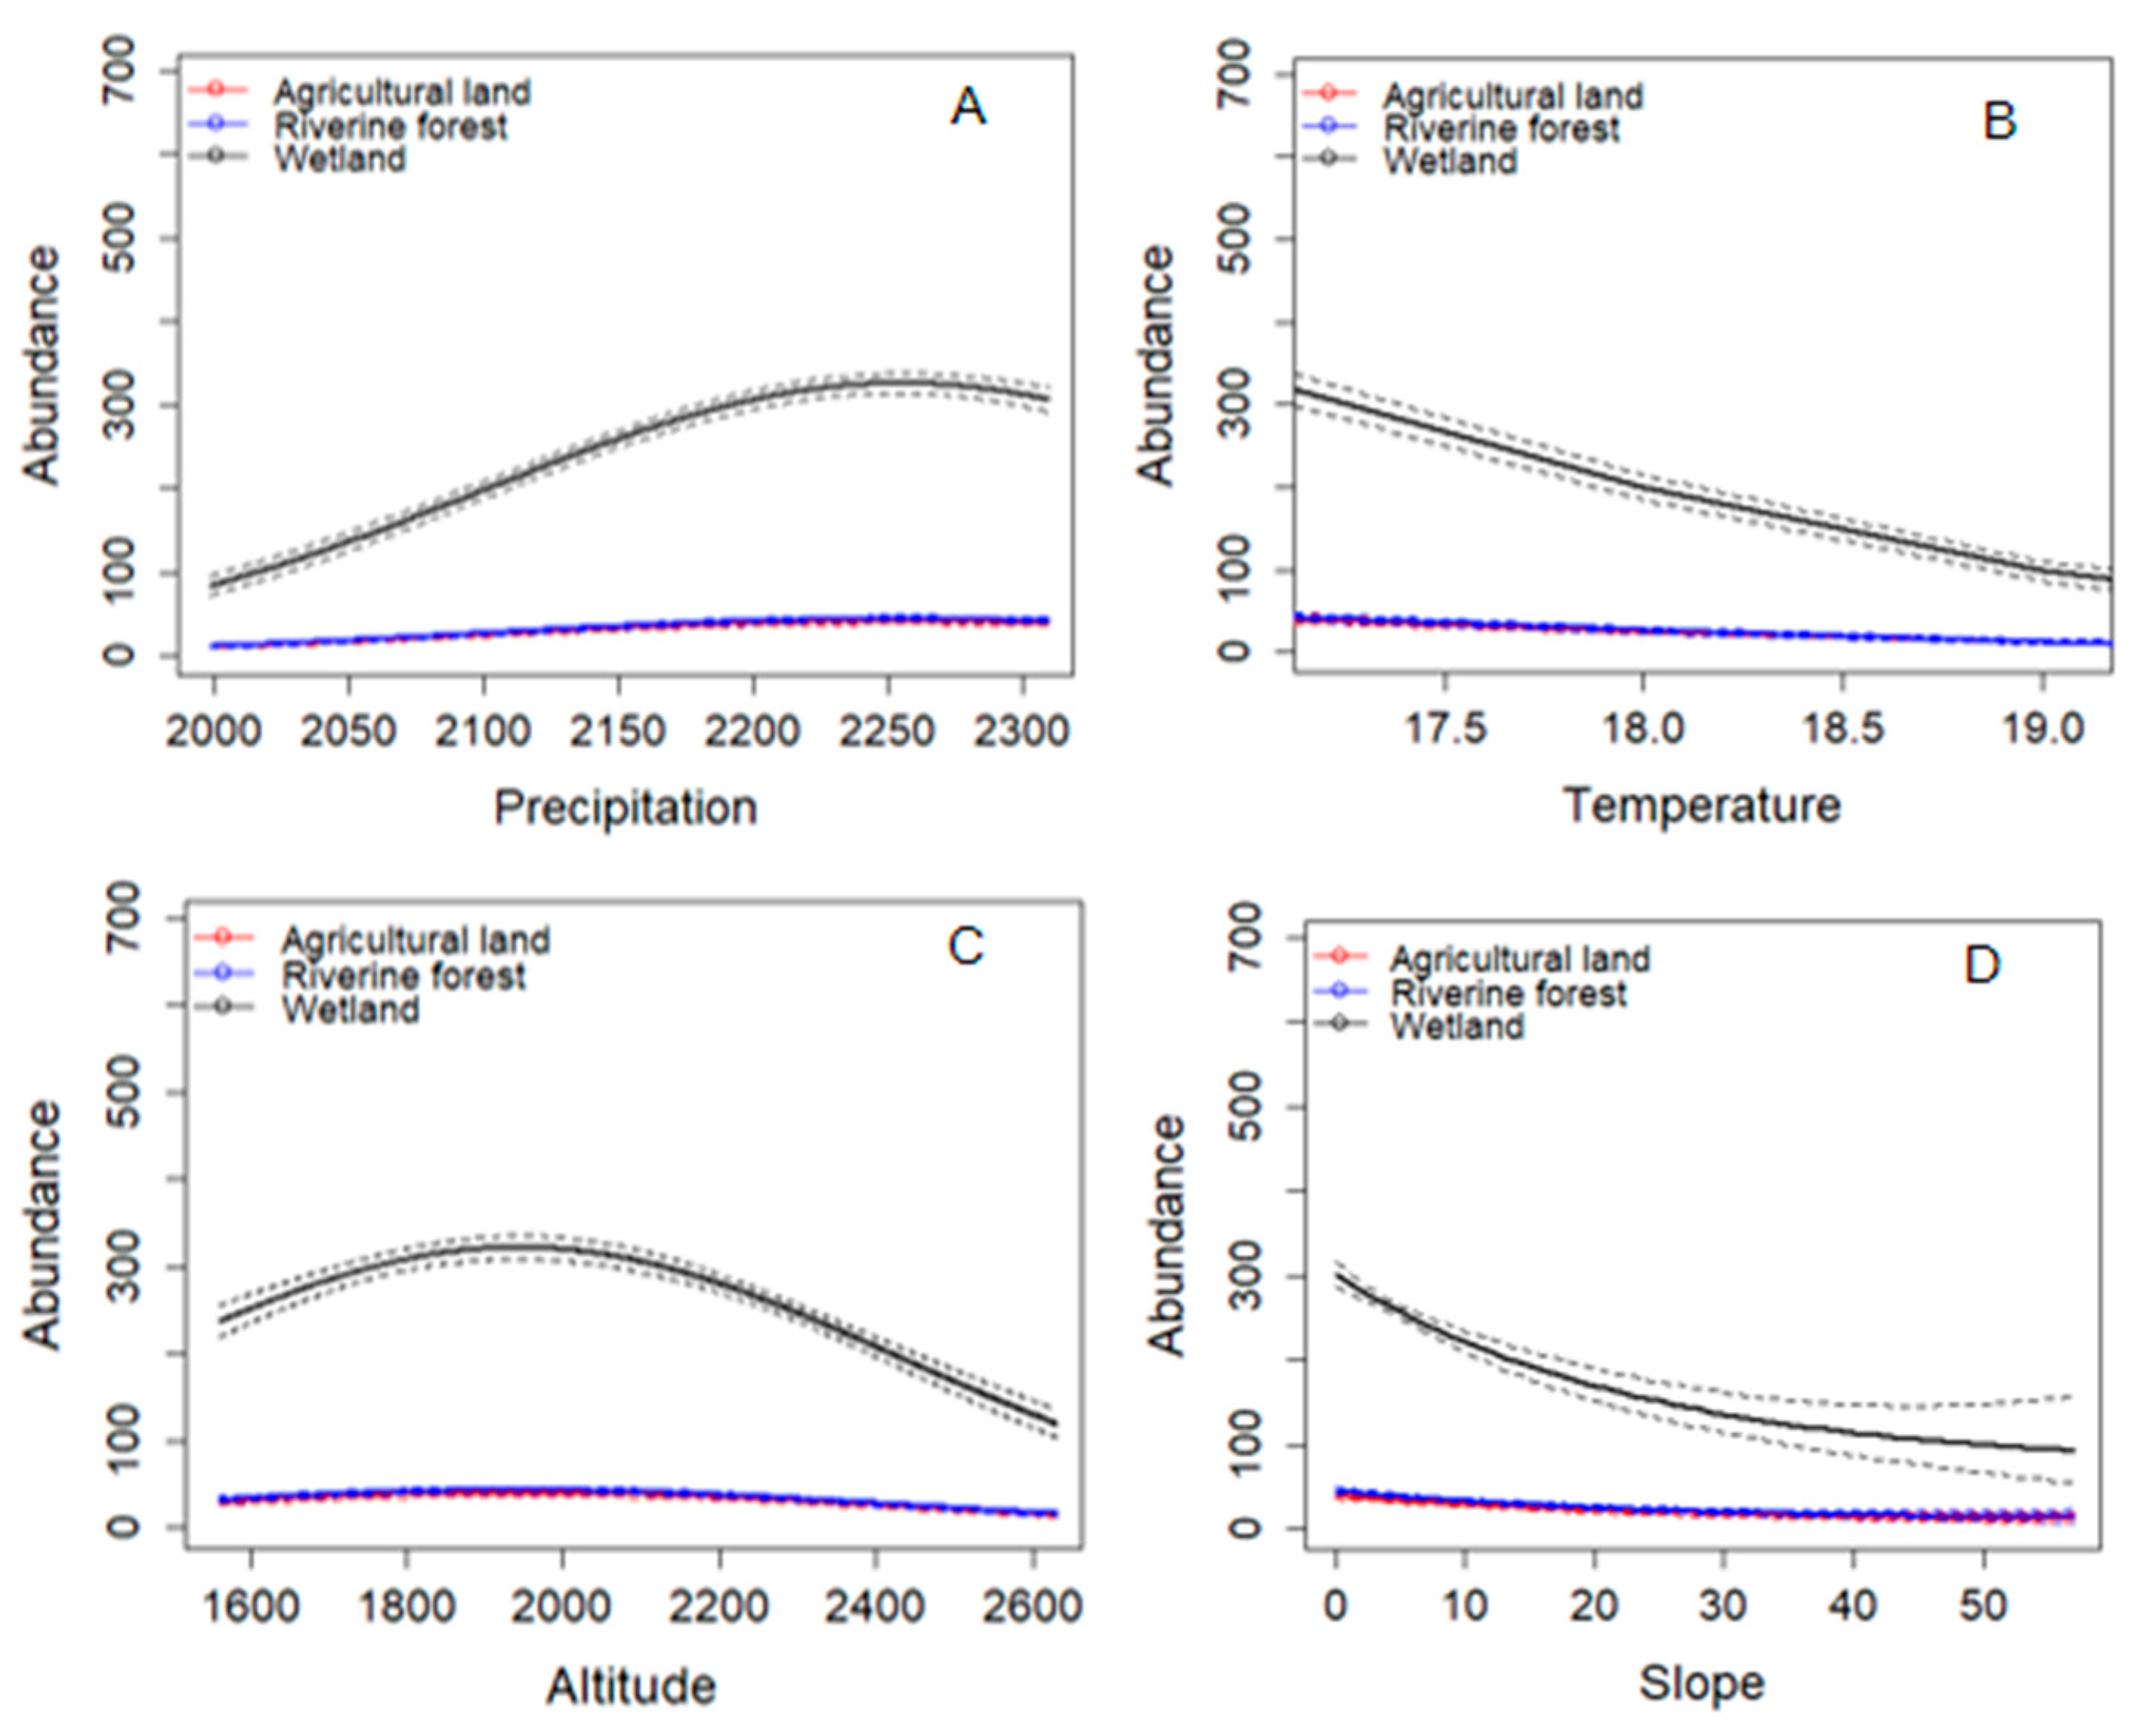
A series of GLMs with Poisson regression were run to see if the abundance and species richness of frog species differed significantly depending on abiotic factors. The Poisson GLM analysis of frog species abundance across three habitat types for 51 transects yielded the best-supported model, which includes explanatory variables such as precipitation, temperature, slope, and altitude (Table 6 and Figure 10).
The model fitted to these data supported the prediction for a positive relationship between precipitation and abundance although it is not a significant association. On the other hand, slope and altitude had a negative nonlinear relationship with the abundance of frog species. There was a significant relationship between abundance and slope, but not between abundance and altitude. The temperature had also a significant negative and linear relationship with anuran abundance (Table 6 and Figure 10). This indicates that abundance decreases with increasing temperature.
4. Discussion
4.1. Anuran Diversity in the Keffa Area
According to our findings, the Keffa area is a biodiverse region in southwestern Ethiopia, with the highest number of amphibian species record and a distinct species composition. Many of the species discovered in the current study had previously been reported to exist in Keffa and surrounding areas [32,34,35,63]. A. nutti, H. marmoratus, H. kivuensis, K. senegalensis, Leptopelis sp. 1, Leptopelis sp. 2, Phrynobatrachus sp. 1 and P. anchietae, on the other hand, were new records for the Keffa area. Amietia nutti, formerly known as Rana angolensis, is found in many parts of Ethiopia, ranging in elevation from 1000 to 3000 m above sea level [29], although genetic analyses revealed that individuals from the south west were distinct from other Ethiopian populations [64]. In the current study, we recorded this species from Sor riverine forest as a new record for the area. We identified endemic frog species including L. ragazzii, P. minutus, and P. inexpectatus using morphological identification keys [34]. However, the DNA sequencing used in the present study revealed that it was not L. ragazzii, and now Leptopelis sp. 2 has been chosen as the interim name. In addition, the BLAST analysis, genetic distance, and ML tree demonstrated that the small Phrynobatrachus from Keffa are clearly distinct from the previously described P. minutus and P. inexpectatus and is provisionally labeled as Phrynobatrachus sp. 1.
According to [65,66], wetlands are home to a wide variety of anuran species. In line with this, the wetland had the highest abundance and species richness of the three habitats where frogs were recorded in the current study (4457 individuals from 19 frog species). This is largely due to wetland ecosystems providing a diverse range of food sources for these organisms, including invertebrates and zooplankton [67]. Species abundance varied according to habitat, with a few common species coexisting with a large number of rare species.
4.2. Differences in Diversity of Anuran Species among Three Habitat Types of the Study Area
The distribution and diversity of tropical frog species are largely influenced by the type and preferences of their habitats [4,68], and many environmental factors associated with habitat structure that are critical for frog diversity [69]. Habitat and environmental heterogeneity have been recognized as among the explanations for variation in species diversity [70,71,72]. Wetland frog diversities (Shannon–Wiener (H) and Simpson (D)) were significantly greater than agricultural land and riverine forest diversity. Similar findings were made in Brazil’s Amazonian savannas and surrounding forests [73], as well as in Trinidad’s Aripo Savannas Scientific Reserve [74]. The higher diversity observed in wetland habitats during our study was most likely due to greater variability in resources for foraging, reproduction, and predator cover, all of which influence frog habitat selection [75]. However, overgrazing, agricultural expansion, water draining, and eucalyptus plantations are ruining this habitat by threatening the survival of these frog species. Due to the high taxonomic turnover in frog species, wetland habitat protection and conservation are critical.
Most of the communities in the study area rely on Enset for food [76,77,78]. In the Keffa area, Enset plantations are not typically homogeneous monocultures, but rather a structurally rich habitat with a distinct understorey and scattered canopy trees. This habitat is used by a variety of frogs, including L. vanuttellii, Leptopelis sp. 2, A. clarkei, and A. enseticola. As a result, agricultural land had a higher frog diversity and evenness index than riverine forest in the current study area. However, the local people are dissatisfied relying on Enset as a food source due to low production caused by diseases and hence forced to convert Enset plantations into field crops, such as teff, wheat and maize. Such shifting highly threaten potential amphibian habitat. In line with this current study, [79] noted that banana vegetation is a significant component of amphibian diversity in Madagascar’s fragmented landscape.
4.3. Accumulation Curve and Species Richness Estimation
Despite the fact that the species cumulative curve has a tendency to stabilize, the possibility of local richness expansion is not ruled out; however, as this study progresses, increased effort would add to the species richness very slowly, as evidenced by richness estimators. This emphasizes the significance of conducting inventories using a variety of sampling methods in order to gain a more complete understanding of anurans [80,81,82], as species richness is closely related to the sampling effort [80].
Accumulation curves are superb for assessing inventory efficiency in the recording of all species at a specific site or habitat. The species accumulation curves for all habitats stabilized, similar to the rarefaction for the total area; however, the agricultural land and riverine forest habitat stabilized in relatively low species richness, indicating that additional sample effort will be required for the two habitat types.
4.4. Similarity of the Frog Assemblages in the Keffa Area
According to [83], if the SCSI value is lower than 0.5; then the paired communities share different species composition; but if the index is greater than 0.5; then the paired communities share similar species composition. Therefore, the species similarity tests (Table 4, Tables S5 and S6) revealed a clear distinction of species composition between all paired habitats and study sites. The dissimilarities of unique species composition could probably be associated to the contrasting ecological settings from different intensities of forest disturbance events at the studied forest areas [84]. The study conducted in Nigeria by [66] found that forest and agricultural land have the highest similarity in species composition. In line with this; in the current study, the result showed that agricultural land and riverine forest habitat had the highest SCSI and JCSI.
4.5. Seasonal Variation in Frog Species
According to [85], the start and duration of frogs’ reproductive seasons are directly influenced by climatic conditions. The majority of frog species in tropical areas with seasonal climates reproduce during the rainy season [66]. Studies in Brazil [86] and Asia [87] have also found seasonal variation in frog communities, though there is still little information on this phenomenon in tropical forests. In tropical forests with clearly defined wet and dry seasons, [88] found that rainfall has a significant impact on the diversity and abundance of frog species. This is also true for the current study in the Keffa area in terms of the diversity and abundance of frog species. Frog species diversity and abundance in the Keffa area increased during the high rainy season, which can be contributed to a higher rate of adult movement around breeding sites [85]. Abiotic factors that influence recruitment may be in charge of seasonal fluctuations in frog abundance, yet predictions need to be verified with more research on Keffa frogs. However, there is no significant difference between seasons in species richness. High rainfall rates and the absence of a distinct dry season were observed in the study area. This fact might be partially explained by lack of significant seasonal variation in the frog species richness in the Keffa area.
4.6. Effects of Environmental Variables on Frog Species Abundance
Although frogs are affected by both biotic and abiotic factors, this study focused solely on abiotic factors such as precipitation, temperature, altitude, and slope. These variables can have an impact on the species richness, abundance, and assemblages of amphibians across a landscape. These impacts can be positive or negative, and their effects have been thoroughly investigated [89]. As a result, species react differently to different levels of factors [90,91,92]. For example, altitudinal gradient and weather play a role in this because as altitude increases, species assemblages are negatively affected due to changes in temperature and habitat, resulting in fewer species being able to successfully establish populations outside their altitudinal range [93].
According to a recent meta-analysis using different taxonomic groups and geographic areas, the species richness and abundance pattern that occurs across the cliffs most frequently may be a hump-shaped pattern [94]. In line with this, our observation of a hump-shaped pattern for abundance along the altitudinal gradient is reliable with a number of empirical studies [95].
5. Conclusions
The current study is the first to provide data with the aid of DNA sequencing about the composition, richness, abundances and habitat associations of the frog community for the Keffa area, as well as the first to address this topic for the vast area of southwestern Ethiopia. This study is also the first to provide information on seasonal fluctuation of frog community in Ethiopia. The results of this study suggest that a surprisingly high species richness and diversity of frog species across sites and habitats survive in the Keffa area. In order to maintain high amphibian species richness, a varied range of habitats must be investigated and protected. The species require a variety of habitat types, including grassy wetlands, Enset vegetation, and riverine forest. Our results imply that all habitat types can be equally crucial for maintaining populations of different frog species. This suggests that these habitat types, as well as perhaps others, should be considered when developing management zones. The current study provides useful and pertinent information to direct conservation and management efforts and it is our aim that this study will encourage conservationists to look into the biological patterns of amphibian communities across geographic regions. To conserve the amphibian fauna in Keffa, we recommend conservation interventions of riverine forests and wetlands and improving horticultural crops such as Enset plantations that play an important role both in ensuring food security to the community and providing suitable habitat for endemic frog species of the country.
Supplementary Materials
The following supporting information can be downloaded at: https://www.mdpi.com/article/10.3390/d15020300/s1, Figure S1: The three habitat types of the study area; Table S1: Sample collection information of 17 study sites and 51 transects; Table S2: Uncorrected p-distances between the Phrynobatrchus species found in Ethiopia based on the 16S gene sequences; Table S3: Uncorrected p-distances between the Leptopelis species of Ethiopia based on the COI gene sequences; Table S4: The IUCN status of anuran species recorded in Keffa area; Table S5: Sorenson similarity index between sites; Table S6: Jaccard similarity between sites.
Author Contributions
Conceptualization, A.K., B.A.B. and A.B.S.; methodology, A.K., S.G. and S.B.; formal analysis, A.K. and S.G.; investigation, A.K.; resources, S.B.; data curation, A.K.; writing—original draft preparation, A.K.; writing—review and editing, B.A.B., A.B.S., S.G. and S.B.; supervision, A.B.S. All authors have read and agreed to the published version of the manuscript.
Funding
This work was supported by the Ethiopian Biodiversity Institute, New York University AbuDhabi, and the Addis Ababa University Doctoral Research Fund (Grant number 6417).
Institutional Review Board Statement
The research proposal was examined and approved for implementation by the Ethiopian Biodiversity Institute review committee. Additionally, we have worked based on the letter EBI (ref. number 182/1100/2014 on the date 18 October 18, 2014, EC) gave us keeping the international research ethics and animal care.
Informed Consent Statement
Not applicable.
Data Availability Statement
The data presented in this study are available on supplementary materials. The sequenced DNA used in this study are deposited in NCBI geneBank.
Acknowledgments
We are grateful to Ethiopian Biodiversity Institute for sponsoring this study. We are appreciative to NYUAD (New York University, Abu Dhabi) for providing the funding and space for us to conduct our molecular study there. I extend to my gratitude to Addis Ababa University for funding to my field trip. Last but not least, I want to express my gratitude to the Keffa zone’s Environment, Forest and Climate Change officials for letting me work there.
Conflicts of Interest
The authors declare no conflict of interest.
References
- AmphibiaWeb. University of California: Berkeley, CA, USA, 2022. Available online: https://amphibiaweb.org (accessed on 21 December 2022).
- Ceríaco, L.M.P.; Blackburn, D.C.; Marques, M.P.; Calado, F.M. Catalogue of the amphibian and reptile type specimens of the Museu de História Natural da Universidade do Porto in Portugal, with some comments on problematic taxa. Alytes 2014, 31, 13–36. [Google Scholar]
- Hocking, D.J.; Babbitt, K.J. Amphibian contributions to ecosystem services. Herpetol. Conserv. Biol. 2014, 9, 1–17. [Google Scholar]
- Jongsma Gregory, F.M.; Hedley, R.W.; Durães, R.; Karubian, J. Amphibian Diversity and Species Composition in Relation to Habitat Type and Alteration in the Mache-Chindul Reserve, Northwest Ecuador. Herpetologica 2014, 70, 34–46. [Google Scholar] [CrossRef]
- Archer, E.; Dziba, L.; Mulongoy, K.; Maoela, M.A.; Walters, M.; Biggs, R.; Cormier-Salem, M.-C.; DeClerck, F.; Diaw, M.C.; Dunham, A.E.; et al. Summary for Policymakers of the Regional Assessment Report on Biodiversity and Ecosystem Services for Africa of the Intergovernmental Science-Policy Platform on Biodiversity and Ecosystem Services; Intergovernmental Science-Policy Platform on Biodiversity and Ecosystem Services: Bonn, Germany, 2018. [Google Scholar]
- Thompson, M.E.; Donnelly, M.A. Effects of secondary forest succession on amphibians and reptiles: A review and meta-analysis. Copeia 2018, 106, 10–19. [Google Scholar] [CrossRef] [Green Version]
- Zimkus, B.M.; Hassapakis, C.L.; Houck, M.L. Integrating current methods for the preservation of amphibian genetic resources and living tissues to achieve best practices for species conservation. Amphib. Reptile Conserv. 2018, 12, e165. [Google Scholar]
- Beebee, T.J.C.; Griffiths, R.A. The amphibian decline crisis: A watershed for conservation biology? Biol. Conserv. 2005, 125, 271–285. [Google Scholar] [CrossRef]
- Hirschfeld, M.; Blackburn, D.C.; Doherty-Bone, T.M.; Gonwouo, L.N.; Rödel, M.O. Dramatic decline of montane frog species in a Central African biodiversity hotspot. PLoS ONE 2016, 11, e0155129. [Google Scholar] [CrossRef] [Green Version]
- Ceballos, G.; Ehrlich, P.R.; Barnosky, A.D.; Garcia, A.; Pringle, R.M.; Palmer, T.M. Accelerated modern human-induced species losses: Entering the sixth mass extinction. Sci. Adv. 2015, 1, el400253. [Google Scholar] [CrossRef] [Green Version]
- Daszak; Cunningham, A.A.; Hyatt, A.D. Infectious disease and amphibian population declines. Divers. Distrib. 2003, 9, 141–150. [Google Scholar] [CrossRef] [Green Version]
- Stuart, S.N.; Chanson, J.S.; Cox, N.A.; Young, B.E.; Rodrigues, A.S.; Fischman, D.L.; Waller, R.W. Status and trends of amphibian declines and extinctions worldwide. Science 2004, 306, 1783–1786. [Google Scholar] [CrossRef] [Green Version]
- Wake, D.B.; Vredenburg, V.T. Are we in the midst of the sixth mass extinction? A review from the world of amphibians. Proc. Natl. Acad. Sci. USA 2008, 105, 11466–11473. [Google Scholar] [CrossRef] [Green Version]
- Cheng, T.L.; Rovito, S.M.; Wake, D.B.; Vredenburg, V.T. Coincident mass extirpation of neotropical amphibians with the emergence of the infection fungal pathogen Batrachochytrium dendrobatidis. Proc. Natl. Acad. Sci. USA 2011, 108, 9502–9507. [Google Scholar] [CrossRef] [Green Version]
- Dukes, J.S.; Mooney, H.A. Disruption of ecosystem processes in western North America by invasive species. Rev. Chil. Hist. Nat. 2004, 77, 411–437. [Google Scholar] [CrossRef]
- Runting, R.K.; Bryan, B.A.; Dee, L.E.; Maseyk, F.J.F.; Mandle, L.; Hamel, P.; Wilson, K.A.; Yetka, K.; Possingham, H.P.; Rhodes, J.R. Incorporating climate change into ecosystem service assessments and decisions: A review. Glob. Chang. Biol. 2017, 23, 28–41. [Google Scholar] [CrossRef] [Green Version]
- Ficetola, G.F.; Rondinini, C.; Bonardi, A.; Baisero, D.; Padoa-Schioppa, E. Habitat availability for amphibians and extinction threat: A global analysis. Divers. Distrib. 2014, 21, 302–311. [Google Scholar] [CrossRef]
- Hof, C.; Araujo, M.B.; Jetz, W.; Rahbek, C. Additive threats from pathogens, climate and land-use change for global amphibian diversity. Nature 2011, 480, 516–519. [Google Scholar] [CrossRef]
- Asefa, M.; Cao, M.; He, Y.; Mekonnen, E.; Song, X.; Yang, J. Ethiopian vegetation types, climate and topography. Plant Divers. 2020, 42, 302–311. [Google Scholar] [CrossRef]
- Estrada, A.; Garber, P.A.; Chaudhary, A. Current and future trends in socio-economic, demographic and governance factors affecting global primate conservation. PeerJ 2020, 8, e9816. [Google Scholar] [CrossRef]
- EBI. Ethiopia’s Fifth National Report to the Convention on Biological Diversity; Ethiopian Biodiversity Institute: Addis Ababa, Ethiopia, 2014. [Google Scholar]
- WCMC. Biodiversity Data Sourcebook; World Conservation Monitoring Centre, World Conservation Press: Cambridge, UK, 1994. [Google Scholar]
- Freilich, X.; Anadón, J.D.; Bukala, J.; Calderon, O.; Chakraborty, R.; Boissinot, S. Comparative Phylogeography of Ethiopian anurans: Impact of the Great Rift Valley and Pleistocene climate change. BMC Evol. Biol. 2016, 16, 206. [Google Scholar] [CrossRef] [Green Version]
- Olson, D.M.; Dinerstein, E. The Global 200: Priority Ecoregions for Global Conservation. Ann. Mo. Bot. Gard. 2002, 89, 199–224. [Google Scholar] [CrossRef]
- Reyes-Velasco, J.; Manthey, J.D.; Bourgeois, Y.; Freilich, X.; Boissinot, S. Revisiting the phylogeography, demography and taxonomy of the frog genus Ptychadena in the Ethiopian highlands with the use of genome-wide SNP data. PLoS ONE 2018, 13, e0190440. [Google Scholar] [CrossRef] [PubMed] [Green Version]
- Kostin, D.S.; Kasso, M.; Komarova, V.A.; Martynov, A.A.; Gromov, A.R.; Alexandrov, D.Y.; Bekele, A.; Zewdie, C.; Bryja, J.; Lavrenchenko, L.A. Taxonomic and genetic diversity of rodents from the Arsi Mountains (Ethiopia). Mammalia 2018, 83, 237–247. [Google Scholar] [CrossRef]
- Smith, M.L.; Noonan, B.P.; Colston, T.J. The role of climatic and geological events in generating diversity in Ethiopian grass frogs (genus ptychadena). R. Soc. Open Sci. 2017, 4, 17–19. [Google Scholar] [CrossRef] [PubMed] [Green Version]
- Goutte, S.; Reyes-Velasco, J.; Kassie, A.; Boissinot, S. Genetic and morphometric analyses of historical type specimens clarify the taxonomy of the Ethiopian Leptopelis gramineus species complex (Anura, Arthroleptidae). ZooKeys 2022, 1128, 63–97. [Google Scholar] [CrossRef]
- Largen, M.J. Catalogue of the amphibians of Ethiopia, including a key for their identification. Trop. Zool. 2001, 14, 307–402. [Google Scholar] [CrossRef]
- Freilich, X.; Tollis, M.; Boissinot, S. Hiding in the highlands: Evolution of a frog species complex of the genus Ptychadena in the Ethiopian highlands. Mol. Phylogenetics Evol. 2014, 71, 157–169. [Google Scholar] [CrossRef]
- Goutte, S.; Reyes-Velasco, J.; Boissinot, S. A new species of puddle frog from an unexplored mountain in southwestern Ethiopia (Anura, Phrynobatrachidae, Phrynobatrachus). ZooKeys 2019, 824, 53–70. [Google Scholar] [CrossRef]
- Goutte, S.; Reyes-Velasco, J.; Freilich, X.; Kassie, A.; Boissinot, S. Taxonomic revision of grass frogs (Ptychadenidae, ptychadena) endemic to the Ethiopian highlands. ZooKeys 2021, 1016, 77–141. [Google Scholar] [CrossRef]
- Gower, D.J.; Doherty-Bone, T.M.; Kassahun, R.; Mengistu, A.; Menegon, M.; de Sá, R.; Saber, S.; Cunningham, A.A.; Loader, S.P. High prevalence of the amphibian chytrid fungus (Batrachochytrium dendrobatidis) across multiple taxa and localities in the highlands of Ethiopia. Herpetol. J. 2012, 22, 225–233. [Google Scholar]
- Teme, A.K.; Simegn, A.B.; Bogale, B.A. Species Composition and Distribution of Endemic Frog Species of Keffa, Southwest Ethiopia. Glob. Ecol. Conserv. 2022, 38, e02211. [Google Scholar] [CrossRef]
- Mengistu, A.A. Amphibian Diversity, Distribution and Conservation in the Ethiopian Highlands: Morphological, Molecular and Biogeographic Investigation on Leptopelis and Ptychadena (Anura). Ph.D. Thesis, Universität Basel, Basel, Switzerland, 2012. Available online: https://core.ac.uk/reader/18256268 (accessed on 21 December 2022).
- Reyes-Velasco, J.; Manthey, J.D.; Freilich, X.; Boissinot, S. Diversification of African tree frogs (genus Leptopelis) in the highlands of Ethiopia. Mol. Ecol. 2018, 27, 2256–2270. [Google Scholar] [CrossRef]
- Tiutenko, A.; Zinenko, O. A new species of leptopelis (Anura, arthroleptidae) from the south-eastern slope of the Ethiopian highlands, with notes on the leptopelis gramineus species complex and the revalidation of a previously synonymised species. ZooKeys 2021, 1023, 119–150. [Google Scholar] [CrossRef]
- Rödel, M.O.; Ernst, R. Measuring and monitoring amphibian diversity in tropical forests. I. An evaluation of methods with recommendations for standardization. Ecotropica 2004, 10, 1–14. [Google Scholar]
- Veith, M.; Lötters, S.; Andreone, F.; Rödel, M. Measuring and monitoring amphibian diversity in tropical forests. II. Estimating species richness from standardized transect censing. Ecotropica 2004, 10, 85–99. [Google Scholar]
- Heyer, W.R.; Donnelly, M.A.; McDiarmid, R.W.; Hayek, L.C.; Foster, M.S. Measuring and Monitoring Biological Diversity: Standard Methods for Amphibians; Smithsonian Institution Press: Washington, DC, USA, 1994; p. 364. [Google Scholar]
- Channing, A.; Rödel, M.O.; Channing, J. Tadpoles of Africa—The Biology and Identification of All Known Tadpoles in Sub-Saharan Africa; Edition Chimaira: Frankfurt am Main, Germany, 2012; p. 402. [Google Scholar]
- Channing, A.; Rödel, M.O. Field Guide to the Frogs and Other Amphibians of Africa; Struik Nature: Cape Town, South Africa, 2019; p. 407. [Google Scholar]
- Largen, M.; Spawls, S. The Amphibians and Reptiles of Ethiopia and Eritrea; Chimaira Publications: Frankfurt am Main, Germany, 2010; p. 693. [Google Scholar]
- Tiutenko, A.; Zinenko, O. Additional diagnosis, observations of breeding biology and tadpole of a little known dwarf puddle frog, Phrynobatrachus inexpectatus Largen, 2001 (Anura: Phrynobatrachidae). Salamandra 2020, 56, 135–147. [Google Scholar]
- Stackhouse, P. NASA POWER | Data Access Viewer. Available online: https://power.larc.nasa.gov/data-access-viewer/ (accessed on 30 December 2021).
- Magurran, A.E. Ecological Diversity and its Measurement; Cambridge University Press: Cambridge, UK, 1988; p. 256. [Google Scholar]
- Shannon, C.L.; Weiner, W. The Mathematical Theory of Communication; Illinois Books: Urbana, IL, USA, 1949. [Google Scholar]
- Hammer, Ø.; Harper, D.A.T.; Paul, D.R. Past: Paleontological statistics software package for education and data analysis. Palaeontol. Electron. 2001, 4, 9. Available online: http://palaeo-electronica.org/2001_1/past/issue1_01.htm (accessed on 20 June 2022).
- Hutcheson, K. A test for comparing diversities based on the shannon formula. J. Theor. Biol. 1970, 29, 151–154. [Google Scholar] [CrossRef]
- Sørensen, T.A. A method of establishing groups of equal amplitude in plant sociology based on similarity of species content, and its application to analyses of the vegetation on Danish commons. K. Dan. Vidensk. Selsk. Biol. Skr. 1948, 5, 1–34. [Google Scholar]
- Jaccard, P. The distribution of the flora in the alpine zone. New Phytol. 1912, 11, 37–50. [Google Scholar] [CrossRef]
- Oksanen, J.; Blanchet, F.G.; Friendly, M.; Kindt, R.; Legendre, P.; McGlinn, D.; Minchin, P.R.; O’hara, R.B.; Simpson, G.L.; Solymos, P.; et al. Vegan: Community Ecology Package; Version 2.5-6; The Comprehensive R Archive Network; R Core Team: Vienna, Austria, 2019. [Google Scholar]
- Chao, A.; Gotelli, N.J.; Hsieh, T.C.; Sander, E.L.; Ma, K.H.; Colwell, R.K.; Ellison, A.M. Rarefaction and extrapolation with Hill numbers: A framework for sampling and estimation in species diversity studies. Ecol. Monogr. 2014, 84, 45–67. [Google Scholar] [CrossRef] [Green Version]
- Chao, A.; Ma, K.H.; Hsieh, T.C. iNEXT Online: Software for Interpolation and Extrapolation of Species Diversity. 2016. Program and User’s Guide. Available online: http://chao.stat.nthu.edu.tw/wordpress/software_download/inextonline/ (accessed on 25 June 2022).
- Hsieh, T.C.; Ma, K.H.; Chao, A. iNEXT: An R package for rarefaction and extrapolation of species diversity (Hill numbers). Methods Ecol. Evol. 2016, 7, 1451–1456. [Google Scholar] [CrossRef]
- McCullagh, P.; Nelder, J.A. Generalized Linear Models, 2nd edition; Chapman & Hall: London, UK, 1989. [Google Scholar]
- Pinheiro, J.; Bates, D.; Debroy, S.; Sarkar, D. R Core Team. Nlme: Linear and Nonlinear Mixed Effects Models. R Package Version 2012, 3.1-109. Available online: http://cran.r-project.org/package=nlme (accessed on 20 July 2022).
- R Core Team. R: A Language and Environment for Statistical Computing; R Foundation for Statistical Computing: Vienna, Austria, 2022; Available online: https://www.R-project.org/ (accessed on 14 October 2022).
- Tamura, K.; Stecher, G.; Kumar, S. MEGA11: Molecular Evolutionary Genetics Analysis version 11. Mol. Biol. Evol. 2021, 38, 3022–3027. [Google Scholar] [CrossRef] [PubMed]
- Tamura, K.; Nei, M. Estimation of the number of nucleotide substitutions in the control region of mitochondrial DNA in humans and chimpanzees. Mol. Biol. Evol. 1993, 10, 512–526. [Google Scholar] [PubMed] [Green Version]
- Felsenstein, J. Confidence limits on phylogenies: An approach using the bootstrap. Evolution 1985, 39, 783–791. [Google Scholar] [CrossRef] [PubMed]
- Nei, M.; Kumar, S. Molecular Evolution and Phylogenetics; Oxford University Press: New York, NY, USA, 2000. [Google Scholar]
- NABU. NABU’s Follow-Up Biodiversity Assessment at the Kafa Biosphere Reserve, Ethiopia; The Nature and Biodiversity Conservation Union: Berlin, Germany, 2020. [Google Scholar]
- Manthey, J.D.; Reyes-Velasco, J.; Freilich, X.; Boissinot, S. Diversification in a biodiversity hotspot: Genomic variation in the river frog Amietia nutti across the Ethiopian Highlands. Biol. J. Linn. Soc. 2017, 122, 801–813. [Google Scholar] [CrossRef]
- Drayer, A.N.; Richter, S.C. Physical Wetland Characteristics Influence Amphibian Community Compostion Differently in Constructed Wetlands and Natural Wetlands. Ecol. Eng. 2016, 93, 166–174. [Google Scholar] [CrossRef]
- Nneji, L.M.; Adeola, A.C.; Okeyoyin, A.; Oladipo, O.C.; Saidu, Y.; Samuel, D.; Usongo, J.Y.; Adedeji, B.; Omotoso, O.; Adeyi, A.O.; et al. Diversity and Distribution of Amphibians and Reptiles in Gashaka Gumti National Park, Nigeria. Herpetol. Notes 2019, 12, 543–559. [Google Scholar]
- Muro-Torres, V.M.; Amezcua, F.; Soto-Jiménez, M.; Balart, E.F.; Serviere-Zaragoza, E.; Green, L.; Rajnohova, J. Primary sources and food web structure of a tropical wetland with high density of mangrove forest. Water 2020, 12, 3105. [Google Scholar] [CrossRef]
- Onadeko, A.B. Distribution, diversity and abundance of anuran species in three different vegetation habitats in south-western Nigeria. Eth. J. Environ. Stud. Manag. 2016, 9, 22–34. [Google Scholar]
- Pearman, P.B. Correlates of Amphibian Diversity in an Altered Landscape of Amazonian Ecuador. Conserv. Biol. 1997, 11, 1211–1225. [Google Scholar] [CrossRef]
- Gouveia, S.F.; Faria, R.G. Effects of Habitat Size and Heterogeneity on Anuran Breeding Assemblages in the Brazilian Dry Forest. J. Herpetol. 2015, 49, 442–446. [Google Scholar] [CrossRef]
- Silva, R.A.; Martins, I.A.; Rossa-Feres, D.d.C. Environmental Heterogeneity: Anuran Diversity in Homogeneous Environments. Zoologia 2011, 28, 610–618. [Google Scholar] [CrossRef] [Green Version]
- Tomé, R. Effects of Habitat Quality on the Abundance, Behaviour and Breeding Performance of Owls: Barn and Little Owls in Agro-Pastoral Landscapes of Southern Europe; University of Turku: Turku, Finland, 2011. [Google Scholar] [CrossRef]
- Neckel-Oliveira, S.; Magnusson, W.E.; Lima, A.P.; Albernaz, A.L.K. Diversity and Distribution of Frogs in an Amazonian Savanna in Brazil. Amphib. Reptil. 2000, 21, 317–326. [Google Scholar] [CrossRef]
- Auguste, R.J.; Hailey, A. Diversity and Species Composition of Amphibians of the Aripo Savannas Scientific Reserve, Trinidad, West Indies. J. Herpetol. 2018, 52, 86–93. [Google Scholar] [CrossRef]
- Dodd, C.K., Jr. Amphibian Ecology and Conservation; Oxford University Press Inc.: New York, NY, USA, 2010; p. 556. [Google Scholar] [CrossRef] [Green Version]
- Borrell, J.S.; Biswas, M.K.; Goodwin, M.; Blomme, G.; Schwarzacher, T.; Heslop-Harrison, J.S.; Wendawek, A.M.; Berhanu, A.; Kallow, S.; Janssens, S.; et al. Enset in Ethiopia: A poorly characterized but resilient starch staple. Ann. Bot. 2019, 123, 747–766. [Google Scholar] [CrossRef] [Green Version]
- Kidane, S.A.; Meressa, B.H.; Haukeland, S.; Hvoslef-Eide, A.K.; Coyne, D.L. The Ethiopian staple food crop enset (Ensete ventricosum) was assessed for the first time for resistance against the root-lesion nematode Pratylenchus goodeyi. Nematology 2021, 23, 771–779. [Google Scholar] [CrossRef]
- Tobiaw, D.C.; Bekele, E. Analysis of genetic diversity among cultivated enset (Ensete ventricosum) populations from Essera and Kefficho, southwestern part of Ethiopia using inter simple sequence repeats (ISSRs) marker. Afr. J. Biotechnol. 2011, 10, 15697–15709. [Google Scholar] [CrossRef]
- Ndriantsoa, S.H.; Riemann, J.C.; Raminosoa, N.; Rödel, M.O.; Glos, J.S. Amphibian Diversity in the Matrix of a Fragmented Landscape around Ranomafana in Madagascar Depends on Matrix Quality. Trop. Conserv. Sci. 2017, 10, 1940082916686065. [Google Scholar] [CrossRef] [Green Version]
- Costa-Campos, C.E.; Freire, E.M.X. Richness and composition of anuran assemblages from an Amazonian savanna. ZooKeys 2019, 843, 149–169. [Google Scholar] [CrossRef] [Green Version]
- Maritz, B.; Gavin, M.; Mackay, D.; Alexander, G. The effect of funnel trap type and size of pitfall trap on trap success: Implications for ecological field studies. Amphib. Reptil. 2007, 28, 321–328. [Google Scholar] [CrossRef]
- Ribeiro, M.A., Jr.; Gardner, T.A.; Ávila-Pires, T.C.S. Evaluating the effectiveness of herpetofaunal sampling techniques across a gradient of habitat change in a tropical forest landscape. J. Herpetol. 2008, 42, 733–749. [Google Scholar] [CrossRef]
- Akoto, S.D.; Asare, A.; Gyabaa, G. Natural regeneration diversity and composition of native tree species under monoculture, mixed culture plantation and natural forest. Int. Res. J. Nat. Sci. 2015, 3, 24–38. [Google Scholar]
- Hammond, M.E.; Pokornỳ, R. Diversity of Tree Species in Gap Regeneration under Tropical Moist Semi-Deciduous Forest: An Example from Bia Tano Forest Reserve. Diversity 2020, 12, 301. [Google Scholar] [CrossRef]
- Giaretta, A.A.; Menin, M. Reproduction, phenology and mortality sources of a species of Physalaemus (Anura: Leptodactylidae). J. Nat. Hist. 2004, 38, 1711–1722. [Google Scholar] [CrossRef]
- Giaretta, A.A.; Facure, K.G.; Sawaya, R.J.; Meyer, J.D.M.; Chemin, N. Diversity and abundance of litter frogs in a montane forest of southeastern Brazil: Seasonal and altitudinal changes. Biotropica 1999, 31, 669–674. [Google Scholar] [CrossRef]
- Watanabe, S.; Nakanishi, N.; Izawa, M. Seasonal Abundance in the Floor-Dwelling Frog Fauna on Iriomote Island of the Ryukyu Archipelago, Japan. J. Trop. Ecol. 2005, 21, 85–91. [Google Scholar] [CrossRef]
- Vonesh, J.R. Patterns of richness and abundance in a tropical African leaf-litter herpetofauna. Biotropica 2001, 33, 502–510. [Google Scholar] [CrossRef]
- Blaustein, A.; Walls, S.; Bancroft, B.; Lawler, J.; Searle, C.; Gervasi, S. Direct and indirect effects of climate change on Amphibian populations. Diversity 2010, 2, 281–313. [Google Scholar] [CrossRef]
- Cortés-Gómez, A.M.; Castro-Herrera, F.; Urbina-Cardona, J.N. Small changes in vegetation structure create great changes in amphibian ensembles in the Colombian Pacific rainforest. Trop. Conserv. Sci. 2013, 6, 749–769. [Google Scholar] [CrossRef] [Green Version]
- Sirami, C.; Nespoulous, A.; Cheylan, J.P.; Marty, P.; Hvenegaard, G.T.; Geniez, P.; Schatz, B.; Martin, J.L. Long-term anthropogenic and ecological dynamics of a Mediterranean landscape: Impacts on multiple taxa. Landsc. Urban Plan. 2010, 96, 214–223. [Google Scholar] [CrossRef]
- Wanger, T.C.; Saro, A.; Iskandar, D.T.; Brook, B.W.; Sodhi, N.S.; Clough, Y.; Tscharntke, T. Conservation value of cacao agroforestry for amphibians and reptiles in South-East Asia: Combining correlative models with follow-up field experiments. J. Appl. Ecol. 2009, 46, 823–832. [Google Scholar] [CrossRef]
- Navas, C.A. Herpetological diversity along Andean elevational gradients: Links with physiological ecology and evolutionary physiology. Comp. Biochem. Physiol. Part A Mol. Integr. Physiol. 2002, 133, 469–485. [Google Scholar] [CrossRef]
- Matavelli, R.; Oliveira, J.M.; Soininen, J.; Ribeiro, M.C.; Bertoluci, J. Altitude and Temperature Drive Anuran Community Assembly in a Neotropical Mountain Region. Biotropica 2022, 54, 607–618. [Google Scholar] [CrossRef]
- Sanders, N.J.; Rahbek, C. The patterns and causes of elevational gradients. Ecography 2012, 35, 1–3. [Google Scholar] [CrossRef]
Figure 1.
Map of the study area.

Figure 2.
Sketch of drift fence and pitfall trap layout.

Figure 3.
The evolutionary history was inferred by using the Maximum Likelihood method and the Tamura–Nei model [60]. The percentage of trees in which the associated taxa clustered together is shown next to the branches. Initial tree(s) for the heuristic search were obtained automatically by applying Neighbor-Join and BioNJ algorithms to a matrix of pairwise distances estimated using the Tamura–Nei model, and then selecting the topology with superior log likelihood value. This analysis involved 25 nucleotide sequences. Codon positions included were 1st+2nd+3rd+Noncoding.

Figure 4.
Evolutionary analysis by Maximum Likelihood method. The evolutionary history was inferred by using the Maximum Likelihood method and the Tamura–Nei model [60]. The percentage of trees in which the associated taxa clustered together is shown next to the branches. Initial tree(s) for the heuristic search were obtained automatically by applying Neighbor-Join and BioNJ algorithms to a matrix of pairwise distances estimated using the Tamura–Nei model, and then selecting the topology with superior log likelihood value. This analysis involved 46 nucleotide sequences. The orange color band represents Leptopelis sp. 1 and the blue color represents Leptopelis sp. 2.

Figure 5.
Some of the frog pictures recorded from the Keffa area. (a) Amietia nutti; (b) Afrixalus enseticola; (c) Xenopus clivii; (d) Ptychadena erlangeri; (e) Leptopelis sp. 2; (f) Leptopelis vannutellii; (g) Leptopelis sp. 1; (h) Kassina senegalensis; (i) Hyperolius viridiflavus; (j) Hyperolius microps; (k) Conraua beccarii; (l) Phrynobatrachus natalensis; (m) Afrixalus clarkei; (n) Paracassina obscura; (o) Leptopelis cf. susanae; (p) Ptychadena nilotica; (q) Hyperolius kivuensis.

Figure 6.
The diversity variation of anuran species among habitats in the Keffa area: (A) richness; (B) abundance; (C) Shannon H diversity; and (D) evenness.
Figure 6.
The diversity variation of anuran species among habitats in the Keffa area: (A) richness; (B) abundance; (C) Shannon H diversity; and (D) evenness.

Figure 7.
Species accumulation (rarefaction) curve (solid line) plotted against survey effort (number of transects surveyed) and vertical lines represent 95% confidence intervals.
Figure 7.
Species accumulation (rarefaction) curve (solid line) plotted against survey effort (number of transects surveyed) and vertical lines represent 95% confidence intervals.

Figure 8.
Comparison of the diversity of anuran species in three habitat types in the Keffa area through rarefaction solid lines and extrapolation dotted lines based on the number of individuals of the frog species. Species diversity was estimated using Hill numbers: q = 0 (frog species richness), q = 1 (exponential of Shannon’s entropy index) and q = 2 (inverse of Simpson’s concentration index).

Figure 9.
Seasonal variation of frog abundance among the three habitat types.

Figure 10.
Effects of (A) precipitation, (B) temperature, (C) altitude, and (D) slope on the pattern of anuran abundance across habitat types. The solid lines represent trends, while the dashed lines represent the respective 95% credible intervals calculated using a Poisson GLM.
Figure 10.
Effects of (A) precipitation, (B) temperature, (C) altitude, and (D) slope on the pattern of anuran abundance across habitat types. The solid lines represent trends, while the dashed lines represent the respective 95% credible intervals calculated using a Poisson GLM.


Table 1.
Localities, collection, and GeneBank accession numbers of the taxa sequenced in this study.
Table 1.
Localities, collection, and GeneBank accession numbers of the taxa sequenced in this study.
| Species | Collection no. | Gene Bank Accession No. | Collection Year | Locality | Lat. | Long. |
|---|---|---|---|---|---|---|
| Phrynobatrachus sp. 1 | AB3830 | OQ398465 | 2021 | Boqa, Ethiopia | 7.30 | 36.37 |
| Phrynobatrachus sp. 1 | AB3834 | OQ398466 | 2021 | Boqa, Ethiopia | 7.30 | 36.37 |
| Phrynobatrachus sp. 1 | AB3848 | OQ398467 | 2021 | Bita, Ethiopia | 7.27 | 35.78 |
| Phrynobatrachus sp. 1 | AB3862 | OQ398468 | 2021 | Nata, Ethiopia | 7.58 | 35.75 |
| Phrynobatrachus sp. 1 | AB3891 | OQ398469 | 2021 | Bariacho, Ethiopia | 7.82 | 35.83 |
| Phrynobatrachus sp. 1 | AB3910 | OQ398470 | 2022 | Ganeti, Ethiopia | 7.42 | 35.64 |
| P. natalensis | AB3949 | OQ398471 | 2022 | Bita, Ethiopia | 7.27 | 35.78 |
| Phrynobatrachus sp. 1 | AB3987 | OQ398472 | 2022 | Utali, Ethiopia | 7.83 | 35.82 |
| Phrynobatrachus sp. 1 | AB4024 | OQ398473 | 2022 | Shamali, Ethiopia | 7.13 | 36.19 |
| Phrynobatrachus sp. 2 | AB4047 | OQ398474 | 2022 | Chagni, Ethiopia | 10.92 | 36.57 |
| P. natalensis | AB4054 | OQ398475 | 2022 | Chagni, Ethiopia | 10.92 | 36.57 |
| Phrynobatrachus sp. 1 | AB3830 | OQ398465 | 2021 | Boqa, Ethiopia | 7.30 | 36.37 |
| Leptopelis sp. 1 | AB3845 | OQ413091 | 2020 | Boqa, Ethiopia | 7.30 | 36.37 |
| Leptopelis sp. 1 | AB3908 | OQ407700 | 2021 | Ganeti, Ethiopia | 7.42 | 35.64 |
| Leptopelis sp. 1 | AB3911 | OQ413101 | 2021 | Ganeti, Ethiopia | 7.42 | 35.64 |
| Leptopelis sp. 1 | AB3915 | OQ413102 | 2021 | Ganeti, Ethiopia | 7.42 | 35.64 |
| Leptopelis sp. 1 | AB4060 | OQ413100 | 2022 | Boqa, Ethiopia | 7.30 | 36.37 |
| Leptopelis sp. 2 | AB3916 | OQ413180 | 2021 | Ganeti, Ethiopia | 7.43 | 35.65 |
| Leptopelis sp. 2 | AB3919 | OQ413183 | 2021 | Ganeti, Ethiopia | 7.43 | 35.65 |
| Leptopelis sp. 2 | AB3922 | OQ413184 | 2021 | Ganeti, Ethiopia | 7.43 | 35.65 |
| Leptopelis sp. 2 | AB3927 | OQ413187 | 2021 | Ganeti, Ethiopia | 7.43 | 35.65 |
| Leptopelis sp. 2 | AB3928 | OQ413188 | 2021 | Ganeti, Ethiopia | 7.43 | 35.65 |
| Leptopelis sp. 2 | AB3929 | OQ413189 | 2021 | Ganeti, Ethiopia | 7.43 | 35.65 |
| L. yaldeni | AB4044 | OQ413098 | 2022 | Chagni, Ethiopia | 10.93 | 36.69 |
| L. yaldeni | AB4045 | OQ413099 | 2022 | Chagni, Ethiopia | 10.93 | 36.69 |
| L. vannutellii | AB4031 | OQ413095 | 2022 | Oda, Ethiopia | 7.12 | 36.46 |
| L. vannutellii | AB4032 | OQ413096 | 2022 | Oda, Ethiopia | 7.12 | 36.46 |
| L. vannutellii | AB4039 | OQ413097 | 2022 | Oda, Ethiopia | 7.12 | 36.46 |
| L. vannutellii | AB3914 | OQ413103 | 2021 | Ganeti, Ethiopia | 7.43 | 35.65 |
| L. vannutellii | AB3997 | OQ413093 | 2022 | Sor, Ethiopia | 7.84 | 35.84 |
| L. vannutellii | AB3923 | OQ413185 | 2022 | Ganeti, Ethiopia | 7.43 | 35.65 |
| L. vannutellii | AB3925 | OQ413186 | 2022 | Ganeti, Ethiopia | 7.43 | 35.65 |
| L. vannutellii | AB3918 | OQ413182 | 2022 | Ganeti, Ethiopia | 7.43 | 35.65 |
| L. vannutellii | AB3897 | OQ413092 | 2021 | Utali (Saylem), Ethiopia | 7.83 | 35.82 |
| L. vannutellii | AB4017 | OQ413094 | 2022 | Shamali, Ethiopia | 7.20 | 36.28 |
| L. vannutellii | AB3917 | OQ413181 | 2020 | Ganeti, Ethiopia | 7.43 | 35.65 |
| L. vannutellii | AB3798 | OQ413090 | 2020 | Shuneti, Ethiopia | 7.38 | 35.73 |
| L. vannutellii | AB3797 | OQ413089 | 2020 | Shuneti, Ethiopia | 7.38 | 35.73 |
Table 2.
Abundance of anuran species recorded in three habitat types of Keffa.
| Family | Species | Habitats | Total | Relative Abundance (Rank) | ||
|---|---|---|---|---|---|---|
| WL | AL | RF | ||||
| Hyperoliidae | Afrixalus clarkei Largen, 1974 | 784 | 115 | 25 | 924 | 16.27 (3) |
| Afrixalus enseticola Largen, 1974 | 99 | 148 | 0 | 247 | 4.35 (8) | |
| Hyperolius microps Günther, 1864 | 478 | 0 | 0 | 478 | 8.41 (4) | |
| Hyperolius kivuensis Ahl, 1931 | 260 | 0 | 0 | 260 | 4.58 (7) | |
| Hyperolius viridiflavus (Duméril and Bibron, 1841) | 247 | 0 | 13 | 260 | 4.58 (7) | |
| Kassina senegalensis (Duméril and Bibron, 1841) | 23 | 0 | 0 | 23 | 0.41 (15) | |
| Paracassina obscura (Boulenger, 1895) | 0 | 12 | 0 | 12 | 0.21 (20) | |
| Arthroleptidae | Leptopelis sp. 1 | 22 | 0 | 0 | 22 | 0.39 (16) |
| Leptopelis sp. 2 | 0 | 28 | 0 | 28 | 0.49 (14) | |
| Leptopelis cf. susanae Largen 1977 | 2 | 0 | 0 | 2 | 0.04 (25) | |
| Leptopelis vannutellii (Boulenger, 1898) | 0 | 167 | 289 | 456 | 8.03 (5) | |
| Pyxicephalidae | Amietia nutti (Boulenger, 1896) | 0 | 0 | 46 | 46 | 0.81 (12) |
| Conrauidae | Conraua beccarii (Boulenger, 1911) | 0 | 0 | 7 | 7 | 0.12 (23) |
| Hemisotidae | Hemisus marmoratus (Peters, 1854) | 0 | 0 | 3 | 3 | 0.05 (24) |
| Hemisus microscaphus Laurent, 1972 | 0 | 8 | 41 | 49 | 0.86 (11) | |
| Phrynobatrachidae | Phrynobatrachus sp. 1 | 883 | 0 | 274 | 1157 | 20.38 (1) |
| Phrynobatrachus natalensis (Smith, 1849) | 1044 | 0 | 0 | 1044 | 18.38 (2) | |
| Ptychadenidae | Ptychadena anchietae (Barboza du Bocage, 1868) | 48 | 7 | 0 | 55 | 0.97 (10) |
| Ptychadena beka Goutte, Reyes-Velasco, Freilich, Kassie, and Boissinot, 2021 | 12 | 10 | 0 | 22 | 0.39 (17) | |
| Ptychadena doro Goutte, Reyes-Velasco, Freilich, Kassie, and Boissinot, 2021 | 15 | 0 | 0 | 15 | 0.26 (19) | |
| Ptychadena erlangeri (Ahl, 1924) | 29 | 0 | 0 | 29 | 0.51 (13) | |
| Ptychadena neumanni (Ahl, 1924) | 16 | 0 | 0 | 16 | 0.28 (18) | |
| Ptychadena nilotica (Seetzen, 1855) | 382 | 6 | 5 | 393 | 6.92 (6) | |
| Ptychadena schillukorum (Werner, 1908) | 11 | 0 | 0 | 11 | 0.19 (21) | |
| Pipidae | Xenopus clivii Peracca, 1898 | 93 | 0 | 17 | 110 | 1.93 (9) |
| Xenopus largeni Tinsley, 1995 | 9 | 0 | 0 | 9 | 0.16 (22) | |
| Total | 4457 | 501 | 720 | 5678 | ||
Table 3.
Species and genus composition, abundance and relative abundance among families in Keffa.
| Family | Genus | Species | Abundance | Relative Abundance (%) |
|---|---|---|---|---|
| Arthroleptidae | 1 | 4 | 508 | 8.95 |
| Hyperoliidae | 4 | 7 | 2204 | 38.82 |
| Conrauidae | 1 | 1 | 7 | 0.12 |
| Hemisotidae | 1 | 2 | 52 | 0.92 |
| Phrynobatrachidae | 1 | 2 | 2201 | 38.76 |
| Pipidae | 1 | 2 | 119 | 2.10 |
| Ptychadenidae | 1 | 7 | 541 | 9.53 |
| Pyxicephalidae | 1 | 1 | 46 | 0.81 |
| Total | 11 | 26 | 5678 | 100.00 |
Table 4.
Sorensen’s Coefficient Similarity Index (SCSI) and Jaccard’s Coefficient Similarity Index (JCSI) of frog species among the three habitat types.
Table 4.
Sorensen’s Coefficient Similarity Index (SCSI) and Jaccard’s Coefficient Similarity Index (JCSI) of frog species among the three habitat types.
| Paired Habitats | Number of Species | Similarity Indices | ||||
|---|---|---|---|---|---|---|
| Unique to AL | Unique to RF | Unique to WL | Shared | SCSI | JCSI | |
| AL Vs RF | 5 | 6 | - | 3 | 0.40 | 0.25 |
| AL Vs WL | 4 | - | 14 | 5 | 0.34 | 0.21 |
| RF Vs WL | - | 5 | 14 | 5 | 0.39 | 0.24 |
Note that: AL = agricultural land, RF = riverine forest, and WL = wetland.
Table 5.
Diversity variation of frog species between rainy and dry seasons.
| Dry Season | Rainy Season | Diversity t-Tests | |||
|---|---|---|---|---|---|
| t | df | p (Same) | |||
| Richness | 26 | 25 | |||
| Abundance | 2287 | 3391 | |||
| Simpson D | 0.87 | 0.88 | 2.32 | 4636.7 | 0.02 |
| Shannon H | 2.41 | 2.47 | −2.17 | 4791.2 | 0.03 |
Table 6.
Summary statistics for General Linear Model (GLM) for abundance relationships with selected environmental variables for frog species.
Table 6.
Summary statistics for General Linear Model (GLM) for abundance relationships with selected environmental variables for frog species.
| Abundance | ||||
|---|---|---|---|---|
| Predictors | Estimate | SE | z Value | p |
| Intercept | 1.132 × 1001 | 1.319 × 10+00 | 8.582 | <2 × 10⁻¹⁶ *** |
| Habitat (Riverine Forest) | 1.089 × 10−01 | 5.917 × 10−02 | 1.840 | 0.0657 |
| Habitat (Wetland) | 2.093 × 10+00 | 4.486 × 10−02 | 46.649 | <2 × 10⁻¹⁶ *** |
| Temperature | −5.106 × 10−01 | 4.449 × 10−02 | −11.477 | <2 × 10⁻¹⁶ *** |
| Precipitation | 4.507 × 10−04 | 2.775 × 10−04 | 1.624 | 0.1044 |
| Altitude | −9.363 × 10−05 | 5.672 × 10−05 | −1.651 | 0.0988 |
| Slope | −1.889 × 10−02 | 3.387 × 10−03 | −5.579 | 2.43 × 10−08 *** |
*** represents an extremely significant level (p < 0.001).
Disclaimer/Publisher’s Note: The statements, opinions and data contained in all publications are solely those of the individual author(s) and contributor(s) and not of MDPI and/or the editor(s). MDPI and/or the editor(s) disclaim responsibility for any injury to people or property resulting from any ideas, methods, instructions or products referred to in the content. |
© 2023 by the authors. Licensee MDPI, Basel, Switzerland. This article is an open access article distributed under the terms and conditions of the Creative Commons Attribution (CC BY) license (https://creativecommons.org/licenses/by/4.0/).
Share and Cite
MDPI and ACS Style
Kassie, A.; Simegn, A.B.; Bogale, B.A.; Goutte, S.; Boissinot, S. Diversity, Distribution, and Habitat Association of Anuran Species from Keffa, Southwest Ethiopia. Diversity 2023, 15, 300. https://doi.org/10.3390/d15020300
AMA Style
Kassie A, Simegn AB, Bogale BA, Goutte S, Boissinot S. Diversity, Distribution, and Habitat Association of Anuran Species from Keffa, Southwest Ethiopia. Diversity. 2023; 15(2):300. https://doi.org/10.3390/d15020300
Chicago/Turabian StyleKassie, Abeje, Afework Bekele Simegn, Bezawork Afework Bogale, Sandra Goutte, and Stephane Boissinot. 2023. "Diversity, Distribution, and Habitat Association of Anuran Species from Keffa, Southwest Ethiopia" Diversity 15, no. 2: 300. https://doi.org/10.3390/d15020300
Note that from the first issue of 2016, this journal uses article numbers instead of page numbers. See further details here.