Genetic variation of endangered Jankowski’s Bunting (Emberiza jankowskii): High connectivity and a moderate history of demographic decline
 Long Huang
 Guochen Feng1
  Lishi Zhang
- 1School of Life Sciences, Jilin Agricultural University, Changchun, China
- 2School of Life Sciences, Northeast Normal University, Changchun, China
- 3School of Animal Science and Technology, Jilin Agricultural University, Changchun, China
Introduction: Continued discovery of “mismatch” patterns between population size and genetic diversity, involving wild species such as insects, amphibians, birds, mammals, and others, has raised issues about how population history, especially recent dynamics under human disturbance, affects currently standing genetic variation. Previous studies have revealed high genetic diversity in endangered Jankowski’s Bunting. However, it is unclear how the demographic history and recent habitat changes shape the genetic variation of Jankowski’s Bunting.
Methods: To explore the formation and maintenance of high genetic diversity in endangered Jankowski’s Bunting, we used a mitochondrial control region (partial mtDNA CR) and 15 nuclear microsatellite markers to explore the recent demographic history of Jankowski’s Bunting, and we compared the historical and contemporary gene flows between populations to reveal the impact of habitat change on population connectivity. Specifically, we aimed to test the following hypotheses: (1) Jankowski’s Bunting has a large historical Ne and a moderate demographic history; and (2) recent habitat change might have no significant impact on the species’ population connectivity.
Results: The results suggested that large historical effective population size, as well as severe but slow population decline, may partially explain the high observable genetic diversity. Comparison of historical (over the past 4Ne generations) and contemporary (1–3 generations) gene flow indicated that the connectivity between five local populations was only marginally affected by landscape changes.
Discussion: Our results suggest that high population connectivity and a moderate history of demographic decline are powerful explanations for the rich genetic variation in Jankowski’s Bunting. Although there is no evidence that the genetic health of Jankowski’s Bunting is threatened, the time-lag effects on the genetic response to recent environmental changes is a reminder to be cautious about the current genetic characteristics of this species. Where possible, factors influencing genetic variation should be integrated into a systematic framework for conducting robust population health assessments. Given the small contemporary population size, inbreeding, and ecological specialization, we recommend that habitat protection be maintained to maximize the genetic diversity and population connectivity of Jankowski’s Bunting.
Introduction
Genetic diversity plays an important role in the environmental adaptation and the long-term evolution of species (Mable, 2019). Climate change and human activities since the Industrial Revolution are major contributors to the loss of genetic variation in wild populations worldwide (Leigh et al., 2019). Under the influence of habitat loss and fragmentation, endangered species with small population sizes and narrow distributions are more susceptible to genetic drift and inbreeding depression than common species, leading to the loss of intraspecific variation (Frankham et al., 2002). Furthermore, the isolation effect between habitat patches often blocks gene flow between populations, ultimately resulting in genetic isolation and accelerated extinction (Nei, 1973). Numerous empirical studies have shown that low genetic diversity and gene flow between populations appear to have become the “tags” of endangered species (Wang et al., 2015; Hague and Routman, 2016; Basiita et al., 2017). However, several recent studies in birds, amphibians, and mammals have shown that large historical effective population size (Ne) and long generation time can act as buffers against the loss of genetic variation, leading to an observed high genetic diversity in threatened populations (Brekke et al., 2011; Torres-Florez et al., 2014; Zhang et al., 2015). In addition, mild population dynamics (a little variation in Ne over time), ecological selection for increased heterozygotes, and exogenous gene flow may also explain the genetic stability of declined populations (Schroeder et al., 2010; Peters et al., 2014). Demographic processes, along with species characteristics such as mutation rates and life history, together determine the current amount and distribution of genetic variation (Hague and Routman, 2016). Tracing back demographic bottlenecks and expansions, as well as more complex fusion and differentiation events, can deepen our understanding of the current patterns of genetic variation.
Owing to excessive and intensive land-use (Yin et al., 2018), mainly involving agricultural production, overgrazing, and other human activities (Wang et al., 2011), wild species in Inner Mongolia are threatened by habitat loss, fragmentation, and degradation (Jiang et al., 2008). Jankowski’s Bunting, Emberiza jankowskii, is a small resident bird with historical breeding grounds only in northeastern China, the Far-East Russia, and north-eastern North Korea. Its population has been in decline since the 1960s, and its distribution has shrunk dramatically (Jiang et al., 2008; Wang et al., 2011; Han et al., 2017). According to a recent and extensive population survey report, the distribution of Jankowski’s Bunting population in China is limited to 16 towns near Zhaluteqi in eastern Inner Mongolia (Han et al., 2017). Nevertheless, field observations and stable isotopes (δ2H) showed that Jankowski’s Bunting often spreads in short distance or even far away from the breeding area, rather than all being sedentary (Han et al., 2017, 2021). Its wintering habitat can reach as far as Beijing (Chao et al., 2016). The Jankowski’s Bunting population exhibited an island-like distribution due to habitat fragmentation. Based on remote sensing and bird density, the population size was estimated to be approximately 9,800–12,500 individuals, while the suitable habitat area was only 280 km2 (Han et al., 2017). Jankowski’s Bunting is currently listed as ‘endangered’ on the IUCN Red List of Threatened Species. The species prefers low altitude hills and grasslands with grass (such as Stipa baicalensis and Spodiopogon sibiricus) and small shrubs (such as Prunus sibirica; Gao et al., 2003). The main threats to its survival include habitat fragmentation and degradation, nest parasitism, grazing disturbance, drought, wildfire, and mercury exposure (Jiang et al., 2008; Feng et al., 2020; Zhang et al., 2020; Han et al., 2022). Currently, although the authorities have taken measures to protect grassland habitats, which will help the population recover in the short term, the genetic impact of ecological pressure on the population and the long-term population dynamics are still unclear. Previous limited studies have revealed an unexpectedly high genetic diversity and absence of genetic structure in the metapopulation consisted of five local populations around Zhaluteqi in eastern Inner Mongolia (Li et al., 2021). However, snapshots of the current genetic variation in Jankowski’s Bunting are insufficient to provide robust evidence of genetic health. Evaluation of population dynamics would contribute to the comprehensive assessment of population health and targeted implementation of conservation efforts.
Technological advances in genetic analysis enable us to infer the demographic history of a species from a contemporary single-sample (Mondin et al., 2018). Bayesian skyline plots (BSPs) inferred from mtDNA D-loop sequences have revealed a long-term stable demographic history of Jankowski’s Bunting (Li et al., 2021). This stability appears to derive from the ice-free geological history of Northeast Asia during the Pleistocene (Wang et al., 2013; Dong et al., 2017). However, BSP analysis has many limitations, such as an over-reliance on molecular clock calibration and sampling strategies (Grant, 2015). When the population is decimated by glaciation, the decline is not severe enough to qualify as a bottleneck but sufficient to erase previous demographic history (Grant et al., 2012). Additionally, simulation studies showed that small sample size cannot provide the power needed to detect population expansion, and the loss of information during population fluctuations often leads to a flat BSP being overinterpreted as population stability (Grant, 2015). Although large-scale geological history plays an irreplaceable role in shaping the current patterns of genetic variation in populations, the impact of recent habitat changes may be more pronounced (Zarlenga et al., 2014; Feng et al., 2018; Leigh et al., 2019). So far, the lack of fine-scale demographic maps of Jankowski’s Bunting has led to a vague understanding of recent history. The DIYABC program based on approximate Bayesian computation (ABC) accepts user-defined complex evolutionary scenarios with loose requirements for samples, and provides estimates of posterior probability and parameter confidence, which can be used to reconstruct robust evolutionary history using coalescent simulation (Cornuet et al., 2008). Routine detections of expansion and bottleneck events, such as neutrality test and nucleotide mismatches, which have strong statistical power for low frequency mutations in non-recombinant regions, could provide supplementary information for reconstruction of demographic history (Ramos-Onsins and Rozas, 2002; Ramírez-Soriano et al., 2008).
Assessing and increasing the connectivity between isolated populations is an important measure to help small populations resist to habitat fragmentation (Beier et al., 2008; Newmark, 2008). The commonly used estimators and coalescent-based Migrate-n yielded extremely high estimates of historical migration rates over the past 4Ne generations; this time period may be over hundreds of years in the past for the Jankowski’s Bunting, which is much longer than the duration of recent human disturbance (Li et al., 2021). However, the impact of recent (<200 years) environmental changes on contemporary population connectivity is unknown. In addition, both estimators are based on constant migration rates and are subject to numerous assumptions, which may be unreasonable for populations in highly disturbed habitats (Wilson and Rannala, 2003). In contrast to the estimators of long-term gene flow, disequilibrium-based Bayesian estimators allow for arbitrary allele frequency distributions and deviations from Hardy–Weinberg equilibrium (HWE; Wilson and Rannala, 2003), which may be more appropriate for the populations we study. The comparison of historical and contemporary gene flow provides an opportunity to understand the impacts of recent habitat changes caused by human activity on population connectivity (Chiucchi and Gibbs, 2010; Epps et al., 2013a,b). Due to the high mobility of birds, as well as the narrow distribution of local populations and the lack of geographic barriers, we expect that recent habitat changes may not have a significant impact on population connectivity.
Evolutionary forces act differently on different molecular markers (Hoarau et al., 2004), thus a single marker cannot fully reflect the entire evolutionary process of a population. The combination of molecular markers with different mutation rates can provide a comprehensive insight into the evolution history of the studied population (Hindrikson et al., 2017). In this study, we used a mitochondrial control region (partial mtDNA CR) and 15 nuclear microsatellite markers to explore the recent demographic history of Jankowski’s Bunting, and we compared the historical and contemporary gene flows between populations to reveal the impact of habitat change on population connectivity. Specifically, we aimed to test the following hypotheses: (1) Jankowski’s Bunting has a large historical Ne and a moderate demographic history; and (2) recent habitat change might have no significant impact on the species’ population connectivity. Despite the lack of historical census data, the high genetic diversity, absence of genetic structure, historical frequent records, and the availability of grassland-dominated habitats may support the rationality of the above assumptions (Li H. et al., 2019; Li et al., 2021). This study aims to provide a clearer picture of the demographic history and genetic imprints of recent environmental changes in the species, as well as lead to effective conservation efforts.
Materials and methods
Sample collection and DNA extraction
Blood samples from 117 Jankowski’s Buntings were used in this study [including 59 samples described in Li et al., 2021], which were collected from 2012 to 2019 at five localities in Inner Mongolia: Aolunhua (ALH), Gahaitu (GHT), Lubei (LB), Kundu (KD), and Chagantaoligao (CG; Figure 1). These sampling sites represented the known breeding grounds of Jankowski’s Bunting. During the breeding season each year, between May and July, nests were located and recorded by visual search and bird calls at the above locations. To minimize the interference of sampling on reproduction, adults were captured by setting mist nets around the nest after the breeding period. The blood samples (approximately 10 μl) were collected by wing vein puncture, then preserved in 1 ml anhydrous ethanol in a 1.5-ml sterilized centrifuge tube and stored in liquid nitrogen in the field. Total genomic DNA was extracted using AxyPrep Blood Genomic DNA Miniprep Kit (Aisijin, Hangzhou, China) following the manufacturer’s instructions.
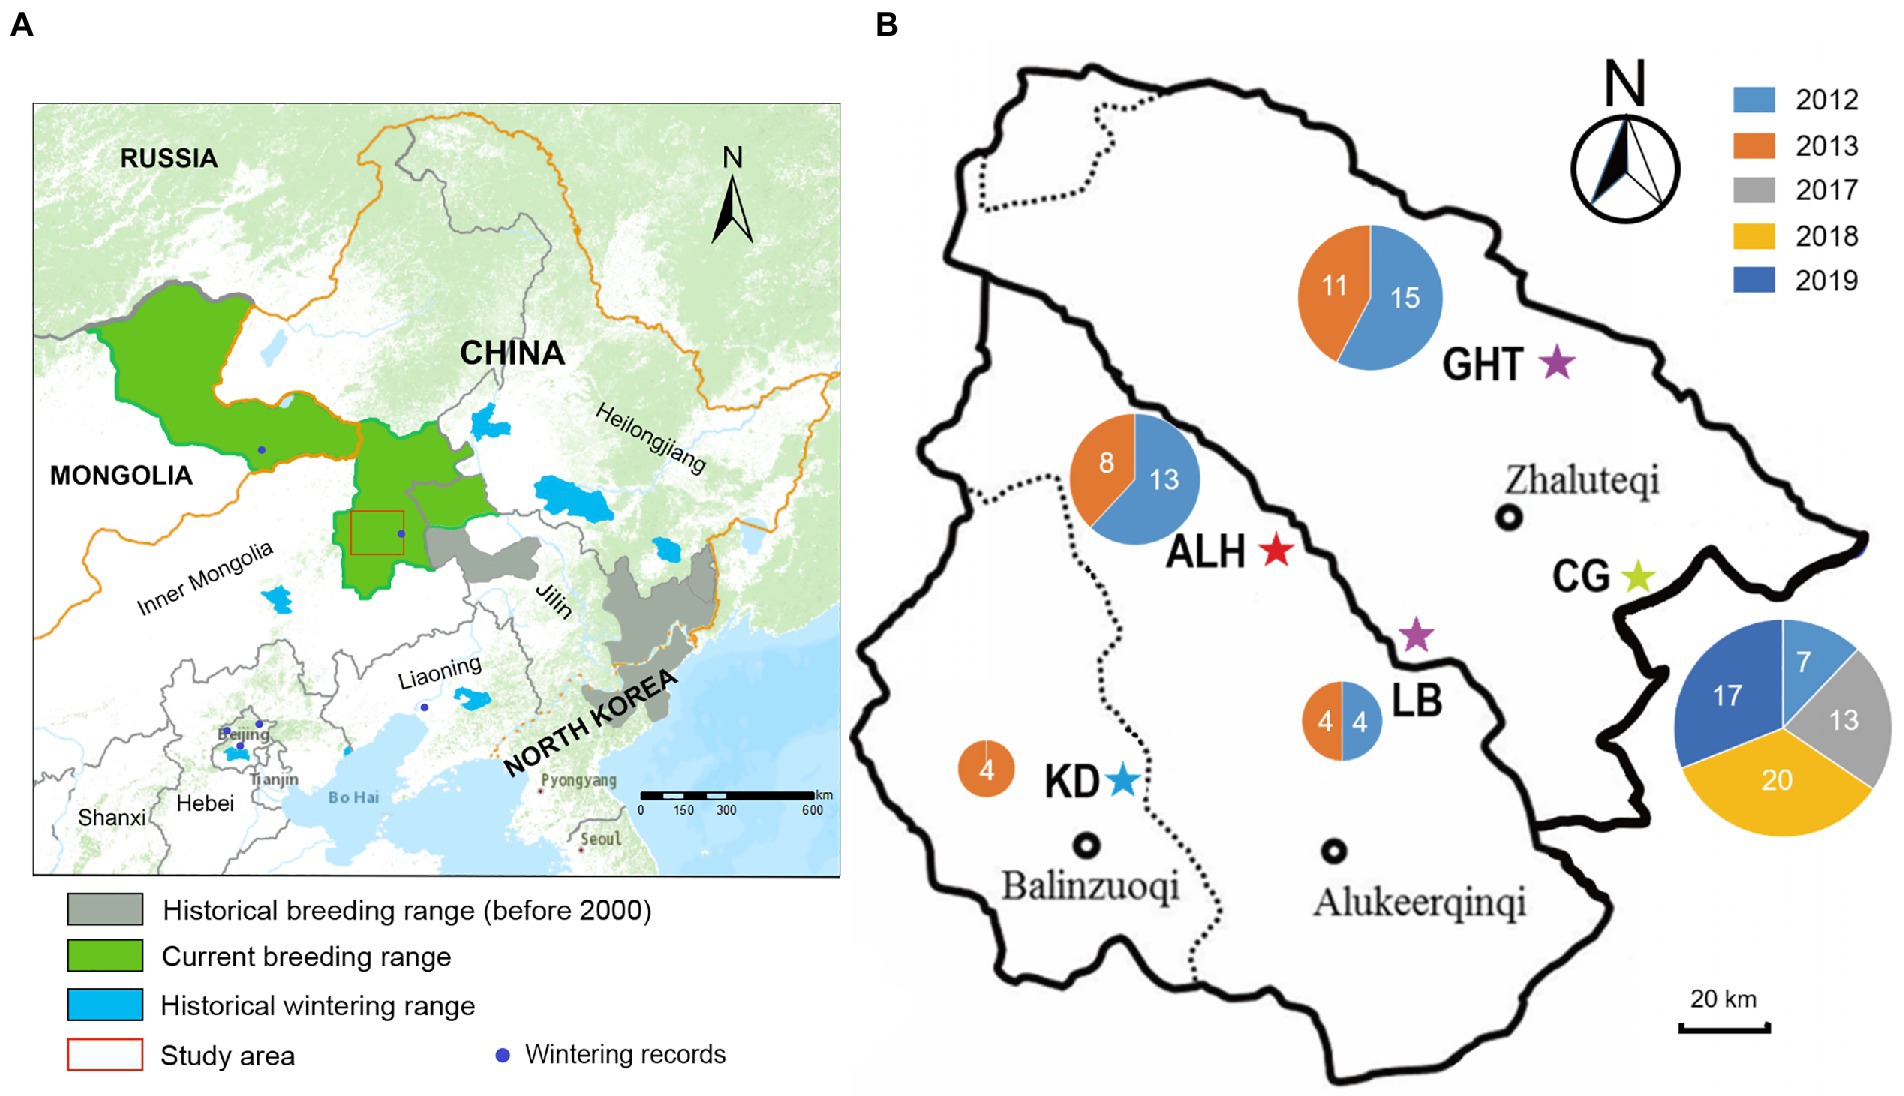
Figure 1. Distribution range and sampling information of Jankowski’s Bunting. (A) Approximate breeding distribution of Jankowski’s Bunting and location of the sampling region. Information on distribution ranges was derived from previous studies (Han et al., 2017, 2021). (B) Detailed location of sampling sites. Pentagrams indicate sampling sites. The size of the circle is proportional to the sample size at each site, and the number indicates the sample size in different years (see color legend). ALH, Aolunhua; CG, Chagantaoligao; GHT, Gahaitu; KD, Kundu; LB, Lubei.
MtDNA amplification, sequencing, and analysis
A few samples did not amplify due to the limited volume of blood. Of the 117 samples, 116 were used for CR amplification and sequencing. We used the novel primers A629 (5′-GTATTCAACCGACCACTT-3′) and S19 (5′-CTCCGAGACCTACGACCTG-3′) to amplify 540 base pairs (bp) of the CR based on sequences obtained previously (GenBank accession no. MH670589 to MH670647). DNA amplification of CR was performed in 20-μl volumes containing 10 μl of 2× Taq PCR Master Mix (Sangon Biotech, Shanghai, China), 0.25 μl of each primer (10 μM), 8.5 μl H2O, and 1 μl template DNA (approx. 50 ng/μl). The PCR cycling program was as follows: an initial denaturation step at 94°C for 5 min, followed by 35 cycles of denaturation at 94°C for 30 s, annealing at 53.7°C for 30 s, and extension at 72°C for 30 s; then a final extension at 72°C for 10 min. The PCR products were electrophoresed on 1% agarose gels and sequenced by Sangon in Shanghai, China.
Sequences were checked and aligned using Bioedit Sequence Alignment Editor (Hall, 1999) and Clustal X v1.83 (Jeanmougin et al., 1998). It is important to note that most analyses were performed only on populations with sufficient sample size (i.e., ALH, CG, GHT). KD and LB populations were not used for neutrality tests, mismatch analyses, and estimates of Ne due to possible bias due to small sample sizes (<10). Nevertheless, we still retain KD and LB populations in other analyses (i.e., genetic diversity, migration, and genetic structure), as these two populations are essential for understanding population connectivity and stratification in the study area. To evaluate genetic diversity, common statistical parameters, such as the number of polymorphic sites (S), number of haplotypes (H), average number of nucleotide differences (k), haplotype diversity (Hd), and nucleotide diversity (π), were calculated with DnaSP v6 (Rozas et al., 2017).
To clarify the genetic relationships among the five local populations, a statistical parsimony (i.e., TCS) network of mtDNA CR was constructed in PopART (Leigh and Bryant, 2015) using a 95% parsimony connection limit. The TCS method provides an empirical assessment of parsimony biases and is considered the most informative method for exploring the phylogeographic history of species with low divergence (Posada and Crandall, 2001).
The distribution of variation among and within local populations was assessed by Analysis of Molecular Variance and F-statistics in Arlequin v3.5 (Excoffier and Lischer, 2010) with 1,000 permutations to assess statistical significance of fixation indices.
Neutrality tests based on allele frequency distribution were carried out for both the local populations and the metapopulation with Arlequin to calculate the Tajima’s D and Fu’s Fs values and their significance. Tajima’s D and Fu’s Fs, as methods of testing neutral evolution, can be used to trace the demographic events (Fu, 1997; Liu et al., 2006). Tajima’s D test is more powerful for assessing the long-term history, while Fu’s Fs is sensitive to recent fluctuations (Depaulis et al., 2003). Arlequin was also used to analyze the mismatch distribution of pairwise nucleotide differences under the constant population size model (Rogers and Harpending, 1992). Subsequently, a mismatch distribution diagram was plotted in DnaSP and used to visualize the historical population dynamics. If an expansion event was detected, the formula (Rogers and Harpending, 1992) was used to estimate the population expansion time (t), where τ (tau) is the expansion constant under the sudden expansion model calculated by Arlequin, μ is the mean mutation rate of nucleotides per generation, and k is the sequence length in nucleotides. We did not use spatial expansion model due to the lack of reliable information on population history. Due to the lack of available mutation rates, the average mutation rate of 8.72 × 10⁻⁸ substitutions per site used for the first domain of the mtDNA CR of the yellow warbler (Dendroica petechia, Passeriformes) and 1.156 × 10⁻⁸ substitutions per site calibrated for the coal tits (Periparus ater, Passeriformes) were applied to the above calculations to generate robust estimates (Milot et al., 2000; Cabanne et al., 2007; Pentzold et al., 2013; Tritsch et al., 2018).
Microsatellite amplification, genotyping, and analysis
For microsatellite analysis, a total of 15 polymorphic loci and 103 of the 117 samples were used in this study without multiplex amplification. We selected the primers used in the previous study for this species and its relatives. These primers represent most of the available loci of this species and are suitable for genetic polymorphism analysis through experimental verification. The specific information for each pair of microsatellite primers can be found in Supplementary Table 1. The PCR procedure and reaction volume previously described for CR amplification, as well as the annealing temperature optimized for each primer pair, was used to perform subsequent microsatellite amplification. The genotyping procedure was executed on ABI 3730xl DNA Analyzer platform. Final fragment sizes were calculated in GeneMarker v1.91 (SoftGenetics LLC, State College, PA, United States) and scored manually by Sangon Biotech (Shanghai, China).
We checked for deviations from the HWE resulting from heterozygote excess or deficiency at each microsatellite locus and overall with Genepop v4.7 (Raymond and Rousset, 1995). Fisher’s exact tests of linkage disequilibrium (LD) were also implemented in Genepop for all pairwise combinations of loci. The exact p-values were corrected by sequential Bonferroni tests. Micro-checker v2.2.1 (Oosterhout et al., 2010) was used to investigate the presence of possible null alleles, large allele dropout, or stuttering for each locus. Estimation of locus and population-based diversity indices including the number of alleles (Na), allelic richness (Ar), observed heterozygosity (Ho), and expected heterozygosity (He) was performed in FSTAT v2.9.4 (Goudet, 1995). In addition, Cervus v3.0.7 (Kalinowski et al., 2007) was used to calculate the polymorphic information content (PIC), a parameter used to describe the informativeness of microsatellite loci.
Two complementary methods based on microsatellite data were used to detect potential genetic structure. First, Analysis of Molecular Variance and F-statistics were implemented in Arlequin, performing 1,000 and 3,000 permutations of significance tests, respectively, to evaluate the genetic similarity of local populations. Second, we used a Bayesian approach implemented in STRUCTURE v2.3.4 (Pritchard et al., 2000) to obtain reasonable group clustering and visualize the genetic connections between local populations. Genetic subdivision was evaluated by estimating the likelihood and sample composition of independent runs of subgroups (K = 1–10), assuming an admixture model with correlated allele frequencies. Each run was repeated 10 times, with 1,000,000 Markov chain Monte Carlo (MCMC) iterations and a burn-in period of 100,000 to check for convergence. The optimal K value was determined according to the ΔK statistical method (Evanno et al., 2005) as well as the likelihood values.
Despite the strong migratory capacity of birds, recent habitat fragmentation may still have cryptic effects on genetic communication between populations, resulting in a certain geographical distribution pattern of intraspecific variation. To test for a pattern of isolation by distance, a Mantel test of genetic (Codom genotypic genetic distance matrix) and geographic (Unit: km) distance between populations was carried out by using the software package GenAIEx v6.5 (Peakall and Smouse, 2006; Peakall and Smouse, 2012). 1,000 permutations were used to test for statistical significance.
Historical and recent gene flow tests were performed in two programs using a Bayesian approach and MCMC sampling implemented in Migrate-n v3.7.2 (Beerli, 2006) and BayesAss v3.0 (Wilson and Rannala, 2003), respectively. The two programs can produce comparable estimates of gene flow parameters (e.g., proportion of immigrants in a population per generation) at different time scales: Migrate-n produces an Ne and gene flow parameters among populations over approximately the past 4Ne generations, while BayesAss allows a recent (1–3 generations) estimation of migration rates (Samarasin et al., 2017). As recommended in the tutorials for Migrate-n, we ran three independent replicates with the Brownian motion mutation model. The search strategy was set to Bayesian inference. One long chain with 5,000 recorded steps, 500,000 sampled genealogies, and a sample increment of 100 were run to allow a wider search of the genealogy space. The number of discarded trees per chain (burn-in) was set to 5,000. Each MCMC run consisted of an analysis of adaptive heating with different temperatures (1; 1.5; 3; and 10,000) to assure convergence. BayesAss allows genotype frequencies to deviate from HWE or mutation-drift equilibrium (Wilson and Rannala, 2003). We performed three independent MCMC runs with 10,000,000 iterations and a sampling frequency of 100. The first 1,000,000 iterations were discarded as burn-in. According to the tutorial, we increased the proposal step size for the mixing parameters associated with proposed moves of the allele frequencies (0.7), inbreeding coefficients (1.0), and migration rates (0.3) to ensure an acceptance rate between 0.2 and 0.6. To ensure that the MCMC chains had converged, we checked the log probabilities for each run using Tracer v1.7.2 (Rambaut et al., 2018). The commonly used microsatellite mutation rate of 5 × 10⁻⁴ for vertebrates and the mutation-scaled formulae and were used for the parameter transformation to produce comparable values for the migration rate (Chiucchi and Gibbs, 2010; Li et al., 2017; Speer et al., 2017; DeSilva and Dodd, 2020).
To obtain a global view of the demographic history of Jankowski’s Bunting, we estimated and compared the long-term and contemporary Ne for each local population as well as for the metapopulation. Since heterozygosity-based estimators are sensitive to the microsatellite mutation model, the long-term Ne in this study was calculated under two extreme mutation models, infinite allele model (IAM; Maruyama and Fuerst, 1985) and stepwise mutation model (SMM; Ohta and Kimura, 1973). Although the mutational pattern of microsatellites may vary from locus to locus, which is out of the scope of this study, the actual mutational process is generally intermediate between IAM and SMM (Bagley et al., 1999; Xu and Fu, 2004). The long-term Ne was estimated by the formula assuming SMM and the formula under IAM, respectively, where He is average expected heterozygosity and μ represents microsatellite mutation rate (Lehmann et al., 1998). Insufficient independent knowledge of mutation rate limits the accuracy of estimating Ne from multilocus data, so we used a range of microsatellite mutation rates for common taxa, including a typical value of 5 × 10⁻⁴ for vertebrates and a reliable range of 10−3–10−4 for tit species (Weber and Wong, 1993; Xu et al., 2000; Garza and Williamson, 2001; Hansson et al., 2014; Tritsch et al., 2018). The contemporary Ne was estimated in NeEstimator v2 (Do et al., 2014) under the random mating model. Two single-sample estimators based on linkage disequilibrium and molecular coancestry, respectively, and the standard temporal approach were used for the analyses (Waples, 2006; Nomura, 2008). Given the limited sample size and the fact that rare alleles can lead to an underestimation of LD-based values, we chose a minor allele frequency threshold of 0.01 to exclude single copy alleles. Compared with the single-sample estimator, the temporal estimator is less sensitive to migration and more accurate with long sampling interval (Luikart et al., 2010; Gilbert and Whitlock, 2015). The 1.7-year generation time of Jankowski’s Bunting was used for this estimation (Saether et al., 2005; Irwin et al., 2009). We assumed that there are three generations between the composite samples from 2012 to 2013 and the samples from 2019.
We used two methods based on allele frequency distribution and heterozygosity to detect bottleneck events. Under the IAM, SMM, and two-phase mutation model (TPM; Di Rienzo et al., 1994) in Bottleneck v1.2.02 (Piry et al., 1999), we tested for recent genetic bottlenecks (0.8–4.0 Ne generations), which did not require prior information on population size or genetic variation (Romane et al., 2010). TPM tests were run assuming 70% single-step mutations with 30% multi-step mutations. We performed the sign test and Wilcoxon sign-rank test to estimate heterozygosity excess or deficiency, the latter being most appropriate in the case of fewer than 20 microsatellite loci (Piry et al., 1999). Additionally, we checked for deviations in the allele frequency distribution from the normal L-shaped distribution (mode-shift). Rare alleles tend to be lost in a severely reduced population, resulting in fewer low-frequency alleles than intermediate-frequency alleles (Luikart et al., 1998). A mode-shift indicator, represented graphically, can detect the loss of rare alleles during a recent bottleneck, specifically over the last few dozen generations (Cornuet and Luikart, 1996; Luikart et al., 1998). All tests were based on 1,000 iterations.
To explore plausible scenarios of recent population dynamics in the Jankowski’s Bunting, ABC modeling was implemented in DIYABC v 2.1.0 (Cornuet et al., 2014) using a combined dataset of mtDNA and microsatellites. Due to the lack of prior information on the demographic history, we first defined seven possible scenarios (Scenario 1: constant Ne; Scenario 2: a recent bottleneck; Scenario 3: an old bottleneck; Scenario 4: a recent expansion; Scenario 5: an old expansion; Scenario 6: an old bottleneck followed by a recent expansion; Scenario 7: an old expansion followed by a recent bottleneck) for the metapopulation and then estimated the posterior probability of each scenario via two methods, direct estimation and logistic regression. Finally, we selected the best model for estimating historical demographic parameters. We adjusted the prior settings of some parameters before implementing the simulations. For genetic data and summary statistics, the motif size and allelic range for microsatellite loci were reset according to detailed locus information, and default settings were used for other parameters. All available parameters for microsatellites (e.g., mean number of alleles, mean genetic diversity, and mean size variance) and DNA sequences (e.g., number of haplotypes, mean of pairwise differences, and Tajima’s D) were used as summary statistics to generate the reference table. For the historical model of predefined scenarios, the Uniform distribution and adjusted intervals for time and Ne were applied to all parameters. The final parameter setting is shown in Supplementary Table 2. Kimura 2-parameter model was used as the mutation model of mtDNA CR. Following the program’s recommendations, 1,000,000 simulated datasets were applied to each scenario for robust results. Routine analyses, including pre-evaluation of scenarios and prior distributions, comparison of scenarios, estimation of parameters, and model checking, were performed to evaluate the confidence of the results. Parameters of interest were converted to calendar years based on an assumed 1.7-year generation time of Jankowski’s Bunting (Saether et al., 2005; Kondo et al., 2008; Irwin et al., 2009).
Results
Contemporary genetic diversity
The information of genetic diversity for all populations is shown in Table 1. In terms of the metapopulation, the mtDNA haplotype diversity (Hd) was 0.877, the nucleotide diversity (π) was 0.0046, and the average number of nucleotide differences (k) was 2.489. For the five local populations, the Hd, π, and k ranged from 0.833 to 0.871, 0.0028 to 0.0061, and 1.500 to 3.317, respectively. The GHT population had the highest π and k, 0.0061 and 3.317, respectively, which were higher than those of the CG population with the largest sample size.
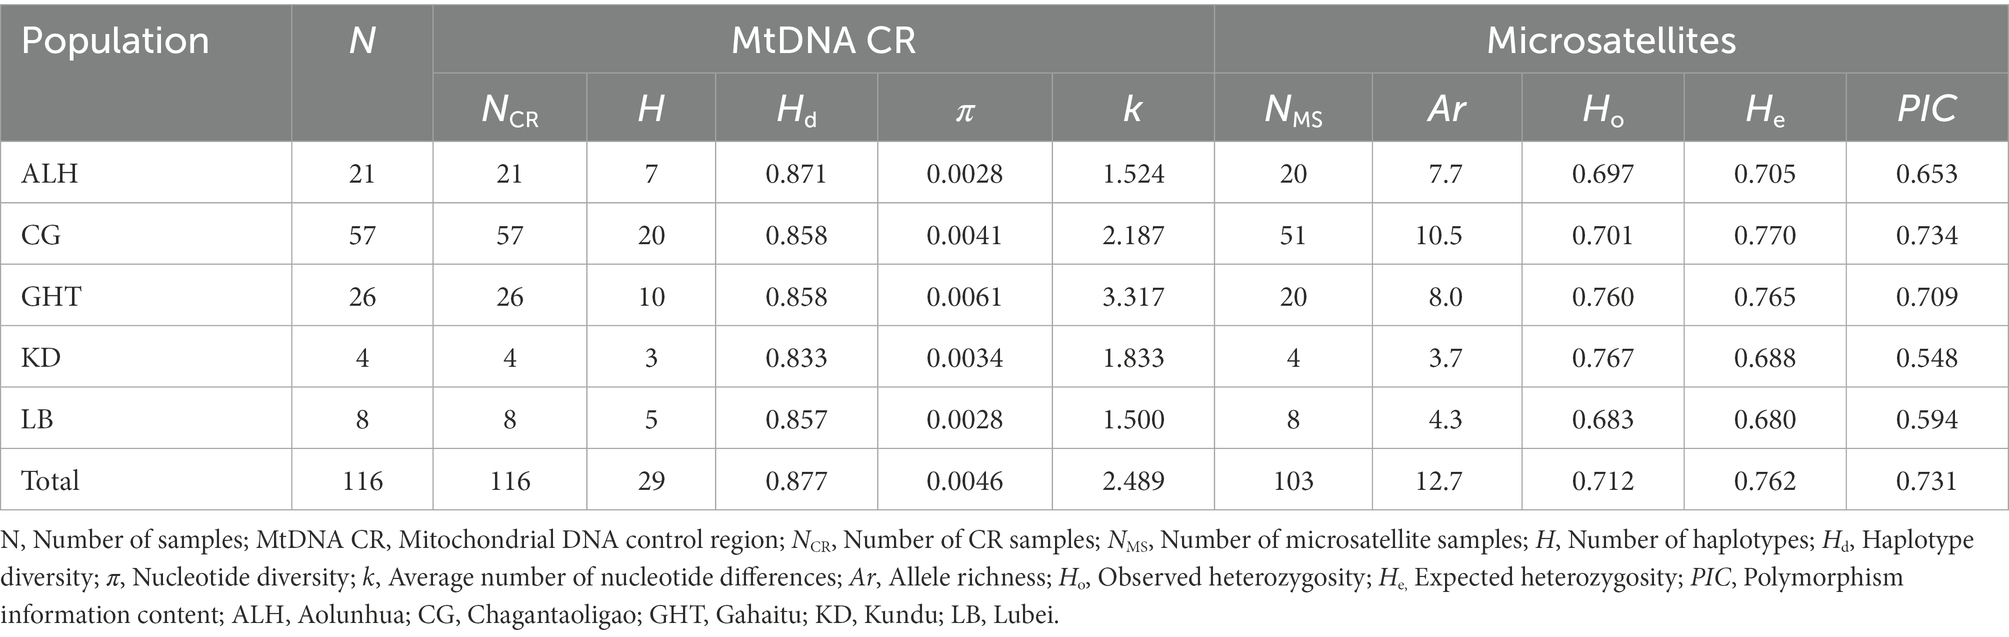
Table 1. Genetic diversity of Jankowski’s Bunting based on mitochondrial control region and 15 microsatellite loci.
For the microsatellite markers, all 15 loci were successfully amplified and bore high polymorphism (PIC > 0.5). We detected 191 alleles within 103 samples. Supplementary Table 3 shows the estimates for all parameters of interest, such as the observed heterozygosity (Ho) and expected heterozygosity (He). The number of alleles at each locus ranged from 4 to 27, with an average of 12.7. After sequential Bonferroni correction, loci Mme8 and LS2 significantly deviated from HWE (p < 0.01). Linkage disequilibrium tests of all pairs of loci revealed no significant p-values, suggesting that all loci were inherited independently. The null allele frequency exceeded 0.05 for four loci (Sosp13, Escμ04, Ecit2, and LS2). In isolated wild populations, loci affected by demographic bottlenecks, genetic drift, null allele, inbreeding, and natural selection are likely to deviate from HWE (Dąbrowski et al., 2015; Murphy et al., 2019). We retained these loci as these deviations were unlikely to significantly affect subsequent genetic analyses (Chapuis and Estoup, 2007; Murphy et al., 2019). The Ho and He of the five local populations ranged from 0.683 to 0.767 and 0.680 to 0.770, respectively, while those of the metapopulation reached 0.712 and 0.762 (Table 1). Although the small sample size of KD and LB populations may lead to biased estimations of diversity, in general, each local population of Jankowski’s Bunting showed similar and high genetic diversity.
Genetic similarity among populations
We defined 29 haplotypes based on the CR sequence data with 52 polymorphic sites. The statistical parsimony network showed a complicated topology, with most haplotypes radially clustered around three major haplotypes (Hap 1, 2, and 4; Figure 2). Except for Hap 27, which differed from the nearest potential haplotype by 21 nucleotide mutations, only 1–2 mutational steps occurred between most of the remaining haplotypes (Figure 2). All haplotypes were admixed without clear group clustering, suggesting genetic similarity among local populations.
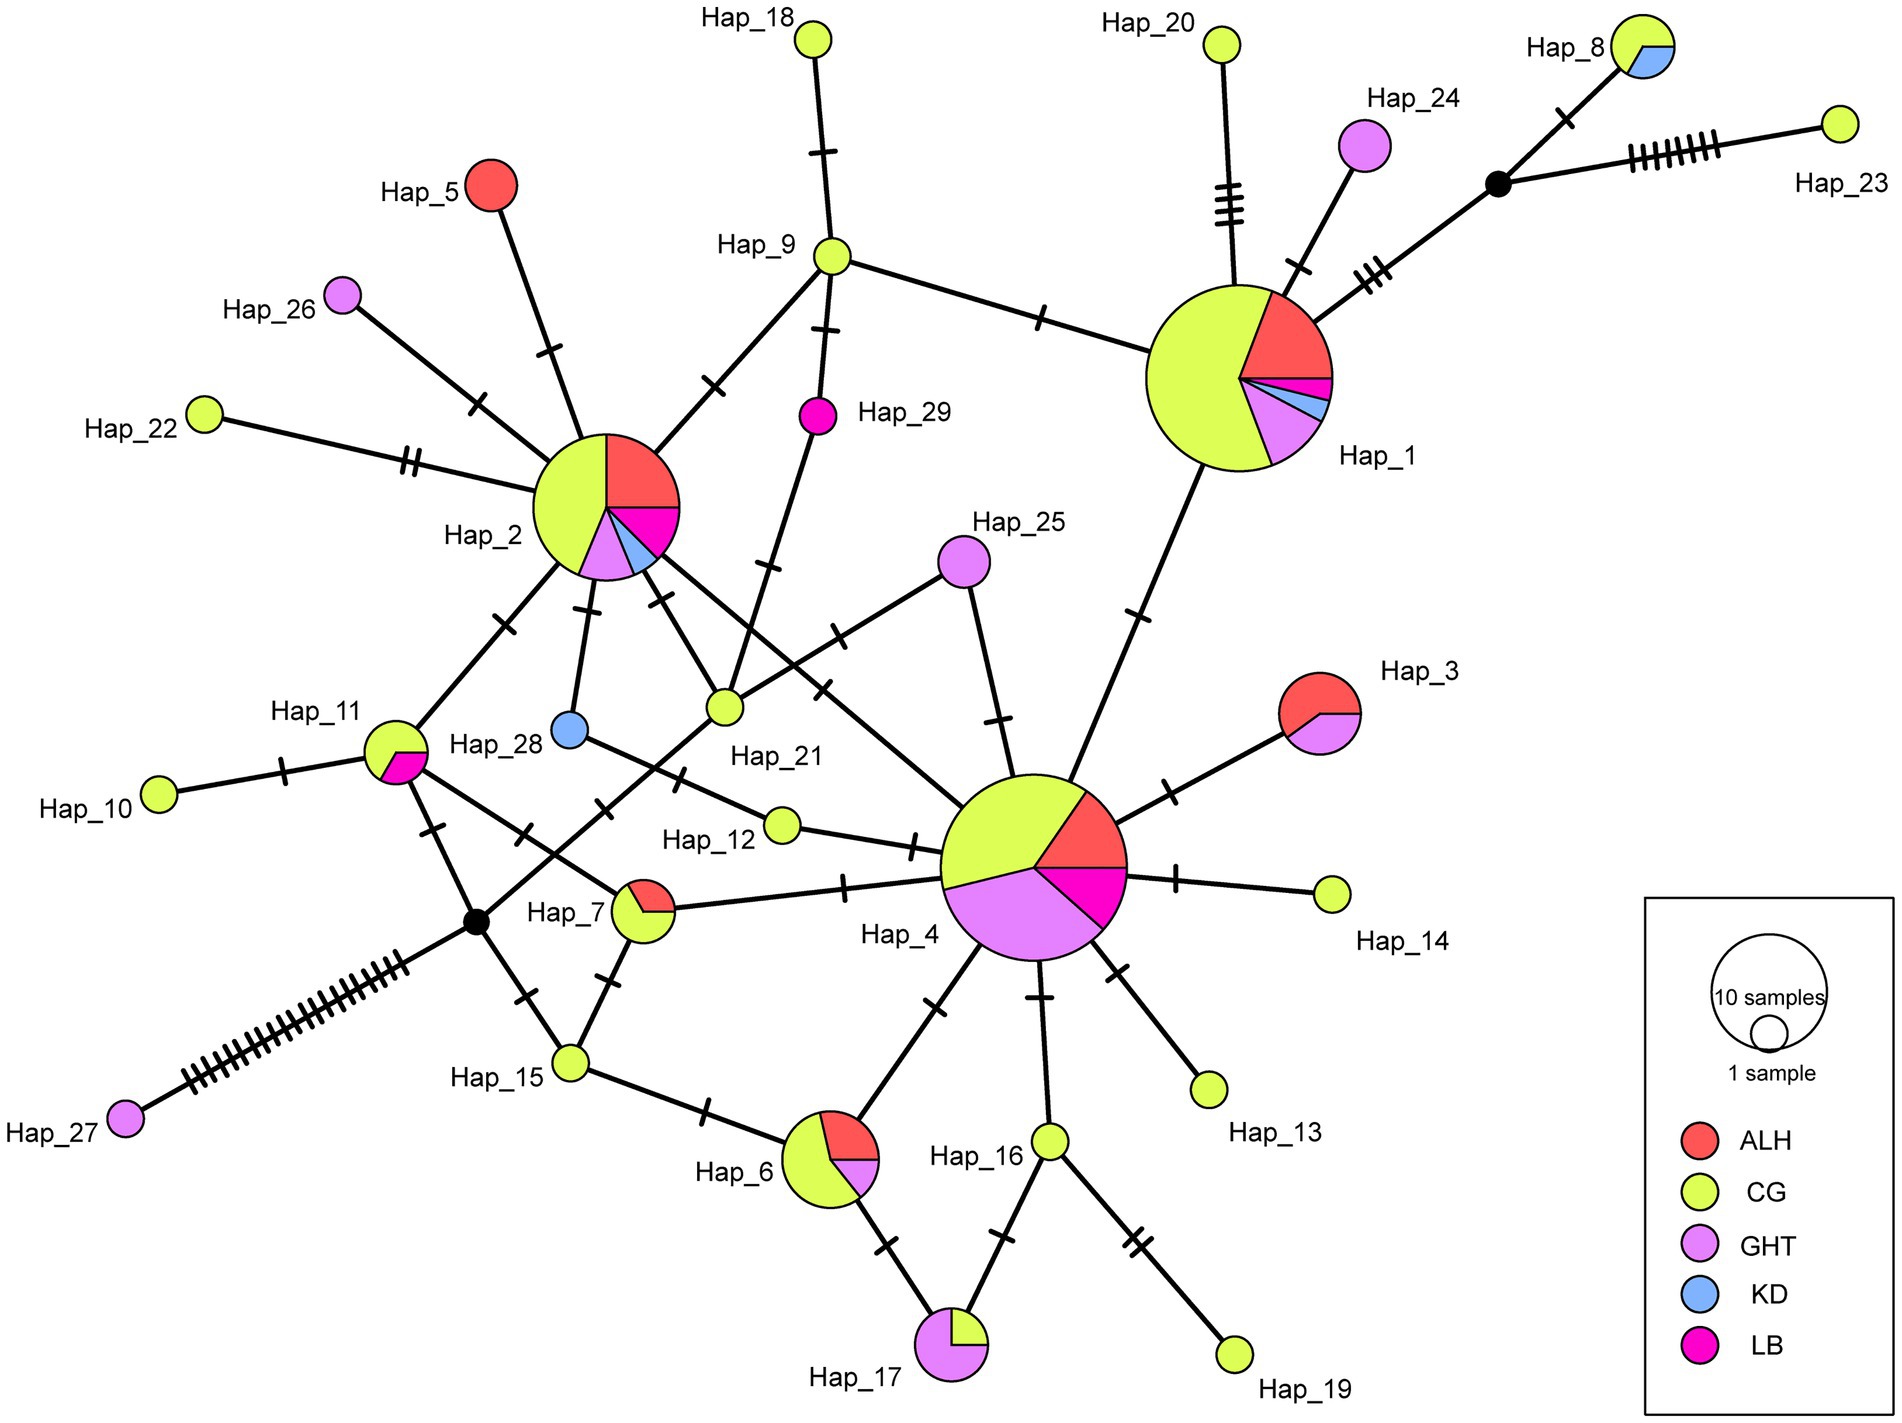
Figure 2. Statistical parsimony (TCS) network for the five local populations of Jankowski’s Bunting. The size of the circle is proportional to the frequency of each sampled haplotype. Every mutation is marked with a bar.
The results of the genetic structure analyses, which were run to investigate the optimal population structure and eventual admixture patterns among the five local populations, are shown in Figure 3. The optimal K value was determined to be 3 by ΔK method (Figure 3B). No clear signals of subdivided populations were observed, either at the optimal K value (K = 3), or at the second (K = 2) or third (K = 6) most probable K values, indicating a high genetic homogeneity of the five local populations.
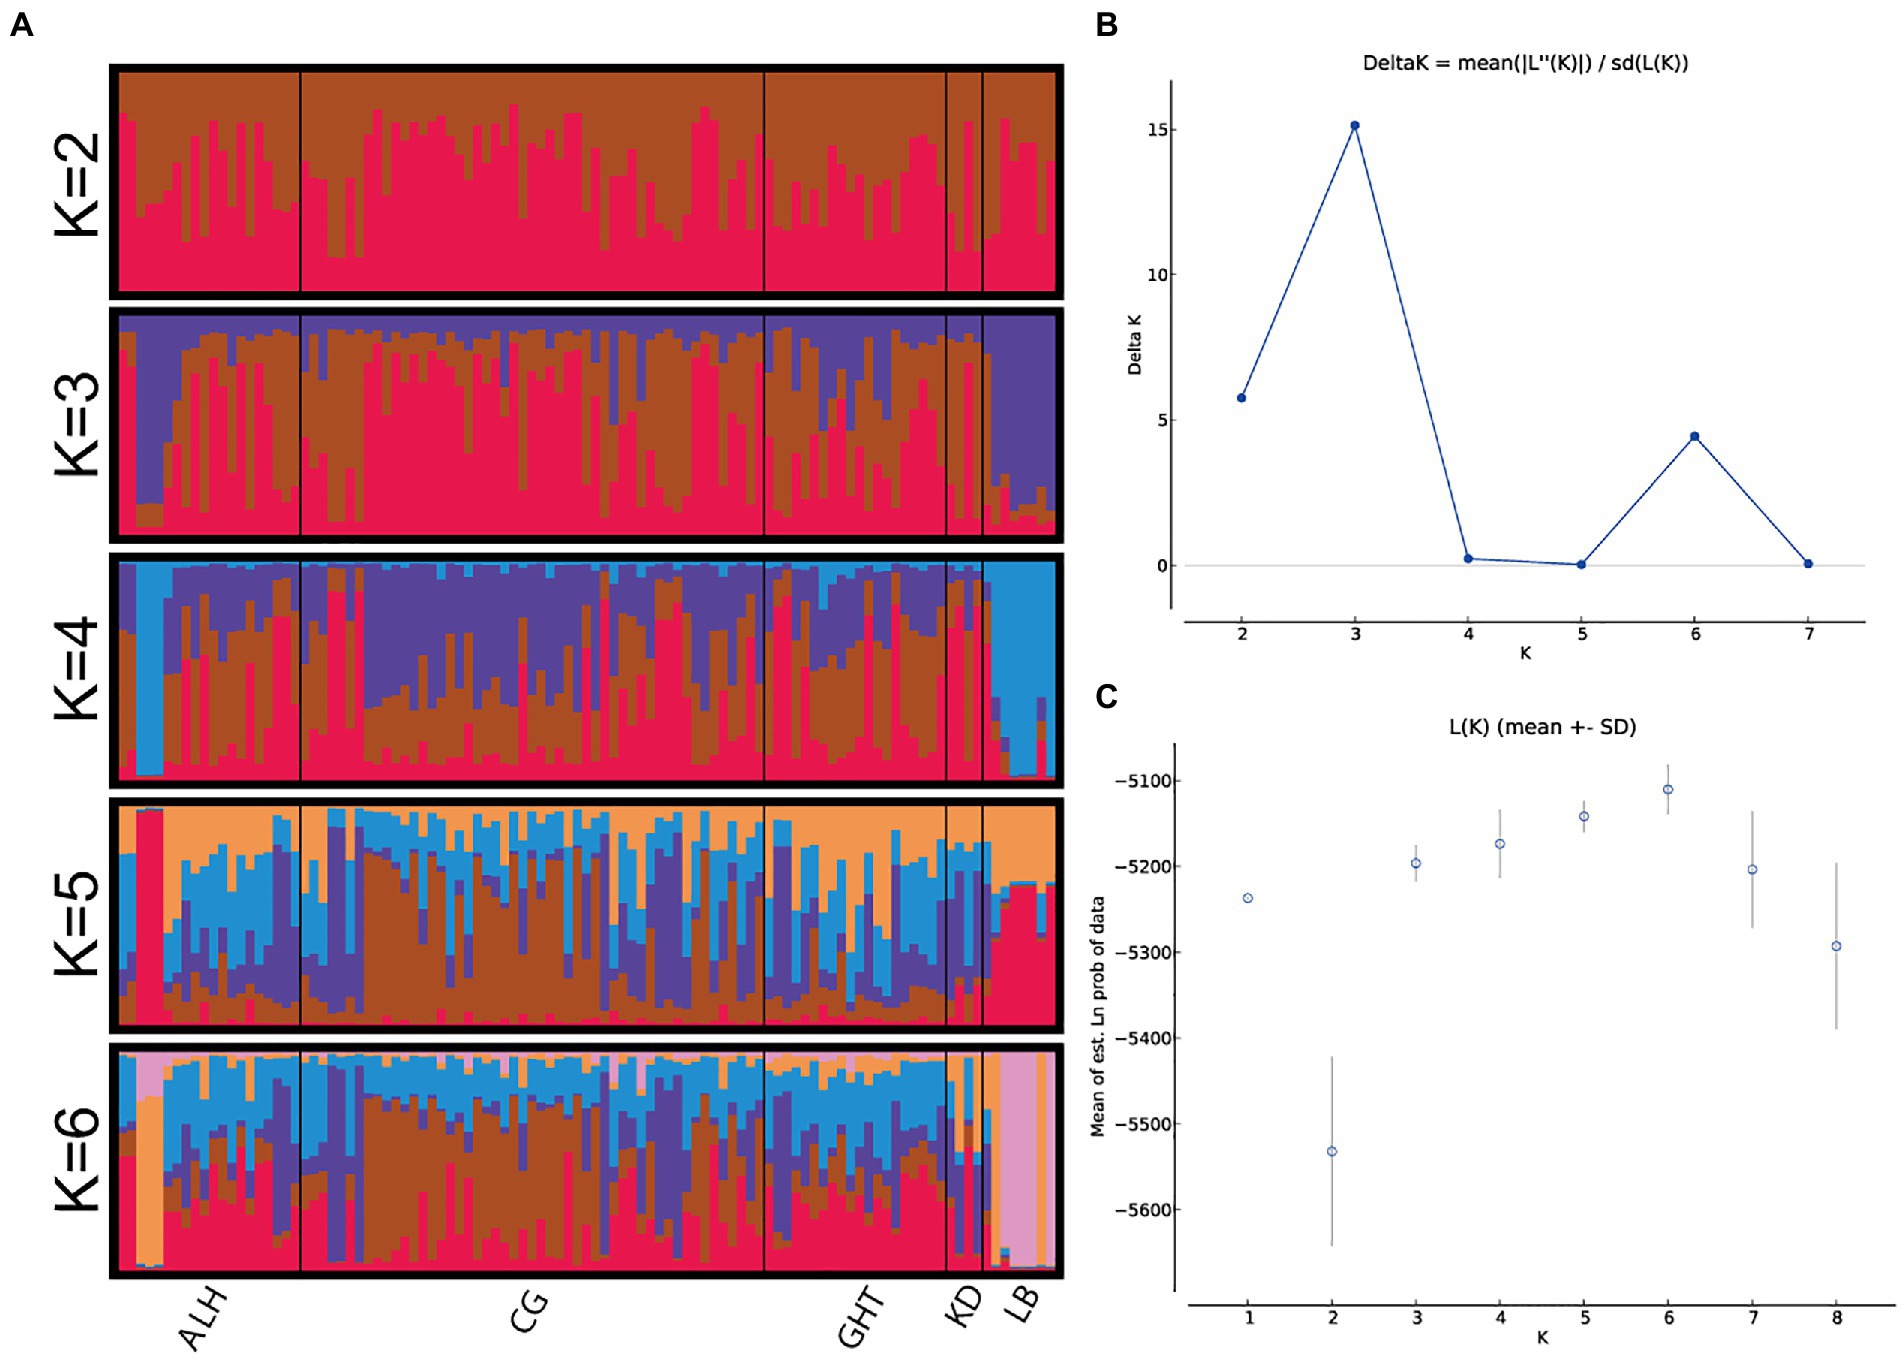
Figure 3. Bayesian STRUCTURE clustering results for Jankowski’s Bunting based on 15 microsatellite loci. (A) STRUCTURE output of different genetic clusters identified (showed only K = 2–6). The proportions of ancestry assigned to different clusters were plotted by individuals. Each column (representing the individual) is divided into K segments of different colors, whose length is proportional to its membership in the corresponding genetic cluster. (B) Inference of optimum K value. Changes in the log-likelihood, ΔK, for the different numbers of groups. (C) log-likelihood, LnP(D).
The test for population differentiation, as a clearer quantitative description, became a powerful complement to the STRUCTURE analysis. The Analysis of Molecular Variance and F-statistics results for the metapopulation are presented in Table 2. Regardless of the marker type, most of the genetic variation observed at the population level could be attributed to “within populations” rather than “among populations.” Variation among populations accounted for less than 5% of the total variation. The above results suggested that the five local populations present extremely limited genetic differentiation and should be considered as a whole.
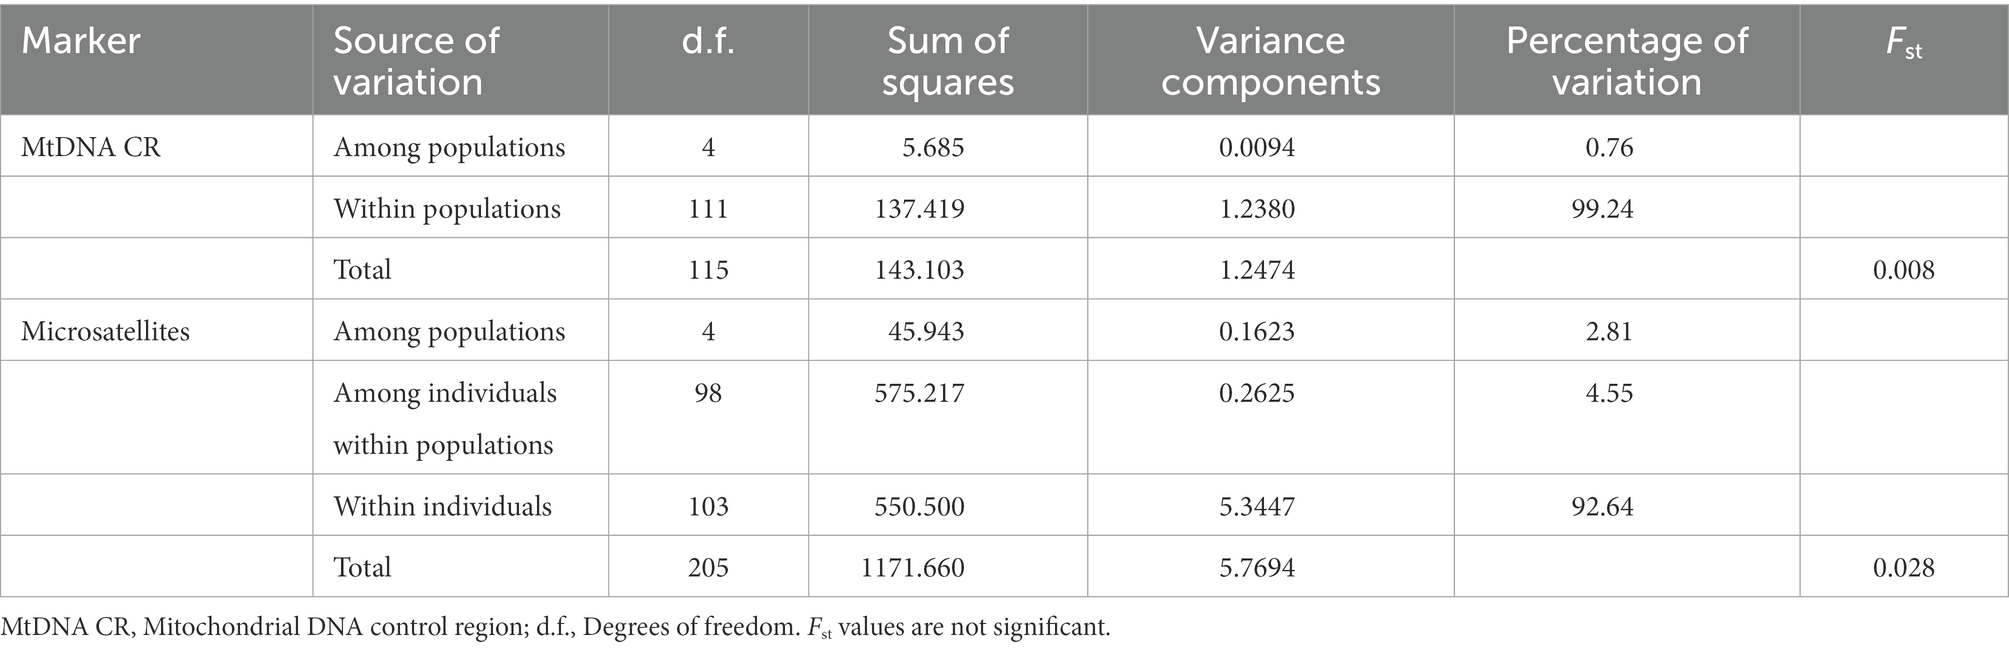
Table 2. Analysis of molecular variance and Fst for the five local populations of Jankowski’s Bunting.
The Mantel test revealed no significant correlation between genetic and geographic distance (r = −0.265, P (rxy-rand ≥ rxy-data) = 0.309) among the five local populations (Supplementary Figure 1), although the linear distance between the two most distant populations was more than 137 km.
Comparison of historical and contemporary gene flow
High gene flow is often associated with low differentiation among populations. Except for the low historical gene flow (Nm) of 0.178 from KD to GHT, we found relatively high values between the remaining population pairs (Table 3; Wright, 1978). According to the results of BayesAss, the proportion of individuals derived from other populations in each local population exceeded 0.25, implying considerable gene flow among populations (Table 3). Comparisons of historical and contemporary migration rates revealed a slight decrease in gene flow for most population pairs (Figure 4). Nevertheless, the distribution of the difference between the historical and contemporary migration rates was centered on zero (Supplementary Figure 2). Although immigration is secondary dominant over local retention in all habitat patches (local populations) as indicated by Table 3 and Figure 4, large-scale and asymmetric gene flow has occurred between local populations during the ancient and recent history. Migration rates among some populations may be underestimated due to the limited sample size, but overall, past landscape changes seem to not have resulted in severely limited population connectivity.
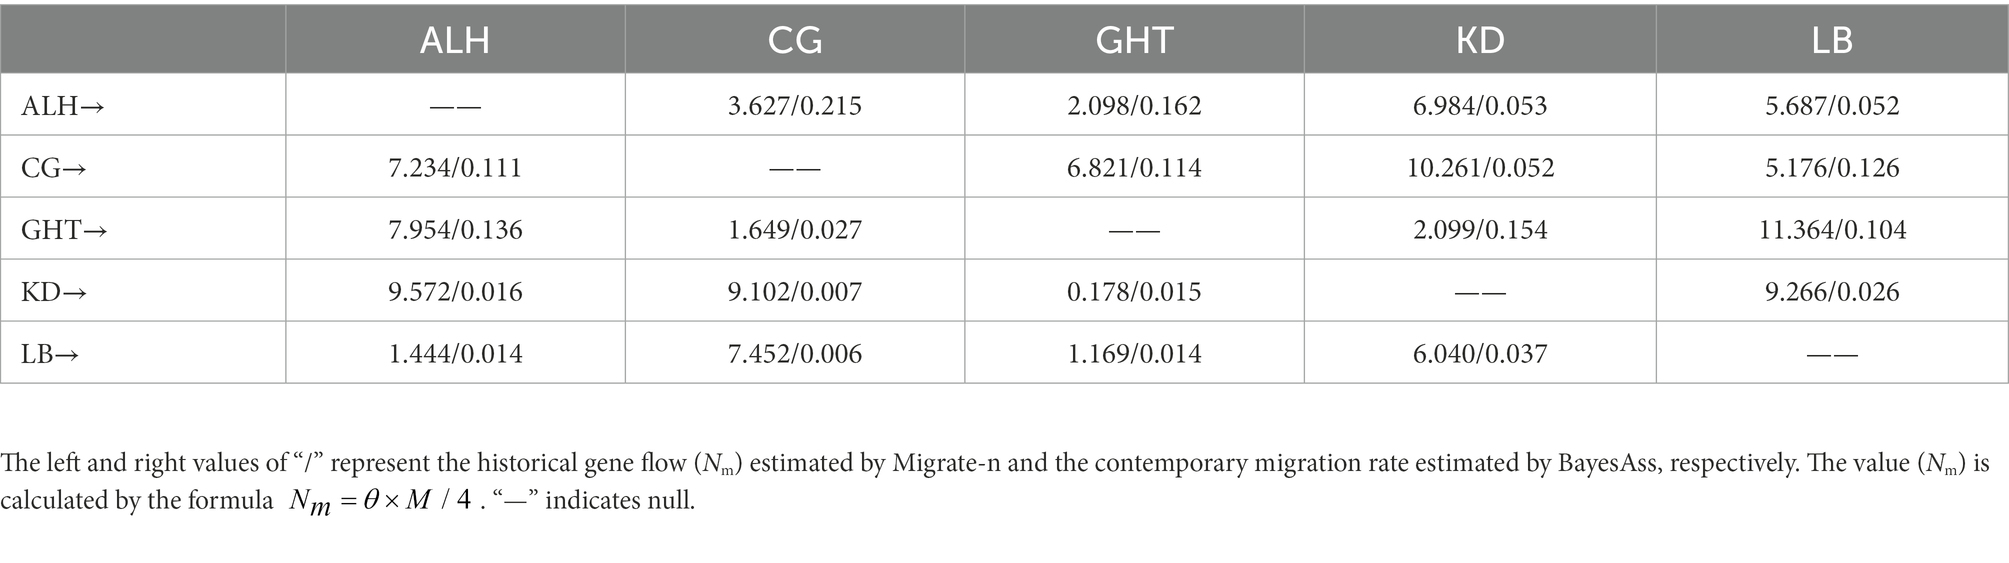
Table 3. Estimation of historical and contemporary gene flow among the five local populations.
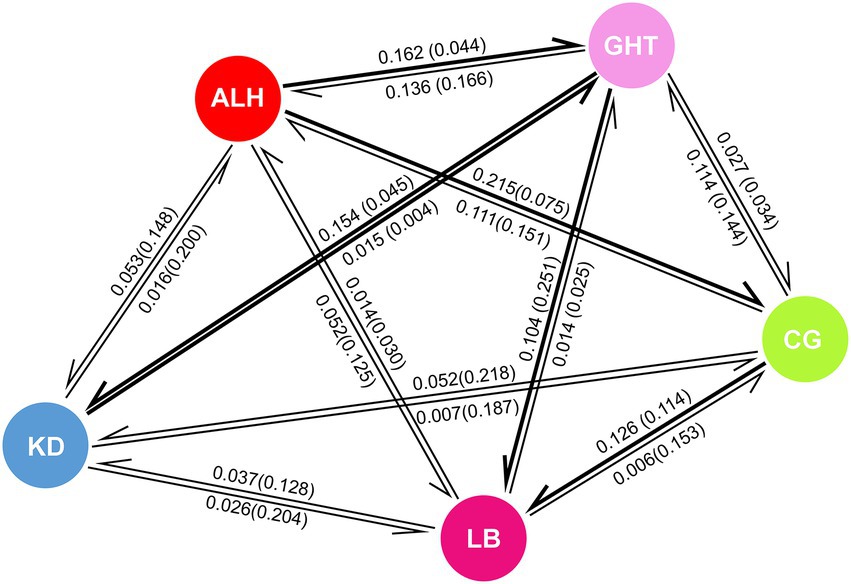
Figure 4. Comparison of historical and contemporary migration rates among five local populations. Numbers on arrows represent the proportion of migrated individuals in the original population, numbers in parentheses are historical values, and direction of arrows indicates direction of migration. Thick arrows indicate increases in contemporary migration compared to historical values, while thin arrows indicate decrease in contemporary migration.
Demographic history
Historical Ne for the metapopulation, based on the common mutation rate range of 10−3–10−4 and the average He of 0.762, was estimated to range from 800 to 20,818 (Table 4), while contemporary Ne using linkage disequilibrium, molecular coancestry, and temporal method was estimated to be 144, 27, and 115, respectively. This suggested that contemporary Ne was greatly reduced compared with the historical values.
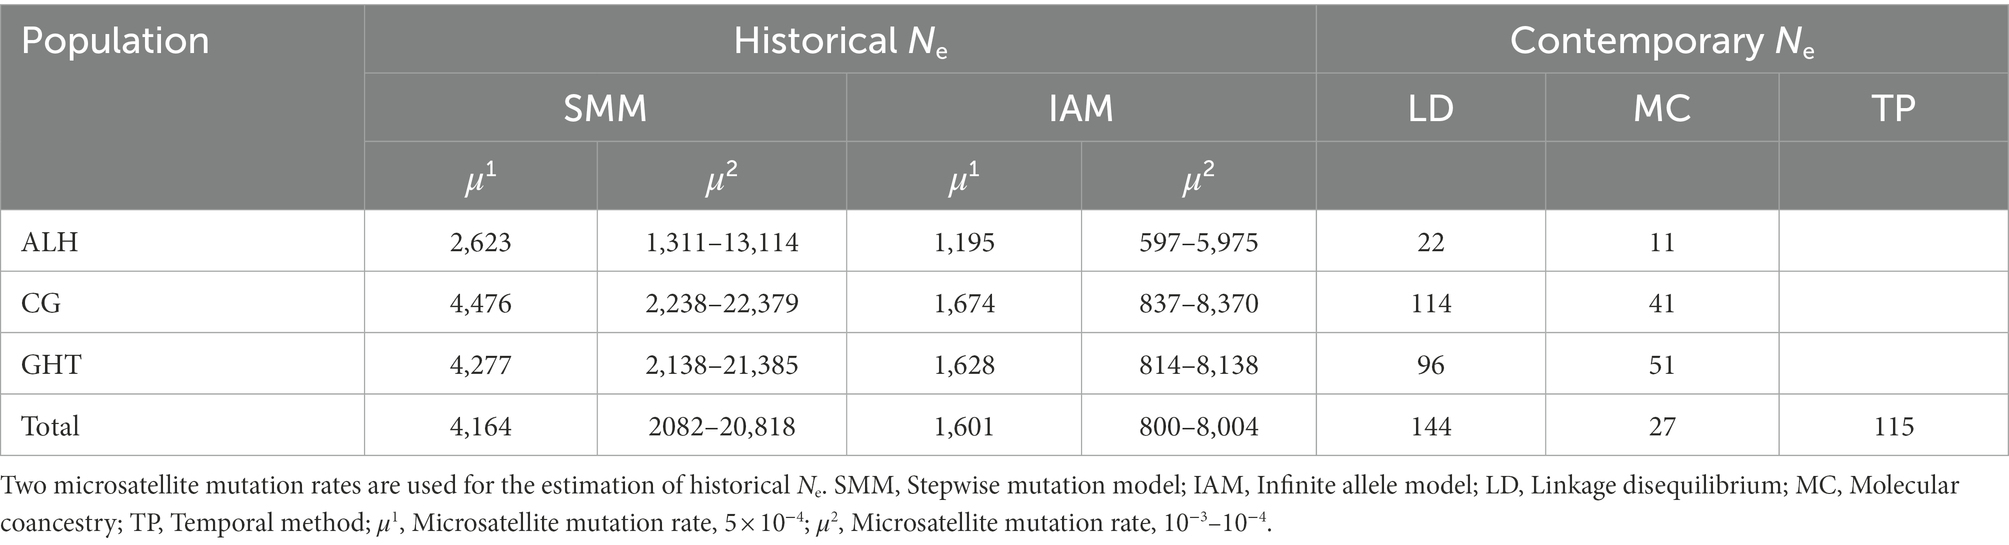
Table 4. Estimation of demographic parameters using different methods and mutation models.
We reconstructed the demographic history of the Jankowski’s Bunting population by analyzing for recent population expansions and bottlenecks. For the ALH population, the neutrality test showed no signal of demographic expansion; however, significant negative values (p < 0.05) of Tajima’s D and Fu’s Fs were observed in the metapopulation, implying that it did not deviate from the null hypothesis, i.e., the metapopulation may have experienced a recent expansion (Table 5). Moreover, the unimodal pattern of mismatch distribution also supported the inference of a population expansion (Supplementary Figure 3). The bimodal pattern of mismatch distribution occurred only in the GHT population, while the unimodal pattern was found in all the other local populations as well as in the metapopulation. The expansion time of the metapopulation based on the two mutation rates was estimated to be 0.021 and 0.158 Ma, respectively (Table 5). Analysis of recent demographic bottleneck, based on allele frequencies and heterozygosity, are shown in Table 6 and Supplementary Figure 4. The IAM, TPM, and SMM under the sign test showed heterozygosity deficiencies in 1, 8, and 12 loci, respectively. Both the sign test and Wilcoxon sign-rank test under the IAM showed a significant heterozygosity excess in the metapopulation (p < 0.05). The sign test under the SMM showed a significant heterozygosity excess; however, the Wilcoxon sign-rank test with stronger statistical power did not show a significant value for population bottleneck. The outcome for TPM, a model thought to be most consistent with microsatellite evolution, supported the absence of recent bottleneck in the Jankowski’s Bunting population, and the null hypothesis that the population was in mutation-drift equilibrium. The distribution patterns of allele frequencies can also be used to distinguish demographic stability from bottleneck events. Mode shift analysis showed a normal L-shaped distribution of allele frequencies (Supplementary Figure 4), indicating the absence of population bottlenecks.
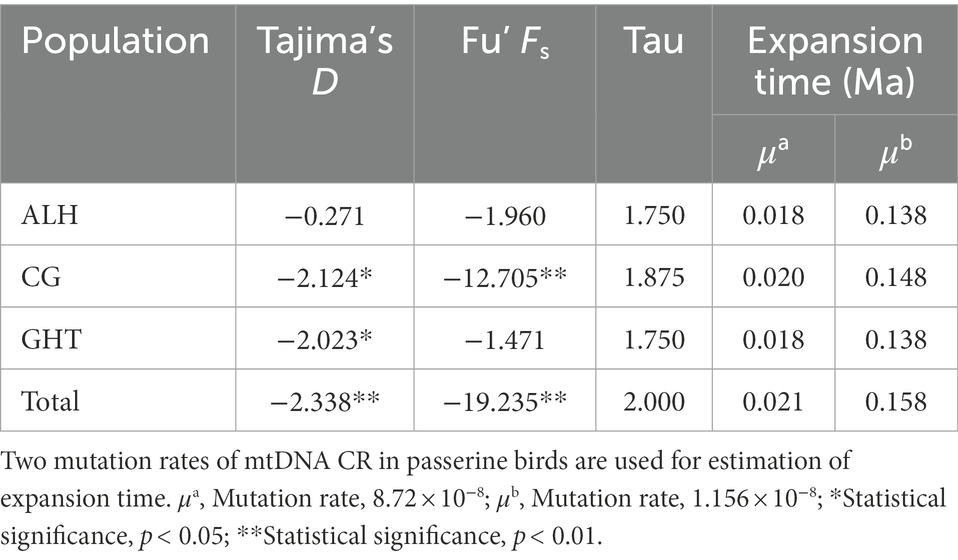
Table 5. Neutrality test and estimation of expansion time for Jankowski’s Bunting.
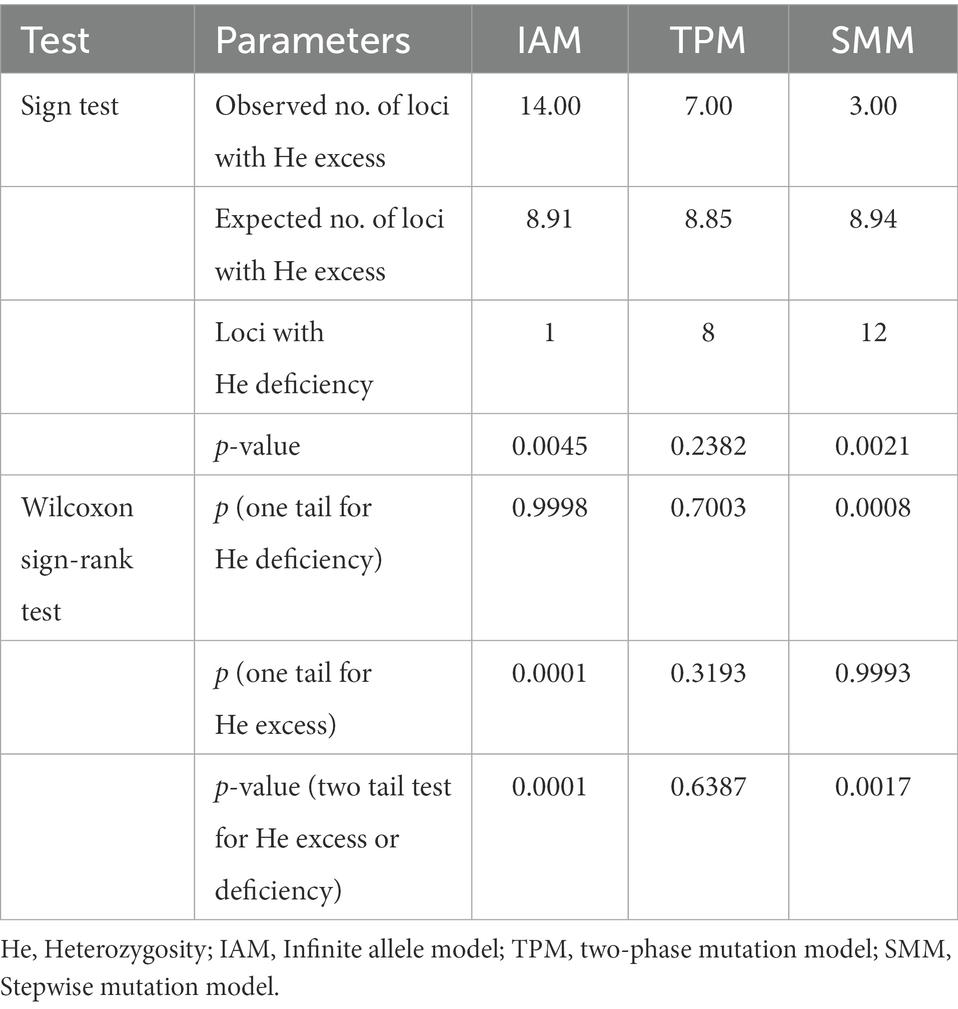
Table 6. Mutation-drift equilibrium and heterozygosity excess/deficiency under different mutation models for the Jankowski’s Bunting population.
The DIYABC analysis produced reliable results (Figures 5A, B). The pre-evaluation of scenario and parameter prior showed that the summary statistics of the observed dataset fell within the core distribution range of the simulated summary statistics under all scenarios (Supplementary Figure 5). A limited overlap between the 95% confidence interval of posterior probability for Scenario 6 and those for Scenario 3 was observed under direct estimation. Nevertheless, the posterior probability for Scenario 6 under direct estimate and logistic regression was 73.20 and 68.45%, respectively, which were much higher than the other scenarios (Figure 5B). In addition, the Type I error rate for Scenario 6 was relatively high (0.77). If Scenario 6 had been frequently selected when it was not the true scenario for simulated dataset (high Type II error rate), we could have little confidence in its selection for the observed dataset. However, the Type II error rate for Scenario 6 was consistently low (0.01–0.09), with an average of 0.05 (Supplementary Table 4), which provides great confidence that when Scenario 6 is chosen it is likely to be the truest of the proposed scenarios. Scenarios 1 and 7 had higher Type I error rate than Scenario 6, showing that they have lower power of detection. Scenarios 2, 3, 4, and 5 all showed lower Type I error rates than Scenario 6 but consistently high Type II error rates; thus, it could not be accepted with confidence if it had been selected as the true scenario. To sum up, Scenario 6, i.e., an old bottleneck followed by a recent expansion, was considered as the most likely scenario for the demographic dynamics of Jankowski’s Bunting. Posterior distributions of the demographic parameters drawn for Scenario 6 along with model checking are shown in Supplementary Figures 6, 7, respectively. All parameter estimates showed high RMedAD values (>0.2) and cannot be considered fully reliable (Supplementary Table 5). Our ABC demographic analysis estimated the initial Ne of the Jankowski’s Bunting population under Scenario 6 to be 8,270 (95% CI: 244–26,800; N4, see Supplementary Table 5). Results suggested that there was a bottleneck 5,746 (95% CI: 1,217-14,059) years ago (t2), resulting in the Ne decrease to 4,470 (95% CI: 755–8,650; N3). Subsequently, the Ne remained relatively stable until the expansion 238 (95% CI: 82–335) years ago (t1). Although the estimated mean value of N1 (3,820) was slightly lower than that before expansion (N3), the actual value of N1 was still larger than that of N3 considering the high overlap of 95% confidence intervals and the priori constraint (N3 < N1) applied to the historical model.
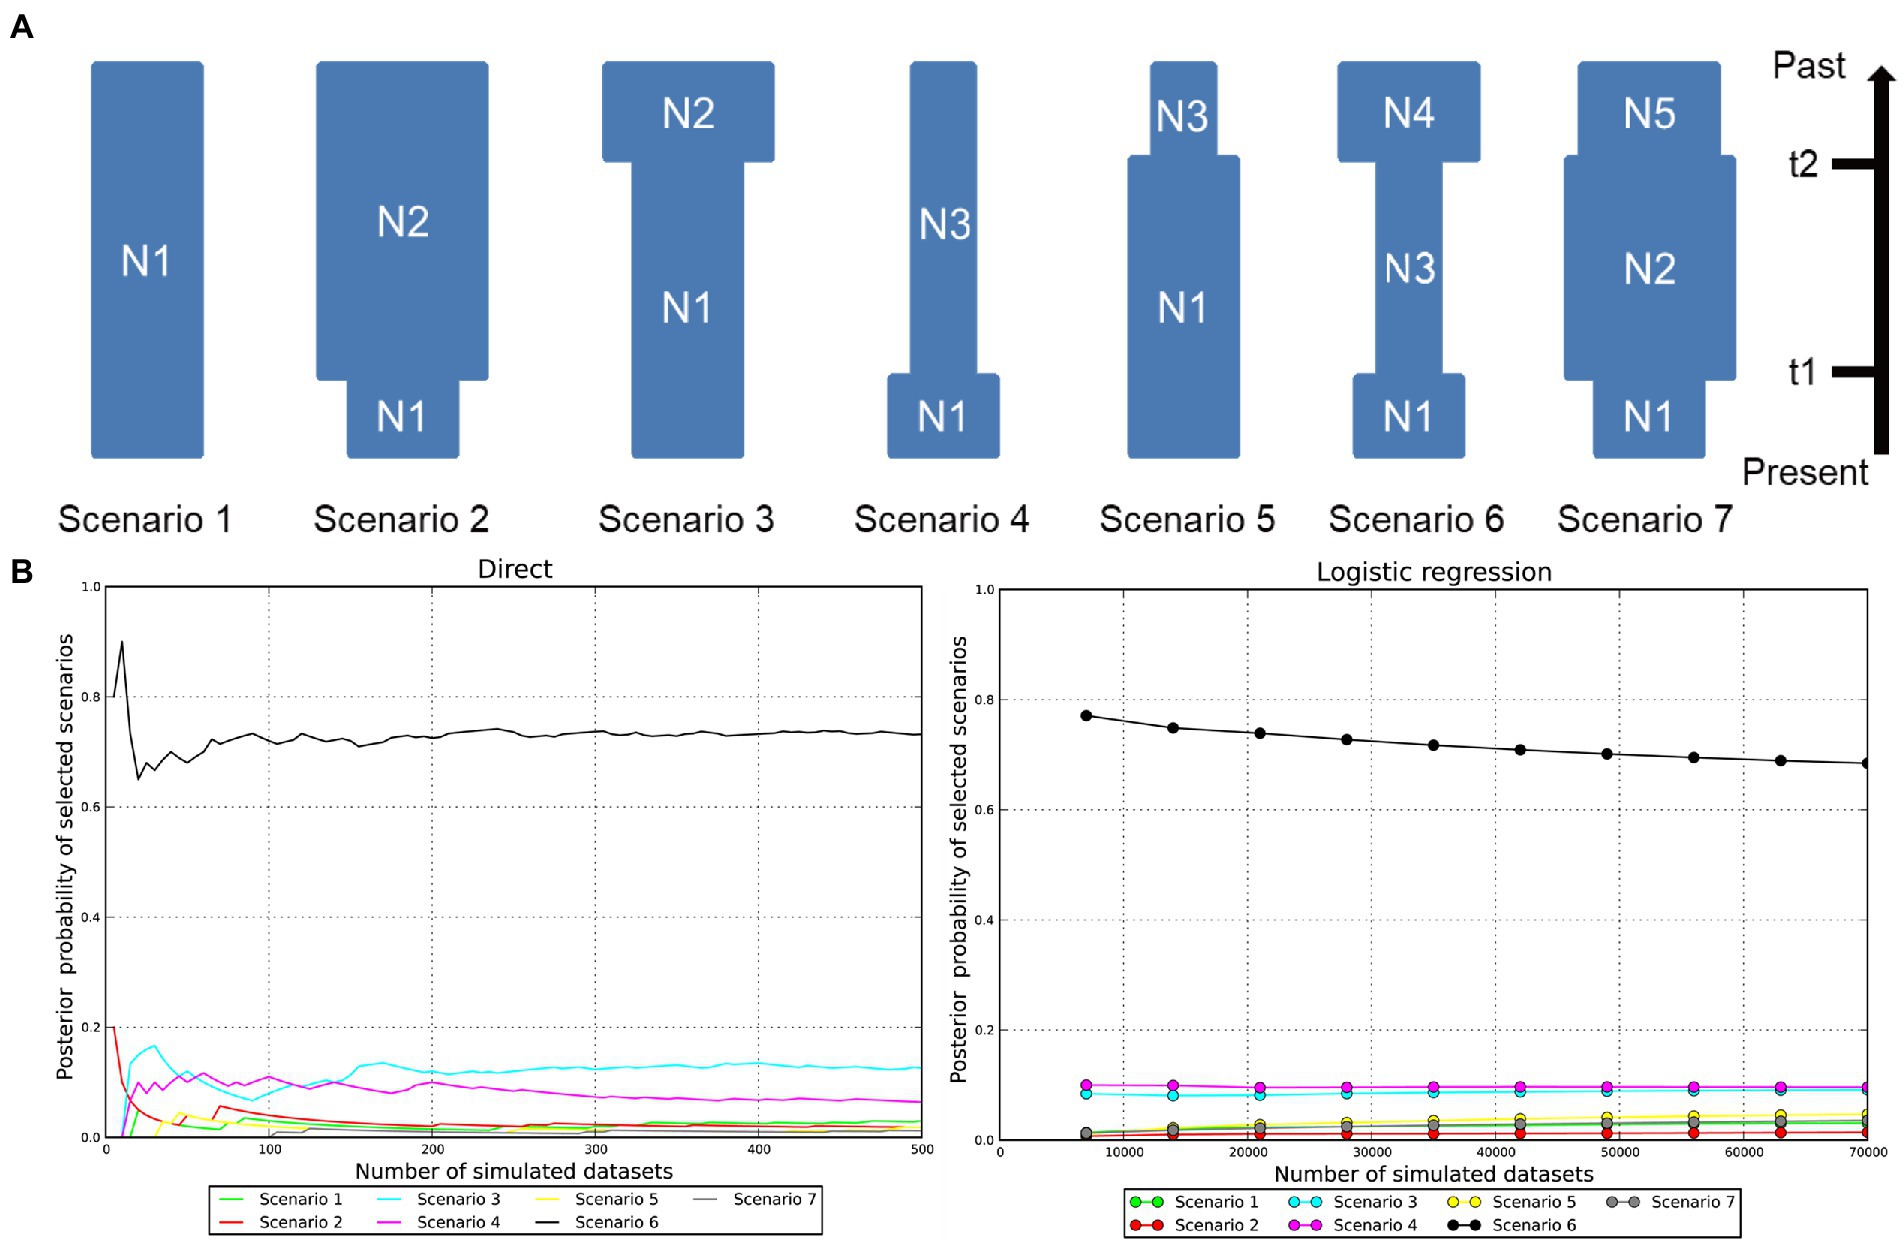
Figure 5. Inference of the plausible scenarios of demographic dynamics within Jankowski’s Bunting by DIYABC. (A) Seven possible scenarios previously defined without any prior information. Scenario 1: constant effective population size (N1); Scenario 2: a recent bottleneck (N2 to N1, t1); Scenario 3: an old bottleneck (N2 to N1, t2); Scenario 4: a recent expansion (N3 to N1, t1); Scenario 5: an old expansion (N3 to N1, t2); Scenario 6: an old bottleneck (N4 to N3, t2) followed by a recent expansion (N3 to N1, t1); Scenario 7: an old expansion (N5 to N2, t2) followed by a recent bottleneck (N2 to N1, t1). (B) The estimation of posterior probabilities under direct estimate and logistic regression for the seven tested scenarios.
Discussion
Unexpected high genetic diversity is found in threatened populations that have experienced recent devastating declines, prompting a conflict with the subconscious view under the neutral model of DNA evolution that small populations typically exhibit low genetic diversity (Kimura, 1983; Lippe et al., 2006; Torres-Florez et al., 2014; Zhang et al., 2015; Hoffmann et al., 2017). In wild populations, factors affecting genetic variation, such as population structure, demographic history, and inbreeding, often lead to the deviation of polymorphism patterns from neutral expectations and ultimately manifest as a lack of clear correspondence between genetic diversity and population size (Amos and Harwood, 1998). Although the Jankowski’s Bunting population is thought to have experienced a substantial decline over the past few decades, the present results reconfirm the high potential polymorphism in neutral regions of the genome in the recent past (Wang et al., 2011; Li et al., 2021; Huang et al., 2022). This “mismatch” pattern of population size and genetic diversity has been attributed to moderate historical dynamics, extensive gene flow between populations and time-lag effect of genetic response in many species, such as the copper redhorse (Moxostoma hubbsi), California sea lions (Zalophus californianus), Trinidadian guppies (Poecilia reticulata) and Chilean blue whales (Balaenoptera musculus; Lippe et al., 2006; Suárez et al., 2010; Torres-Florez et al., 2014; Fitzpatrick et al., 2016).
Demographic inferences from this study support our previous hypothesis (1) that large historical Ne and moderate demography contribute to rich contemporary genetic variation. The long-term Ne was estimated to range from 800 to 20,818, much higher than the contemporary estimate of 144 (LD method), indicating that Jankowski’s Bunting has experienced pronounced demographic decline. Nevertheless, no signals of population bottleneck were detected by classical estimators. Both the heterozygosity excess test and the mode-shift test prompted us to reject the hypothesis that the population has undergone a sharp decline. These suggested that the population decline may be moderate, and therefore less likely to be imprinted in the genome. Despite the lack of historical samples for genetic comparisons, the current high genetic diversity implied a limited genetic impact of population decline. A similar case is that the widespread New Zealand endemic Notiomystis cincta declined to a single remnant population following European colonization, however, high levels of historical population size, long generation times, random mating and absence of bottlenecks combined to maintain high genetic diversity (Brekke et al., 2011). We found an ancient demographic expansion based on the mismatch distribution of nucleotides and neutrality tests, with an estimated expansion time of 0.021 or 0.158 Ma. Uncertainty in mutation rate severely hindered the estimates of expansion time, but it is certain that this expansion occurred between the end of the penultimate glacial period (c. 0.17 Ma) and the last glacial period (c. 0.115 to c. 0.011 Ma). A similar pattern of population expansion since the penultimate glacial period was also found in the greater horseshoe bat (Rhinolophus ferrumequinum) in Northeast Asia, the black-spotted frog (Pelophylax nigromaculata) and the Chinese Hwamei (Leucodioptron canorum canorum) in East Asia (Zhang et al., 2008; Li et al., 2009; Liu et al., 2016). Among them, the Korean and Japanese populations of the greater horseshoe bat in Northeast Asia expanded at 0.12 Ma (Eemian interglaciation) and 0.15 Ma (Saale glaciation), respectively (Liu et al., 2016). Actually, the most pronounced pattern observed in many species was a severe reduction in Ne coinciding with the beginning of glacial period (Nadachowska-Brzyska et al., 2015). The different demographic pattern we observed may be related to the distinct geological history of Northeast Asia. The expansion time we inferred span the last interglacial period (c. 0.13 to 0.115 Ma) accompanied by global warming (Montoya, 2014). During this period, Northeast Asia was almost ice-free, and the relatively mild climate provided the necessary conditions for population expansion (Wei et al., 2006). This scenario may have shaped the demographic processes and geographic distribution patterns of native species, which differ from those of European and North American species (Wang et al., 2013). Existence of glacial refuges in Northeast Asia may explain the moderate demography of Jankowski’s Bunting (Ye et al., 2019; Lee et al., 2021). In addition, although the climate has gradually cooled since the last glacial period, the grasslands in Northeast China have expanded rapidly in the last glacial maximum, which may provide additional suitable habitat for Jankowski’s Bunting (Li X. et al., 2019). Shrubs and herbs, especially the genus Stipa, became the dominant vegetation in Inner Mongolia during this period (Sun, 1992), which may be related to the population stability and habitat preference of Jankowski’s Bunting. The stronger drought tolerance compared with forest birds may have improved the fitness of Jankowski’s Bunting during the late Pleistocene, which contributes to the similar demographic response with the Chinese Hwamei to the cold period (stadials; Li et al., 2009).
The ABC analysis provided new insights into our inferences on the recent demographic history. The optimal model revealed a historical bottleneck, but the confidence interval for the expansion time (t2) was rather wide. We focused our attention on population dynamics over the last hundred years since the Industrial Revolution. Historical records showed that the habitat of Jankowski’s Bunting has been severely damaged by fire, farmland reclamation, grazing, and development projects over the past few decades (Jiang et al., 2008; Wang et al., 2011). In addition, parasitism and nest predation, which seriously impede reproductive success, have also been observed in field investigations (Zhang et al., 2020). However, consistent with the classical bottleneck tests, we still found no recent declines during periods of dramatic habitat change (t1; 95% CI: 82–335 years ago). The constant Ne in the simulated scenarios is not always interpreted as population stability, as the population decline may be so slow that it cannot become a bottleneck. Given the significant difference between historical and contemporary Ne, the probability of population size remaining stable in the recent past appears to be quite low or, more likely, that the recent population decline could have occurred gradually. After the expansion of Jankowski’s Bunting population at t1, there may have been a slight decline that was not enough to become a bottleneck. Taking the above results together, we believe that a large historical Ne and moderate demographic decline without recent bottlenecks contribute to the formation and maintenance of high genetic diversity in Jankowski’s Bunting. A major concern with inferring demographic factors from genetic data, however, is the time-lag effect of genetic responses to environmental changes in some species (Bailleul et al., 2018; Aavik et al., 2019). The bottleneck-induced heterozygosity excess would persist for 0.2 to 4.0 Ne generations until the equilibrium between mutation and drift is re-established (Luikart and Cornuet, 1998). For the Jankowski’s Bunting population, with an estimated contemporary Ne of 144 (LD method) and a generation time of 1.7 years, a new equilibrium can be established after 28.8 to 576 generations, i.e., 48.96 to 979.2 years. Consequently, any loss of genetic variation may only be detectable after a longer period, which means that the existence of recent bottlenecks cannot be completely denied.
The possible consequences of habitat loss, degradation, and fragmentation caused by human disturbance are genetic isolation, loss of genetic variation, and the extinction of local populations (Lindsay et al., 2008; Segelbacher et al., 2008). Evolutionary processes over historical timescales (earlier than human influence), together with direct effects of habitat change, account for the observed genetic structure (Keyghobadi, 2007; Vandergast et al., 2007; Hansen et al., 2009; Pavlacky et al., 2009). Due to the lack of samples spanning large time scales, we only quantified and compared historical and contemporary gene flow to obtain a dynamic view of population connectivity and genetic structure. The absence of genetic structure, extremely low proportion of interpopulation variation, and high gene flow indicated good connectivity among local populations. Together, the five local populations constitute a large gene pool that may effectively buffer against loss of genetic variation. In addition, the fine-scale geographic analysis suggested that geographic distance is not the dominant factor affecting the current distribution pattern of genetic variation. Considering the high spatial dispersal capacity and wintering dynamics of Jankowski’s Bunting, we suggested that distance-dependent population differentiation caused by habitat fragmentation may be attenuated, or even counteracted, by gene flow between populations. Numerous traditional studies have attempted to reveal the impact of recent human-induced landscape changes by comparing historical and contemporary genetic connectivity (Chiucchi and Gibbs, 2010; Li et al., 2017; Austin et al., 2022). Although our results reveal a relatively high population connectivity, there is a concern that direct comparisons of gene flow across different timescales may lead to the underestimation of changes in genetic connectivity (Samarasin et al., 2017). Therefore, the population connectivity in Jankowski’s Bunting may have experienced a more severe decline over the recent past than is currently observed. Even so, such high contemporary gene flow implied a rather limited impact of habitat change on population connectivity.
During the process of long-term evolution, the combined effects of multiple evolutionary forces, including mutation, natural selection, and gene flow, can account for the current state of genetic variation in species (Jones et al., 2013; Hague and Routman, 2016). As an important complement to genetic resources, gene introgression from the sympatric related species Meadow Bunting (Emberiza cioides) may contribute to the genetic stability of the Jankowski’s Bunting population, although the genetic impact of introgressive hybridization may not be as significant as expected (Huang et al., 2022). In addition, the long-distance dispersal activity of Jankowski’s Bunting during the non-breeding season suggests that unknown parapatric (e.g., Mongolian) populations may also serve as potential genetic reservoirs. Currently, it is difficult to clearly measure and compare the relative effects of various evolutionary forces in the absence of sufficient information. Combined analysis of samples in different years may cause some confusion in the inference of recent demography, e.g., repeated capture of individuals in the same nest may lead to the overestimation of specific genotype frequency. However, compared with the evolution history, the time span of our sampling is obviously quite short, so we can almost regard it as a single time sampling. Our study failed to reveal details of the population history, which may be attributed to the fact that the limited number of molecular markers and sample size did not adequately resolve the information contained in the genome. Furthermore, the high RMedAD value, which represents the low accuracy of parameter estimates, may lead to the confusion of our understanding on true history. Despite these drawbacks, we believe that our study provides valuable insights to understand the recent history of Jankowski’s Bunting. Genome-based Markovian coalescent analysis and single nucleotide polymorphism markers generated by reduced representation sequencing may improve our ability to address these problems.
Although species with short generation times and small Ne are expected to be more sensitive to habitat fragmentation, the time-lag effect on genetic responses cannot be denied (Varvio et al., 1986; Keyghobadi, 2007). In addition, a human-induced bottleneck that occurs over a sufficient time span would result in a significant loss of heterozygosity, while recent anthropogenic effects may not be sufficient to cause observable genetic changes (Nei et al., 1975; Hughes, 2010). Therefore, recent or current population genetic characteristics should be treated with caution in conservation management, as observed levels and spatial patterns of genetic diversity may reflect historic rather than contemporary conditions. Our study highlighted the necessity of temporal genetic monitoring. The contemporary high genetic diversity does not equate to evolutionary health. Factors such as the current state of genetic variation, population history, life history, and ecological traits should be integrated into a systematic framework to generate a robust assessment of population health. In recent years, a series of grassland restoration projects have been implemented that, to some extent, have compensated for the loss of suitable habitat (Han et al., 2017). Even with the high genetic diversity and gene flow, we are not optimistic about the survival of Jankowski’s Bunting populations, considering inbreeding, genetic load, ecological specialization, and the small Ne that do not meet the widely accepted long-term genetic viability target (Ne ≥ 500) (Franklin, 1980; Jamieson and Allendorf, 2012; Laikre et al., 2016). Subsequent conservation efforts should remain focused on the protection of grassland habitats to promote population survival and continuation. Due to high genetic connectivity and absence of genetic structure, the five local populations in this study can be regarded as a genetic unit for regular census and genetic monitoring. Nonbreeding seasons and non-invasive methods, such as feces and feather sampling, are preferred in genetic sampling. Considering that the habitat of Jankowski’s Bunting is relatively fragmented, multiple small reserves should be established to achieve refined protection, but also to construct ecological corridors to reduce inbreeding. Furthermore, to explore the future population dynamics and implement reintroduction (ex situ conservation) programs, it is necessary to use systematic geographical research methods, such as ecological niche modeling, and a combination of historical and contemporary climate information to predict potentially suitable habitats.
Data availability statement
The datasets presented in this study can be found in online repositories. The names of the repository/repositories and accession number(s) can be found below: Genbank Bank: OP435804-OP435919.
Ethics statement
The animal study was reviewed and approved by Ethics Committee of Jilin Agriculture University.
Author contributions
LH conceived and designed the experiments, carried out the molecular genetic analysis, participated in the manuscript’s design, and drafted the manuscript. SL and YJ developed the ideas and obtained funding support. LZ and RY helped to collect samples and classify species. GF, WS, and DL helped to perform the microsatellite experiments. All authors contributed to the article and approved the submitted version.
Funding
This work was supported by the National Natural Science Foundation of China (grant nos. 31601856 and 31670398).
Acknowledgments
The authors would like to thank everyone contributing with samples for this study. Xue Zhang and Yufei Cui are especially acknowledged for their support in the field. We thank Suzanne Leech, from Liwen Bianji, Edanz Editing China (www.liwenbianji.cn/ac), for editing the English text of a draft of this manuscript. Lastly, we thank the financial support from the National Natural Science Foundation of China. The content of the manuscript has previously appeared in a preprint online.
Conflict of interest
The authors declare that the research was conducted in the absence of any commercial or financial relationships that could be construed as a potential conflict of interest.
Publisher’s note
All claims expressed in this article are solely those of the authors and do not necessarily represent those of their affiliated organizations, or those of the publisher, the editors and the reviewers. Any product that may be evaluated in this article, or claim that may be made by its manufacturer, is not guaranteed or endorsed by the publisher.
Supplementary material
The Supplementary material for this article can be found online at: https://www.frontiersin.org/articles/10.3389/fevo.2022.996617/full#supplementary-material
SUPPLEMENTARY FIGURE 1 | Correlation between genetic (Codom genotypic genetic distance matrix) and geographic distances of five local populations inferred by Mantel test.
SUPPLEMENTARY FIGURE 2 | Distribution of differences between historical and contemporary migration rates for population comparisons (mc-mh). The contemporary migration rate (mc) is calculated by BayesAss, while the historical migration rate (mh) is derived from Migrate-n.
SUPPLEMENTARY FIGURE 3 | Mismatch distribution analyses of Jankowski’s Bunting for mtDNA control region under constant population size model. (A) Metapopulation; (B) ALH population; (C) CG population; (D) GHT population.
SUPPLEMENTARY FIGURE 4 | Mode shift analysis based on allele frequency distribution in Jankowski’s Bunting. (A) Metapopulation; (B) ALH population; (C) CG population; (D) GHT population.
SUPPLEMENTARY FIGURE 5 | Fit of observed data to models defined using ABC analysis. The principal component analysis was generated from 7,000,000 summary statistics from simulations, using prior distributions of historical parameters: open circles are simulated data sets, generated using prior distributions of historical parameters; closed yellow circle is the observed data set.
SUPPLEMENTARY FIGURE 6 | Posterior distributions of the demographic parameters drawn for Scenario 6. N1, recent effective population size; t1, recent population expansion/bottleneck time; t2, ancestral population expansion/bottleneck time; N3, effective population size before expansion; N4, effective population size before bottleneck.
SUPPLEMENTARY FIGURE 7 | Model checking by applying a PCA on the optimal scenario (Scenario 6) in DIYABC analysis. Summary statistics, based on 10,000 simulations, visualize the fit between the simulated and the observed datasets.
SUPPLEMENTARY TABLE 6 | Raw data of microsatellite genotype. The numbers in the table indicate the length of alleles.
Abbreviations
ABC, Approximate Bayesian computation; BSP, Bayesian skyline plot; CR, Control region; HWE, Hardy–Weinberg equilibrium; IAM, Infinite allele model; LD, Linkage disequilibrium; SMM, Stepwise mutation model; TPM, Two-phase mutation model.
References
Aavik, T., Thetloff, M., Träger, S., Hernández-Agramonte, I. M., Reinula, I., and Pärtel, M. (2019). Delayed and immediate effects of habitat loss on the genetic diversity of the grassland plant Trifolium montanum. Biodivers. Conserv. 28, 3299–3319. doi: 10.1007/s10531-019-01822-8
Amos, W., and Harwood, J. (1998). Factors affecting levels of genetic diversity in natural populations. Philos. Trans. R. Soc. Lond. Biol. Sci. 353, 177–186. doi: 10.1098/rstb.1998.0200
Austin, J. D., Gore, J. A., Hargrove, J. S., de Torrez, E. C. B., Carneiro, C. M., Ridgley, F. N., et al. (2022). Strong population genetic structure and cryptic diversity in the Florida bonneted bat (Eumops floridanus). Conserv. Genet. 23, 495–512. doi: 10.1007/s10592-022-01432-y
Bagley, M., Lindquist, D. G., and Geller, J. B. (1999). Microsatellite variation, effective population size, and population genetic structure of vermilion snapper, Rhomboplites aurorubens, off the southeastern USA. Mar. Biol. 134, 609–620. doi: 10.1007/s002270050576
Bailleul, D., Mackenzie, A., Sacchi, O., Poisson, F., Bierne, N., and Arnaud-Haond, S. (2018). Large-scale genetic panmixia in the blue shark (Prionace glauca): a single worldwide population, or a genetic lag-time effect of the "grey zone" of differentiation? Evol. Appl. 11, 614–630. doi: 10.1111/eva.12591
Basiita, R. K., Zenger, K. R., and Jerry, D. R. (2017). Populations genetically rifting within a complex geological system: the case of strong structure and low genetic diversity in the migratory freshwater catfish, Bagrus docmak, in East Africa. Ecol. Evol. 7, 6172–6187. doi: 10.1002/ece3.3153
Beerli, P. (2006). Comparison of Bayesian and maximum-likelihood inference of population genetic parameters. Bioinformatics 22, 341–345. doi: 10.1093/bioinformatics/bti803
Beier, P., Majka, D. R., and Spencer, W. D. (2008). Forks in the road: choices in procedures for designing wildland linkages. Conserv. Biol. 22, 836–851. doi: 10.1111/j.1523-1739.2008.00942.x
Brekke, P., Bennett, P. M., Santure, A. W., and Ewen, J. G. (2011). High genetic diversity in the remnant island population of hihi and the genetic consequences of re-introduction. Mol. Ecol. 20, 29–45. doi: 10.1111/j.1365-294X.2010.04923.x
Cabanne, G. S., Santos, F. R., and Miyaki, C. Y. (2007). Phylogeography of Xiphorhynchus fuscus (Passeriformes, Dendrocolaptidae): vicariance and recent demographic expansion in southern Atlantic forest. Biol. J. Linn. Soc. 91, 73–84. doi: 10.1111/j.1095-8312.2007.00775.x
Chao, X., Mujiao, H., Holt, P., Townshend, T., and Wielstra, B. J. B. A. (2016). First Jankowski’s buntings Emberiza jankowskii wintering in Beijing for 75 years. BirdingASIA, Vol. 25, 62–68.
Chapuis, M. P., and Estoup, A. (2007). Microsatellite null alleles and estimation of population differentiation. Mol. Biol. Evol. 24, 621–631. doi: 10.1093/molbev/msl191
Chiucchi, J. E., and Gibbs, H. L. (2010). Similarity of contemporary and historical gene flow among highly fragmented populations of an endangered rattlesnake. Mol. Ecol. 19, 5345–5358. doi: 10.1111/j.1365-294X.2010.04860.x
Cornuet, J. M., and Luikart, G. (1996). Description and power analysis of two tests for detecting recent population bottlenecks from allele frequency data. Genetics 144, 2001–2014. doi: 10.1093/genetics/144.4.2001
Cornuet, J. M., Pudlo, P., Veyssier, J., Dehne Garcia, A., Gautier, M., Leblois, R., et al. (2014). DIYABC v2.0: a software to make approximate Bayesian computation inferences about population history using single nucleotide polymorphism, DNA sequence and microsatellite data. Bioinformatics 30, 1187–1189. doi: 10.1093/bioinformatics/btt763
Cornuet, J. M., Santos, F., Beaumont, M. A., Robert, C. P., Marin, J. M., Balding, D. J., et al. (2008). Inferring population history with DIY ABC: a user-friendly approach to approximate Bayesian computation. Bioinformatics 24, 2713–2719. doi: 10.1093/bioinformatics/btn514
Dąbrowski, M. J., Bornelöv, S., Kruczyk, M., Baltzer, N., and Komorowski, J. (2015). 'True' null allele detection in microsatellite loci: a comparison of methods, assessment of difficulties and survey of possible improvements. Mol. Ecol. Resour. 15, 477–488. doi: 10.1111/1755-0998.12326
Depaulis, F., Mousset, S., and Veuille, M. (2003). Power of neutrality tests to detect bottlenecks and hitchhiking. J. Mol. Evol. 57, S190–S200. doi: 10.1007/s00239-003-0027-y
DeSilva, R., and Dodd, R. S. (2020). Fragmented and isolated: limited gene flow coupled with weak isolation by environment in the paleoendemic giant sequoia (Sequoiadendron giganteum). Am. J. Bot. 107, 45–55. doi: 10.1002/ajb2.1406
Di Rienzo, A., Peterson, A. C., Garza, J. C., Valdes, A. M., Slatkin, M., and Freimer, N. B. (1994). Mutational processes of simple-sequence repeat loci in human populations. Proc. Natl. Acad. Sci. U. S. A. 91, 3166–3170. doi: 10.1073/pnas.91.8.3166
Do, C., Waples, R. S., Peel, D., Macbeth, G. M., Tillett, B. J., and Ovenden, J. R. (2014). NeEstimator v2: re-implementation of software for the estimation of contemporary effective population size (Ne) from genetic data. Mol. Ecol. Resour. 14, 209–214. doi: 10.1111/1755-0998.12157
Dong, F., Hung, C. M., Li, X. L., Gao, J. Y., Zhang, Q., Wu, F., et al. (2017). Ice age unfrozen: severe effect of the last interglacial, not glacial, climate change on east Asian avifauna. BMC Evol. Biol. 17:244. doi: 10.1186/s12862-017-1100-2
Epps, C. W., Castillo, J. A., Schmidt-Küntzel, A., du Preez, P., Stuart-Hill, G., Jago, M., et al. (2013a). Contrasting historical and recent gene flow among African buffalo herds in the Caprivi Strip of Namibia. J. Hered. 104, 172–181. doi: 10.1093/jhered/ess142
Epps, C. W., Wasser, S. K., Keim, J. L., Mutayoba, B. M., and Brashares, J. S. (2013b). Quantifying past and present connectivity illuminates a rapidly changing landscape for the African elephant. Mol. Ecol. 22, 1574–1588. doi: 10.1111/mec.12198
Evanno, G., Regnaut, S., and Goudet, J. (2005). Detecting the number of clusters of individuals using the software STRUCTURE: a simulation study. Mol. Ecol. 14, 2611–2620. doi: 10.1111/j.1365-294X.2005.02553.x
Excoffier, L., and Lischer, H. E. (2010). Arlequin suite ver 3.5: a new series of programs to perform population genetics analyses under Linux and windows. Mol. Ecol. Resour. 10, 564–567. doi: 10.1111/j.1755-0998.2010.02847.x
Feng, Z., Xiao, T., Zhang, G., Zhang, L., Cui, Y., and Jiang, Y. (2020). Mercury spatial distribution characteristics and its exposure of the endangered Jankowski's bunting. Ecol. Res. 35, 650–661. doi: 10.1111/1440-1703.12117
Feng, X., Zhou, H., Zulfiqar, S., Luo, X., Hu, Y., Feng, L., et al. (2018). The Phytogeographic history of common walnut in China. Front. Plant Sci. 9:1399. doi: 10.3389/fpls.2018.01399
Fitzpatrick, S. W., Gerberich, J. C., Angeloni, L. M., Bailey, L. L., Broder, E. D., Torres-Dowdall, J., et al. (2016). Gene flow from an adaptively divergent source causes rescue through genetic and demographic factors in two wild populations of Trinidadian guppies. Evol. Appl. 9, 879–891. doi: 10.1111/eva.12356
Frankham, R., Ballou, J. D., and Briscoe, D. A. (2002). Introduction to conservation genetics. Cambridge: Cambridge University Press.
Franklin, I. R. (1980). Evolutionary change in small populations. Sunderland, Massachusetts: Sinauer Associates, U.S.A.
Fu, Y. (1997). Statistical tests of neutrality of mutations against population growth, hitchhiking and background selection. Genetics 147, 915–925. doi: 10.1093/genetics/147.2.915
Gao, W., Wang, H., and Sun, D. (2003). The habitat and nest-site slection of Jankowski's bunting. Acta Ecol. Sin. 23, 665–672.
Garza, J. C., and Williamson, E. G. (2001). Detection of reduction in population size using data from microsatellite loci. Mol. Ecol. 10, 305–318. doi: 10.1046/j.1365-294X.2001.01190.x
Gilbert, K. J., and Whitlock, M. C. (2015). Evaluating methods for estimating local effective population size with and without migration. Evolut. Int. J. Organ. Evolut. 69, 2154–2166. doi: 10.1111/evo.12713
Goudet, J. (1995). FSTAT (version 1.2): a computer program to calculate F-statistics. J. Hered. 86, 485–486. doi: 10.1093/oxfordjournals.jhered.a111627
Grant, W. S. (2015). Problems and cautions with sequence mismatch analysis and Bayesian skyline plots to infer historical demography. J. Hered. 106, 333–346. doi: 10.1093/jhered/esv020
Grant, W. S., Liu, M., Gao, T., and Yanagimoto, T. (2012). Limits of Bayesian skyline plot analysis of mtDNA sequences to infer historical demographies in Pacific herring (and other species). Mol. Phylogenet. Evol. 65, 203–212. doi: 10.1016/j.ympev.2012.06.006
Hague, M. T., and Routman, E. J. (2016). Does population size affect genetic diversity? A test with sympatric lizard species. Heredity 116, 92–98. doi: 10.1038/hdy.2015.76
Hall, T. A. (1999). BioEdit: a user-friendly biological sequence alignment editor and analysis program for windows 95/98/NT. Nucleic Acids Symp. Ser. 734, 95–98. doi: 10.1021/bk-1999-0734.ch008
Han, Z., Robert, A., Wang, H., and Jiguet, F. (2022). Low survival of eggs and nestlings explain the decline of a local Jankowski’s bunting population. J. Ornithol. 163, 817–826. doi: 10.1007/s10336-022-01983-4
Han, Z., Wang, H., Kardynal, K. J., Hobson, K. A., Shang, W., Zhang, L., et al. (2021). Stable isotopes (δ2H) in feathers identify non-breeding origins of the endangered Jankowski’s bunting. J. Ornithol. 162, 987–995. doi: 10.1007/s10336-021-01897-7
Han, Z., Zhang, L., Qin, B., Wang, L., Liu, Y., Fu, V. W. K., et al. (2017). Updated breeding distribution and population status of Jankowski’s bunting Emberiza jankowskii in China. Bird Conserv. Int. 28, 643–652. doi: 10.1017/S0959270917000491
Hansen, B. D., Harley, D. K., Lindenmayer, D. B., and Taylor, A. C. (2009). Population genetic analysis reveals a long-term decline of a threatened endemic Australian marsupial. Mol. Ecol. 18, 3346–3362. doi: 10.1111/j.1365-294X.2009.04269.x
Hansson, B., Ljungqvist, M., Illera, J. C., and Kvist, L. (2014). Pronounced fixation, strong population differentiation and complex population history in the Canary Islands blue tit subspecies complex. PLoS One 9:e90186. doi: 10.1371/journal.pone.0090186
Hindrikson, M., Remm, J., Pilot, M., Godinho, R., Stronen, A. V., Baltrūnaité, L., et al. (2017). Wolf population genetics in Europe: a systematic review, meta-analysis and suggestions for conservation and management. Biol. Rev. Camb. Philos. Soc. 92, 1601–1629. doi: 10.1111/brv.12298
Hoarau, G., Piquet, M. T., Veer, H. W. V. D., Rijnsdorp, A. D., Stam, W. T., and Olsen, J. L. (2004). Population structure of plaice (Pleuronectes platessa L.) in northern Europe: a comparison of resolving power between microsatellites and mitochondrial DNA data. J. Sea Res. 51, 183–190. doi: 10.1016/j.seares.2003.12.002
Hoffmann, A. A., Sgro, C. M., and Kristensen, T. N. (2017). Revisiting adaptive potential, population size, and conservation. Trends Ecol. Evol. 32, 506–517. doi: 10.1016/j.tree.2017.03.012
Huang, L., Zhang, L., Li, D., Yan, R., Shang, W., Jiang, Y., et al. (2022). Molecular evidence of introgressive hybridization between related species Jankowski’s bunting (Emberiza jankowskii) and meadow bunting (Emberiza cioides) (Aves: Passeriformes). Avian Res. 13:100035. doi: 10.1016/j.avrs.2022.100035
Hughes, A. L. (2010). Reduced microsatellite heterozygosity in island endemics supports the role of long-term effective population size in avian microsatellite diversity. Genetica 138, 1271–1276. doi: 10.1007/s10709-010-9527-z
Irwin, D. E., Rubtsov, A. S., and Panov, E. N. (2009). Mitochondrial introgression and replacement between yellowhammers (Emberiza citrinella) and pine buntings (Emberiza leucocephalos) (Aves: Passeriformes). Biol. J. Linn. Soc. 98, 422–438. doi: 10.1111/j.1095-8312.2009.01282.x
Jamieson, I. G., and Allendorf, F. W. (2012). How does the 50/500 rule apply to MVPs? Trends Ecol. Evolution 27, 578–584. doi: 10.1016/j.tree.2012.07.001
Jeanmougin, F., Thompson, J. D., Gouy, M., Higgins, D. G., and Gibson, T. J. (1998). Multiple sequence alignment with Clustal X. Trends Biochem. Sci. 23, 403–405. doi: 10.1016/s0968-0004(98)01285-7
Jiang, Y. L., Gao, W., Lei, F. M., Wang, H. T., and Zhao, J. (2008). Nesting biology and population dynamics of Jankowski's bunting Emberiza jankowskii in Western Jilin. China Bird Conserv. Int. 18, 153–163. doi: 10.1017/S0959270908000154
Jones, R. C., Steane, D. A., Lavery, M., Vaillancourt, R. E., and Potts, B. M. (2013). Multiple evolutionary processes drive the patterns of genetic differentiation in a forest tree species complex. Ecol. Evol. 3, 1–17. doi: 10.1002/ece3.421
Kalinowski, S. T., Taper, M. L., and Marshall, T. C. (2007). Revising how the computer program CERVUS accommodates genotyping error increases success in paternity assignment. Mol. Ecol. 16, 1099–1106. doi: 10.1111/j.1365-294X.2007.03089.x
Keyghobadi, N. (2007). The genetic implications of habitat fragmentation for animals. Can. J. Zool. 85, 1049–1064. doi: 10.1139/Z07-095
Kimura, M. (1983). The neutral theory of molecular evolution. Cambridge: Cambridge University Press.
Kondo, B., Peters, J. L., Rosensteel, B. B., and Omland, K. E. (2008). Coalescent analyses of multiple loci support a new route to speciation in birds. Evolut. Int. J. Organ. Evol. 62, 1182–1191. doi: 10.1111/j.1558-5646.2008.00345.x
Laikre, L., Olsson, F., Jansson, E., Hössjer, O., and Ryman, N. (2016). Metapopulation effective size and conservation genetic goals for the Fennoscandian wolf (Canis lupus) population. Heredity 117, 279–289. doi: 10.1038/hdy.2016.44
Lee, C., Fong, J. J., Jiang, J. P., Li, P. P., Waldman, B., Chong, J. R., et al. (2021). Phylogeographic study of the Bufo gargarizans species complex, with emphasis on Northeast Asia. Anim. Cells Syst. 25, 434–444. doi: 10.1080/19768354.2021.2015438
Lehmann, T., Hawley, W. A., Grebert, H., and Collins, F. H. (1998). The effective population size of Anopheles gambiae in Kenya: implications for population structure. Mol. Biol. Evol. 15, 264–276. doi: 10.1093/oxfordjournals.molbev.a025923
Leigh, J., and Bryant, D. (2015). PopART: full-feature software for haplotype network construction. Methods Ecol. Evol. 6, 1110–1116. doi: 10.1111/2041-210X.12410
Leigh, D. M., Hendry, A. P., Vazquez-Dominguez, E., and Friesen, V. L. (2019). Estimated six per cent loss of genetic variation in wild populations since the industrial revolution. Evol. Appl. 12, 1505–1512. doi: 10.1111/eva.12810
Li, J., Hu, Z., Sun, Z., Yao, J., Liu, F., Fresia, P., et al. (2017). Historical isolation and contemporary gene flow drive population diversity of the brown alga Sargassum thunbergii along the coast of China. BMC Evol. Biol. 17:246. doi: 10.1186/s12862-017-1089-6
Li, S., Li, D., Zhang, L., Shang, W., Qin, B., and Jiang, Y. (2021). High levels of genetic diversity and an absence of genetic structure among breeding populations of the endangered rufous-backed bunting in Inner Mongolia, China: implications for conservation. Avian Res. 12:7. doi: 10.1186/s40657-020-00236-3
Li, H., Liu, X., Herzschuh, U., Cao, X., Yu, Z., and Wang, Y. (2019). Vegetation and climate changes since the middle MIS 3 inferred from a Wulagai Lake pollen record, Inner Mongolia, northeastern China. Rev. Palaeobot. Palynol. 262, 44–51. doi: 10.1016/j.revpalbo.2018.12.006
Li, S. H., Yeung, C. K., Feinstein, J., Han, L., Le, M. H., Wang, C. X., et al. (2009). Sailing through the late Pleistocene: unusual historical demography of an east Asian endemic, the Chinese Hwamei (Leucodioptron canorum canorum), during the last glacial period. Mol. Ecol. 18, 622–633. doi: 10.1111/j.1365-294X.2008.04028.x
Li, X., Zhao, C., and Zhou, X. (2019). Vegetation pattern of Northeast China during the special periods since the last glacial maximum. Sci. China Earth Sci. 62, 1224–1240. doi: 10.1007/s11430-018-9347-3
Lindsay, D. L., Barr, K. R., Lance, R. F., Tweddale, S. A., Hayden, T. J., and Leberg, P. L. (2008). Habitat fragmentation and genetic diversity of an endangered, migratory songbird, the golden-cheeked warbler (Dendroica chrysoparia). Mol. Ecol. 17, 2122–2133. doi: 10.1111/j.1365-294X.2008.03673.x
Lippe, C., Dumont, P., and Bernatchez, L. (2006). High genetic diversity and no inbreeding in the endangered copper redhorse, Moxostoma hubbsi (Catostomidae, Pisces): the positive sides of a long generation time. Mol. Ecol. 15, 1769–1780. doi: 10.1111/j.1365-294X.2006.02902.x
Liu, J. X., Gao, T. X., Yokogawa, K., and Zhang, Y. P. (2006). Differential population structuring and demographic history of two closely related fish species, Japanese sea bass (Lateolabrax japonicus) and spotted sea bass (Lateolabrax maculatus) in northwestern Pacific. Mol. Phylogenet. Evol. 39, 799–811. doi: 10.1016/j.ympev.2006.01.009
Liu, T., Sun, K., Park, Y. C., and Feng, J. (2016). Phylogenetic relationships and evolutionary history of the greater horseshoe bat, Rhinolophus ferrumequinum, in Northeast Asia. PeerJ. 4:e2472. doi: 10.7717/peerj.2472
Luikart, G., Allendorf, F. W., Cornuet, J. M., and Sherwin, W. B. (1998). Distortion of allele frequency distributions provides a test for recent population bottlenecks. J. Hered. 89, 238–247. doi: 10.1093/jhered/89.3.238
Luikart, G., and Cornuet, J. M. (1998). Empirical evaluation of a test for identifying recently bottlenecked populations from allele frequency data. Conserv. Biol. 12, 228–237. doi: 10.1111/j.1523-1739.1998.96388.x
Luikart, G., Ryman, N., Tallmon, D. A., Schwartz, M. K., and Allendorf, F. W. (2010). Estimation of census and effective population sizes: the increasing usefulness of DNA-based approaches. Conserv. Genet. 11, 355–373. doi: 10.1007/s10592-010-0050-7
Mable, B. K. (2019). Conservation of adaptive potential and functional diversity: integrating old and new approaches. Conserv. Genet. 20, 89–100. doi: 10.1007/s10592-018-1129-9
Maruyama, T., and Fuerst, P. A. (1985). Population bottlenecks and nonequilibrium models in population genetics. II. Number of alleles in a small population that was formed by a recent bottleneck. Genetics 111, 675–689. doi: 10.1093/genetics/111.3.675
Milot, E., Gibbs, H. L., and Hobson, K. A. (2000). Phylogeography and genetic structure of northern populations of the yellow warbler (Dendroica petechia). Mol. Ecol. 9, 667–681. doi: 10.1046/j.1365-294x.2000.00897.x
Mondin, L. A. C., Machado, C. B., de Resende, E. K., Marques, D. K. S., and Galetti, P. M. Jr. (2018). Genetic pattern and demographic history of Salminus brasiliensis: population expansion in the Pantanal region during the Pleistocene. Front. Genet. 9:1. doi: 10.3389/fgene.2018.00001
Montoya, M. (2014). “Paleoclimate modeling of the last interglacial☆” in Reference module in earth systems and environmental Sciences (Oxford: Elsevier)
Murphy, C., Burnett, S., Conroy, G. C., Howland, B. W. A., Lamont, R. W., Sumner, J., et al. (2019). Genetic diversity and structure of the threatened striped legless lizard, Delma impar: management implications for the species and a translocated population. Conserv. Genet. 20, 245–257. doi: 10.1007/s10592-018-1127-y
Nadachowska-Brzyska, K., Li, C., Smeds, L., Zhang, G., and Ellegren, H. (2015). Temporal dynamics of avian populations during pleistocene revealed by whole-genome sequences. Curr. Biol. 25, 1375–1380. doi: 10.1016/j.cub.2015.03.047
Nei, M. (1973). Analysis of gene diversity in subdivided populations. Proc. Natl. Acad. Sci. U. S. A. 70, 3321–3323. doi: 10.1073/pnas.70.12.3321
Nei, M., Maruyama, T., and Chakraborty, R. (1975). The bottleneck effect and genetic variability in populations. Evol. Int. J. Organ. Evol. 29, 1–10. doi: 10.1111/j.1558-5646.1975.tb00807.x
Newmark, W. D. (2008). Isolation of African protected areas. Front. Ecol. Environ. 6, 321–328. doi: 10.1890/070003
Nomura, T. (2008). Estimation of effective number of breeders from molecular coancestry of single cohort sample. Evol. Appl. 1, 462–474. doi: 10.1111/j.1752-4571.2008.00015.x
Ohta, T., and Kimura, M. (1973). A model of mutation appropriate to estimate the number of electrophoretically detectable alleles in a finite population. Genet. Res. 22, 201–204. doi: 10.1017/s0016672300012994
Oosterhout, C. V., Hutchinson, W. F., Wills, D. P. M., and Shipley, P. (2010). Micro-checker: software for identifying and correcting genotyping errors in microsatellite data. Mol. Ecol. Resour. 4, 535–538. doi: 10.1111/j.1471-8286.2004.00684.x
Pavlacky, D. C., Goldizen, A. W., Prentis, P. J., Nicholls, J. A., and Lowe, A. J. (2009). A landscape genetics approach for quantifying the relative influence of historic and contemporary habitat heterogeneity on the genetic connectivity of a rainforest bird. Mol. Ecol. 18, 2945–2960. doi: 10.1111/j.1365-294X.2009.04226.x
Peakall, R. O. D., and Smouse, P. E. (2006). Genalex 6: genetic analysis in excel. Population genetic software for teaching and research. Mol. Ecol. Notes 6, 288–295. doi: 10.1111/j.1471-8286.2005.01155.x
Peakall, R., and Smouse, P. E. (2012). GenAlEx 6.5: genetic analysis in excel. Population genetic software for teaching and research—an update. Bioinformatics 28, 2537–2539. doi: 10.1093/bioinformatics/bts460
Pentzold, S., Tritsch, C., Martens, J., Tietze, D. T., Giacalone, G., Valvo, M. L., et al. (2013). Where is the line? Phylogeography and secondary contact of western Palearctic coal tits (Periparus ater: Aves, Passeriformes, Paridae). Zool. Anz. 252, 367–382. doi: 10.1016/j.jcz.2012.10.003
Peters, J. L., Sonsthagen, S. A., Lavretsky, P., Rezsutek, M., Johnson, W. P., and McCracken, K. G. (2014). Interspecific hybridization contributes to high genetic diversity and apparent effective population size in an endemic population of mottled ducks (Anas fulvigula maculosa). Conserv. Genet. 15, 509–520. doi: 10.1007/s10592-013-0557-9
Piry, S., Luikart, G., and Cornuet, J. M. (1999). Computer note. BOTTLENECK: a computer program for detecting recent reductions in the effective size using allele frequency data. J. Hered. 90, 502–503. doi: 10.1093/jhered/90.4.502
Posada, D., and Crandall, K. A. (2001). Intraspecific gene genealogies: trees grafting into networks. Trends Ecol. Evol. 16, 37–45. doi: 10.1016/s0169-5347(00)02026-7
Pritchard, J. K., Stephens, M., and Donnelly, P. (2000). Inference of population structure using multilocus genotype data. Genetics 155, 945–959. doi: 10.1093/genetics/155.2.945
Rambaut, A., Drummond, A. J., Xie, D., Baele, G., and Suchard, M. A. (2018). Posterior SUmmarization in Bayesian phylogenetics using tracer 1.7. Syst. Biol. 67, 901–904. doi: 10.1093/sysbio/syy032
Ramírez-Soriano, A., Ramos-Onsins, S. E., Rozas, J., Calafell, F., and Navarro, A. (2008). Statistical power analysis of neutrality tests under demographic expansions, contractions and bottlenecks with recombination. Genetics 179, 555–567. doi: 10.1534/genetics.107.083006
Ramos-Onsins, S. E., and Rozas, J. (2002). Statistical properties of new neutrality tests against population growth. Mol. Biol. Evol. 19, 2092–2100. doi: 10.1093/oxfordjournals.molbev.a004034
Raymond, M., and Rousset, F. (1995). GENEPOP (version 1.2): population genetics software for exact tests and ecumenicism. J. Hered. 86, 248–249. doi: 10.1093/oxfordjournals.jhered.a111573
Rogers, A. R., and Harpending, H. (1992). Population growth makes waves in the distribution of pairwise genetic differences. Mol. Biol. Evol. 9, 552–569. doi: 10.1093/oxfordjournals.molbev.a040727
Romane, C., William, B. S., Kathrine, H., Valma, C., and Desmond, W. C. (2010). Detecting bottlenecks using BOTTLENECK 1.2.02 in wild populations: the importance of the microsatellite structure. Conserv. Genet. 11, 1043–1049. doi: 10.1007/s10592-009-9949-2
Rozas, J., Ferrer-Mata, A., Sánchez-DelBarrio, J. C., Guirao-Rico, S., Librado, P., Ramos-Onsins, S. E., et al. (2017). DnaSP 6: DNA sequence polymorphism analysis of large data sets. Mol. Biol. Evol. 34, 3299–3302. doi: 10.1093/molbev/msx248
Saether, B. E., Lande, R., Engen, S., Weimerskirch, H., Lillegård, M., Altwegg, R., et al. (2005). Generation time and temporal scaling of bird population dynamics. Nature 436, 99–102. doi: 10.1038/nature03666
Samarasin, P., Shuter, B. J., Wright, S. I., and Rodd, F. H. (2017). The problem of estimating recent genetic connectivity in a changing world. Conserv. Biol. 31, 126–135. doi: 10.1111/cobi.12765
Schroeder, H., Yanbaev, Y., and Degen, B. (2010). A very small and isolated population of the green oak leaf roller, Tortrix viridana L., with high genetic diversity--how does this work? J. Hered. 101, 780–783. doi: 10.1093/jhered/esq064
Segelbacher, G., Manel, S., and Tomiuk, J. (2008). Temporal and spatial analyses disclose consequences of habitat fragmentation on the genetic diversity in capercaillie (Tetrao urogallus). Mol. Ecol. 17, 2356–2367. doi: 10.1111/j.1365-294X.2008.03767.x
Speer, K. A., Petronio, B. J., Simmons, N. B., Richey, R., Magrini, K., Soto-Centeno, J. A., et al. (2017). Population structure of a widespread bat (Tadarida brasiliensis) in an island system. Ecol. Evol. 7, 7585–7598. doi: 10.1002/ece3.3233
Suárez, M. G., Gamboa, D. A., and Gerber, L. (2010). Past exploitation of California Sea lions did not lead to a genetic bottleneck in the Gulf of California. Cienc. Mar. 36, 199–211. doi: 10.7773/cm.v36i2.1672
Sun, J. (1992). Evolution of natural environment and development of grassland in Inner Mongolia. Grassland Pratacult. 2, 1–7.
Torres-Florez, J. P., Hucke-Gaete, R., Rosenbaum, H., and Figueroa, C. C. (2014). High genetic diversity in a small population: the case of Chilean blue whales. Ecol. Evol. 4, 1398–1412. doi: 10.1002/ece3.998
Tritsch, C., Stuckas, H., Martens, J., Pentzold, S., Kvist, L., Lo Valvo, M., et al. (2018). Gene flow in the European coal tit, Periparus ater (Aves: Passeriformes): low among Mediterranean populations but high in a continental contact zone. Biol. J. Linn. Soc. 124, 319–338. doi: 10.1093/biolinnean/bly043
Vandergast, A. G., Bohonak, A. J., Weissman, D. B., and Fisher, R. N. (2007). Understanding the genetic effects of recent habitat fragmentation in the context of evolutionary history: phylogeography and landscape genetics of a southern California endemic Jerusalem cricket (Orthoptera: Stenopelmatidae: Stenopelmatus). Mol. Ecol. 16, 977–992. doi: 10.1111/j.1365-294X.2006.03216.x
Varvio, S. L., Chakraborty, R., and Nei, M. (1986). Genetic variation in subdivided populations and conservation genetics. Heredity 57, 189–198. doi: 10.1038/hdy.1986.109
Wang, H., Jiang, Y., and Gao, W. (2011). Jankowski's bunting (Emberiza jankowskii): current status and conservation. Avian Res. 1, 251–258. doi: 10.5122/cbirds.2010.0022
Wang, W., McKay, B. D., Dai, C., Zhao, N., Zhang, R., Qu, Y., et al. (2013). Glacial expansion and diversification of an east Asian montane bird, the green-backed tit (Parus monticolus). J. Biogeogr. 40, 1156–1169. doi: 10.1111/jbi.12055
Wang, W., Qiao, Y., Pan, W., and Yao, M. (2015). Low genetic diversity and strong geographical structure of the critically endangered white-headed langur (Trachypithecus leucocephalus) inferred from mitochondrial DNA control region sequences. PLoS One 10:e0129782. doi: 10.1371/journal.pone.0129782
Waples, R. S. (2006). A bias correction for estimates of effective population size based on linkage disequilibrium at unlinked gene loci*. Conserv. Genet. 7, 167–184. doi: 10.1007/s10592-005-9100-y
Weber, J. L., and Wong, C. (1993). Mutation of human short tandem repeats. Hum. Mol. Genet. 2, 1123–1128. doi: 10.1093/hmg/2.8.1123
Wei, Z., Zhijiu, C., and Yonghua, L. (2006). Review of the timing and extent of glaciers during the last glacial cycle in the bordering mountains of Tibet and in East Asia. Quat. Int. 154-155, 32–43. doi: 10.1016/j.quaint.2006.02.012
Wilson, G. A., and Rannala, B. (2003). Bayesian inference of recent migration rates using multilocus genotypes. Genetics 163, 1177–1191. doi: 10.1093/genetics/163.3.1177
Wright, S. (1978). Evolution and the genetics of populations (Vol. 4). Chicago: University of Chicago Press.
Xu, H., and Fu, Y. (2004). Estimating effective population size or mutation rate with microsatellites. Genetics 166, 555–563. doi: 10.1534/genetics.166.1.555
Xu, X., Peng, M., and Fang, Z. (2000). The direction of microsatellite mutations is dependent upon allele length. Nat. Genet. 24, 396–399. doi: 10.1038/74238
Ye, J. W., Zhang, Z. K., Wang, H. F., Bao, L., and Ge, J. P. (2019). Phylogeography of Schisandra chinensis (Magnoliaceae) reveal multiple refugia with ample gene flow in Northeast China. Front. Plant Sci. 10:199. doi: 10.3389/fpls.2019.00199
Yin, H., Pflugmacher, D., Li, A., Li, Z., and Hostert, P. (2018). Land use and land cover change in Inner Mongolia - understanding the effects of China's re-vegetation programs. Remote Sens. Environ. 204, 918–930. doi: 10.1016/j.rse.2017.08.030
Zarlenga, D. S., Hoberg, E., Rosenthal, B., Mattiucci, S., and Nascetti, G. (2014). Anthropogenics: human influence on global and genetic homogenization of parasite populations. J. Parasitol. 100, 756–772. doi: 10.1645/14-622.1
Zhang, L., Li, X., Yu, J., Li, S., Shang, W., Han, Z., et al. (2020). Who parasitizes the endangered Jankowski’s bunting Emberiza jankowskii? Bird Study 67, 128–130. doi: 10.1080/00063657.2020.1727841
Zhang, W., Luo, Z., Zhao, M., and Wu, H. (2015). High genetic diversity in the endangered and narrowly distributed amphibian species Leptobrachium leishanense. Integr. Zool. 10, 465–481. doi: 10.1111/1749-4877.12142
Keywords: demographic history, Emberiza jankowskii, genetic diversity, population connectivity, bottleneck, habitat protection, molecular markers
Citation: Huang L, Feng G, Li D, Shang W, Zhang L, Yan R, Jiang Y and Li S (2023) Genetic variation of endangered Jankowski’s Bunting (Emberiza jankowskii): High connectivity and a moderate history of demographic decline. Front. Ecol. Evol. 10:996617. doi: 10.3389/fevo.2022.996617
Edited by:
Jennifer Leonard, Spanish National Research Council, SpainReviewed by:
Federica Lucati, Pompeu Fabra University, SpainLeilton Willians Luna, The Pennsylvania State University (PSU), United States
Copyright © 2023 Huang, Feng, Li, Shang, Zhang, Yan, Jiang and Li. This is an open-access article distributed under the terms of the Creative Commons Attribution License (CC BY). The use, distribution or reproduction in other forums is permitted, provided the original author(s) and the copyright owner(s) are credited and that the original publication in this journal is cited, in accordance with accepted academic practice. No use, distribution or reproduction is permitted which does not comply with these terms.
*Correspondence: Shi Li, ✉ lishi@jlau.edu.cn