Glacial Expansion or Interglacial Expansion? Contrasting Demographic Models of Four Cold-Adapted Fir Species in North America and East Asia
 Yi-Zhen Shao1†
  Zhi-Liang Yuan1†
  Yan-Yan Liu2
  Feng-Qin Liu1 Rui-Chen Xiang1 Yuan-Yuan Zhang1 Yong-Zhong Ye1
  Yun Chen1*
  Qian Wen3*
- 1College of Life Sciences, Henan Agricultural University, Zhengzhou, China
- 2College of Plant Protection, Henan Agricultural University, Zhengzhou, China
- 3College of Resources and Environmental Sciences, Henan Agricultural University, Zhengzhou, China
Understanding and forecasting species’ response to climate change is a critical need for future conservation and management. Two expansion hypotheses, the glacial expansion versus the interglacial expansion, have been proposed to interpret how cold-adapted organisms in the northern hemisphere respond to Quaternary climatic fluctuations. To test these two hypotheses, we originally used two pairs of high-low elevation firs from North America (Abies lasiocarpa and Abies balsamea) and East Asia (Abies chensiensis and Abies nephrolepis). Abies lasiocarpa and Abies chensiensis are widely distributed in high-elevation regions of western North America and central China. Abies balsamea and Abies nephrolepis occur in central North America and northeast China, with much lower elevations. These fir species are typical cold-adapted species and sensitive to climate fluctuations. Here, we integrated the mtDNA and cpDNA polymorphisms involving 44 populations and 585 individuals. Based on phylogeographic analyses, recent historical range expansions were indicated in two high-elevation firs (Abies lasiocarpa and Abies chensiensis) during the last glaciation (43.8–28.4 or 21.9–14.2 kya, 53.1–34.5 or 26.6–17.2 kya). Such glacial expansions in high-elevation firs were further confirmed by the evidence of species distribution modelling, geographic-driven genetic patterns, palynological records, and current distribution patterns. Unlike the north American firs, the SDM models indicated unremarkable expansion or contraction in East Asia firs for its much more stable conditions during different historical periods. Taken together, our findings highly supported that high-elevation firs experienced glacial expansion during the Quaternary climate change in East Asia and North America, as interglacial expansion within low-elevation firs. Under this situation, the critically endangered fir species distributed in high elevation would have no enough higher elevational space to migrate. Facing the increasing global warming, thus we proposed ex-situ conservation of defining conservation units as the most meaningful strategy.
Introduction
Understanding and predicting species distribution range shifts in response to climate change, especially Quaternary glacial and interglacial cycles, is critical for conservation and management (Betancourt et al., 1990; Hewitt, 1996, 2004). For cold-adapted taxa in the northern hemisphere, two common hypotheses are proposed to explain their demographic shifts to historical climate change cycles (Theodoridis et al., 2017). The first hypothesis is the interglacial expansion of cold-adapted organisms at lower elevations (Lascoux et al., 2004; Theodoridis et al., 2017). Under this hypothesis, historical glaciations were generally a driver of range contraction, with large-scale latitudinal shifts into glacial refugia at the lower latitudes (Figures 1 A–C; Birks, 2008; Luzmm et al., 2020). These rapidly latitudinal shifts were charactered by low genetic diversity at higher latitudes than lower ones (Hewitt, 1996). The alternative hypothesis is the glacial expansion of cold-adapted species in higher elevations. Under this hypothesis, cold-adapted species shifted along an altitudinal gradient due to glacial-interglacial fluctuations (Petit et al., 2005; Awad et al., 2014; Inoue and Berg, 2016; Oliveira et al., 2021). They moved downslope and generated wider distribution during the various glacial maxima, and collapsed into several small high-elevation sky-islands during the interglaciations (Figures 1D–F; Galbreath et al., 2009; Inoue and Berg, 2016; Oliveira et al., 2021). Such glacial expansion hypothesis may result in multiple genetic diversity centres, and lacking genetic diversity decreasing along latitude (Hewitt, 1996). Thus, the glacial expansion hypothesis differs from the interglacial expansion hypothesis in both expansion periods and spatial distribution of genetic diversity.
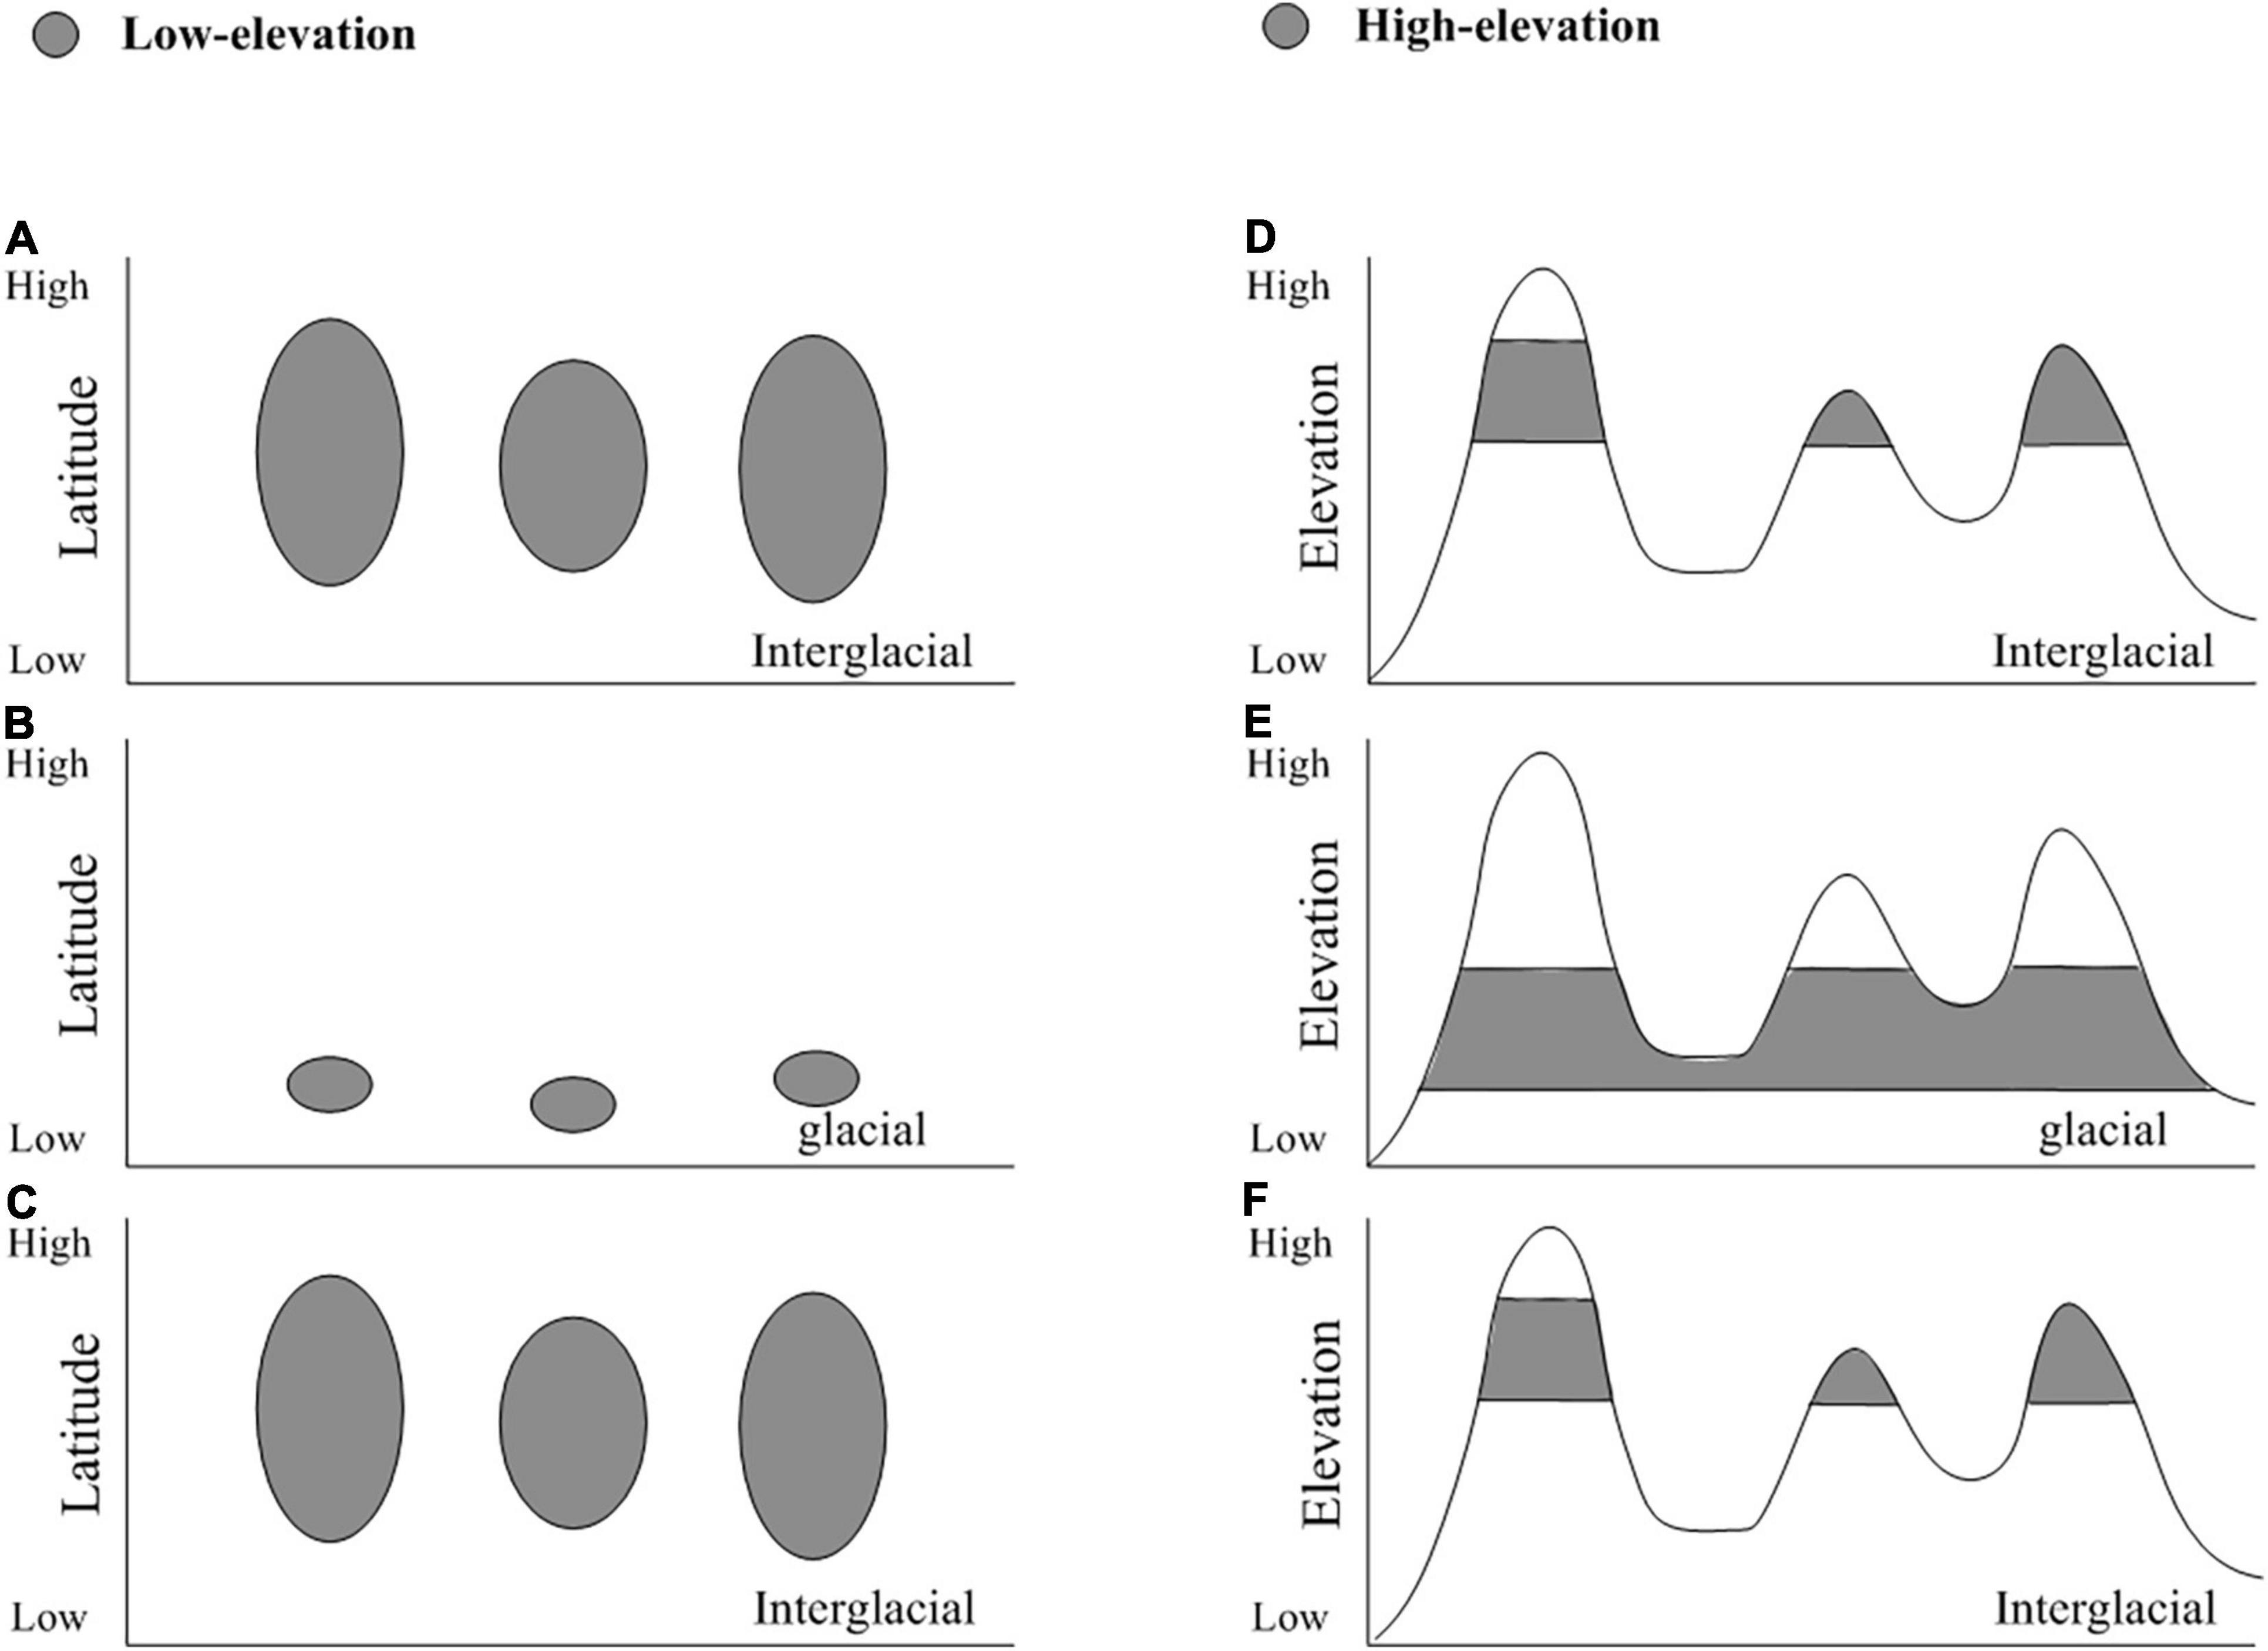
Figure 1. Hypothetical migration of interglacial expansion and glacial expansion during Quaternary. The distribution range of low-elevation and high-elevation species are presented in panels (A–C) and panels (D–F), respectively.
The glacial expansion hypothesis has been validated by various studies on alpine and arctic species (Brown and Hebda, 2002; Cinget et al., 2015b; Shao et al., 2017, 2020; Wyatt et al., 2021). Besides, several studies have sought to support the interglacial expansion hypothesis (Cinget et al., 2015a; Theodoridis et al., 2017). Till now, the two proposed contrasting hypotheses have never been simultaneously documented in closely related species, presenting comparable high-low elevations or distinct continents (Liu et al., 2012; Theodoridis et al., 2017; Lin et al., 2021). In fact, the cold-adapted species in East Asia, Europe, and North America might respond to the Quaternary climatic fluctuations via different demographic hypotheses. In North America and Europe, northern regions have been repeatedly covered by large continuous ice sheets during glaciations. And only a few montane glaciers or valley glaciers occurred in East Asia regions (Shi et al., 1987; Shi, 2002). Thus further research concerning comparable high-low elevations and distinct continents is significant in understanding cold-adapted species’ response to Quaternary glacial-interglacial cycles.
Firs are widely distributed in the montane region among the northern hemisphere, and North America and East Asia are two well-known diversity centres (Farjon, 2001; Fan, 2006). Because of their cold-adapted distribution and sensitivity to temperature changes, these plants are commonly used as paleoclimatic indicators, and make them an ideal model system for investigating the proposed contrasting hypotheses (Xu et al., 1980; Shi, 1996). Here, we selected four cold-adapted firs from North America [Abies lasiocarpa Endl. and Abies balsamea (L.) Mill.] and East Asia (Abies chensiensis Tiegh. and Abies nephrolepis Maxim.), presenting comparable high-low elevations and distinct continents (Figure 2). These four fir species present not only distinct continents but also comparable ecozones (Halliday and Brown, 1943; Liu, 1971; Fan, 2006). Abies lasiocarpa and Abies chensiensis are typical of the montane ecozone, with an altitude of 1100–2300 and 2100–3500 m, respectively (Cheng and Fu, 1978). However, Abies balsamea and Abies nephrolepis are instead found in the boreal plain ecozone, with a much lower elevation of 0–1700 and 0–1200 m, respectively (Little, 1971; Frank, 1990). These fir species are disjunctly distributed in cold and moist high latitudes or altitudes (Alexander et al., 1990; Stewart et al., 2010). These two high-low elevation species pairs thus provide an excellent system to simultaneously evaluate the proposed contrasting hypotheses in North America and East Asia by comparing interspecific phylogeography.
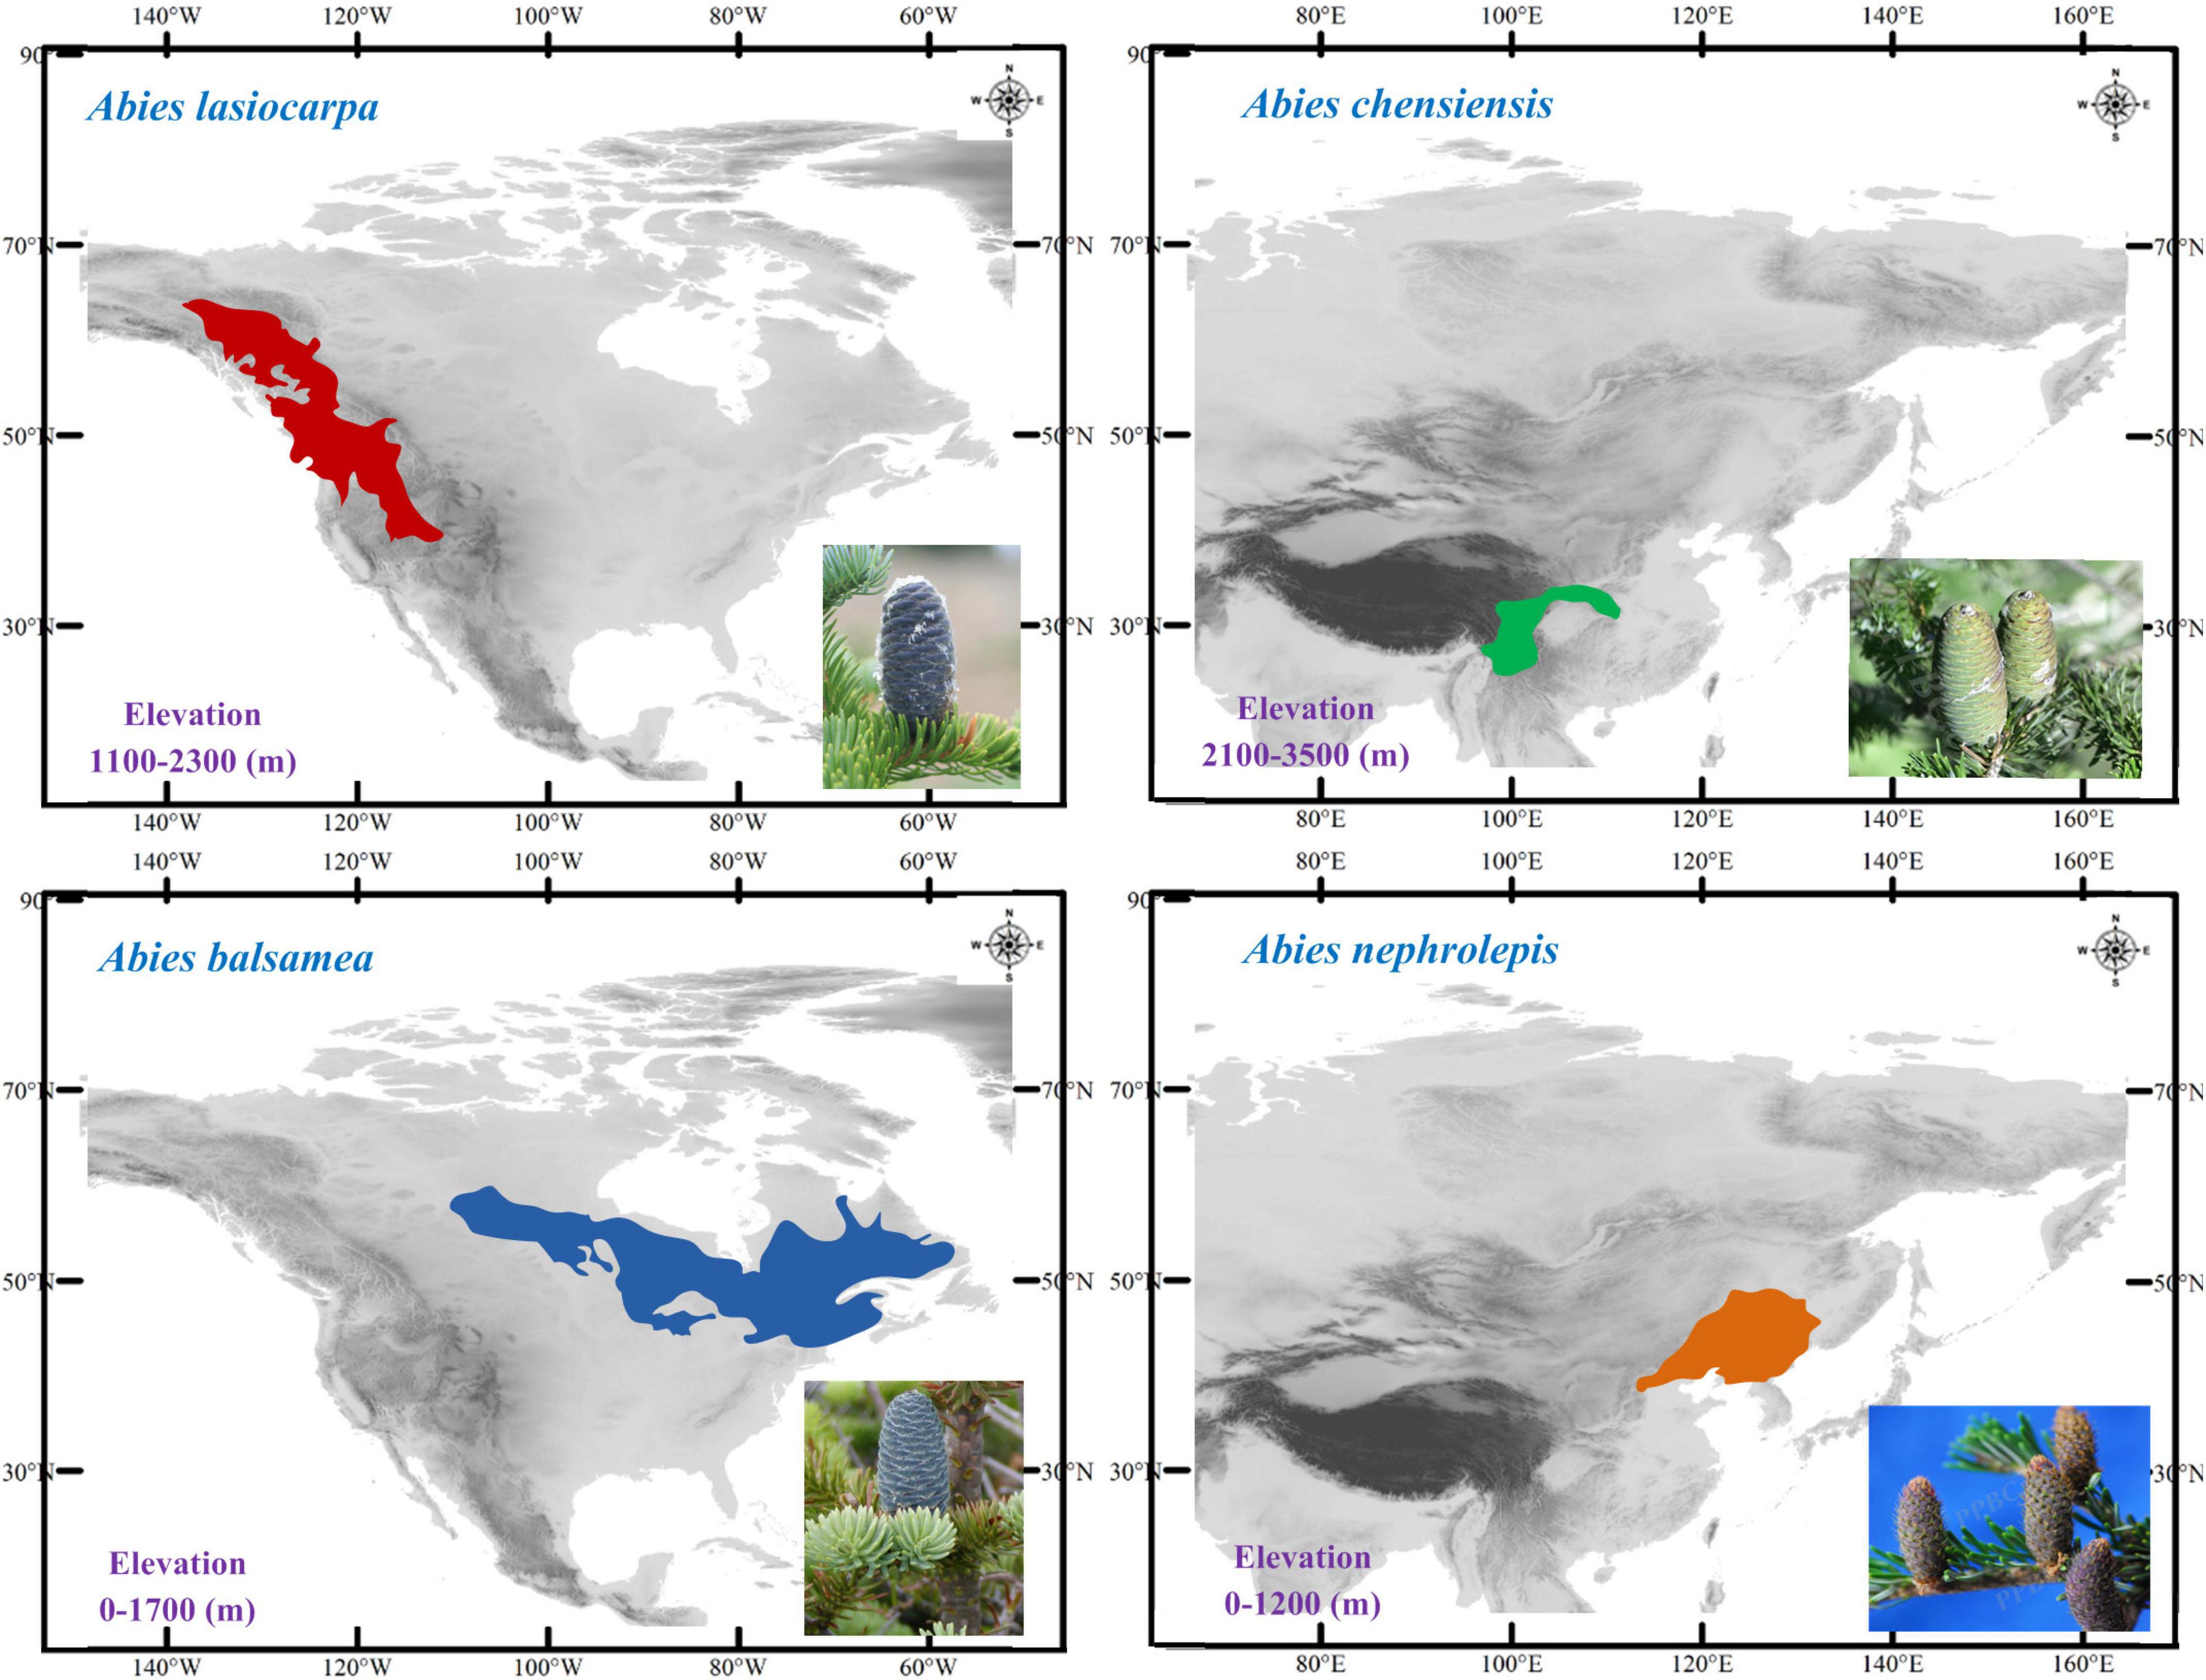
Figure 2. Distribution ranges of the four fir species.
Statistical phylogeographic, by integrating phylogeographic and climatic data, is now proposed as one of the most efficient ways to inform and test alternative evolutionary hypotheses (Combe et al., 2016; Ersmark et al., 2016; Theodoridis et al., 2017; Yan et al., 2020). To reconstruct historical range shifts, the phylogeographic analysis by using population-based genealogical data is the most effective way (Avise, 2004). Another widely used method is species distribution modelling (SDM), which is widely used to understand biogeographic patterns and the processes generating them through studies of spatial-geographic variation by providing independent, but complementary, information (Waltari et al., 2007; Avise, 2009; Shao et al., 2020; Brodie et al., 2021). The statistical phylogeography thus provides a robust approach to explain current species distributions and genetic structure in relation to historical climate oscillations (Gavin et al., 2014; López-Pujol et al., 2016).
Here, we conducted statistical phylogeographic analyses and species distribution modelling on four fir species, presenting comparable high-low elevations and distinct continents, with aims: (i) original test the significance of the two contrasting hypotheses in North America and East Asia, (ii) explore the conservation strategy of fir species under increasing global warming.
Materials and Methods
Study Species, Sampling, and Genomic Data
Four firs, presenting comparable high-low elevations and distinct continents, were used in this study. Abies lasiocarpa and Abies balsamea are widely distributed in North America (Figure 2; Hosie, 1969). These two species were located in a monophyletic clade according to mtDNA and cpDNA phylogeny (Aguirre-Planter et al., 2012; Xiang et al., 2015, 2018). Abies lasiocarpa tends to grow in the montane region of New Mexico and Arizona, more extensively in Utah and Colorado (Alexander et al., 1990). It is typically found at 1100–2300 m elevation in coastal subalpine conifer forests, and grows to the alpine treeline in most of its range (Little, 1971). Abies balsamea always occurred in cold regions (around 4°C) of northeastern America and eastern Canada, and the northeastern United States, at 0–1700 m elevation in boreal and north temperate forests (Little, 1971; Frank, 1990). It often forms clumps, where branches from an older central stem have layered, developed apical dominance. Abies chensiensis, as an endangered species, is distributed in Qinling-Daba and Hengduan mountains region of central China (Cheng and Fu, 1978; International Union for Conservation of Nature [IUCN], 2021). It grows in cold, moist forests at 2100–3500 m elevation, in regions with annual precipitation of 1000–2000 mm. Abies nephrolepis is a species occurring in Northeast Asia. Its elevation ranges from 0 to 1200 m, charactered by short, cool summers, and long cold winters with much snow (Cheng and Fu, 1978). Abies lasiocarpa and Abies chensiensis are widely distributed in high-elevation regions, as Abies balsamea and Abies nephrolepis occur in much lower elevations (Figure 2).
Here, the species sampling and genomic data were derived from three published studies (Jiang et al., 2011; Wang et al., 2011; Cinget et al., 2015b). Altogether, we sampled 585 individuals from 44 natural populations, including seven A. lasiocarpa populations, 12 A. balsamea populations, ten A. chensiensis populations, and 15 A. nephrolepis populations (Supplementary Table 1). Our sampling well presented the current distribution of these species. Field sampling was strictly conducted following international rules. Tsuga canadensis and Keteleeria evelyniana were chosen as outgroups.
In total, one mtDNA fragment (nad5-4) and one cpDNA fragment (trnL-trnF) were derived from three published studies (Jiang et al., 2011; Wang et al., 2011; Cinget et al., 2015b). Even all previous population-based studies in the genus Abies were widely investigated, only these two fragments and four firs could be recognised. To be mentioned, even though only two makers were used, they were almost the most informative sites available in the phylogeographical analyses of the genus Abies so far (Cinget et al., 2015a,b; Shao and Xiang, 2015; Shao et al., 2017, 2020). In these studies, more than then mtDNA (e.g., nad1-2, nad5-1, nad5-4, nad7-1, and cox1) and cpDNA (e.g., trnS-trnF, trnL-trnF, and trnS-trnG) had been surveyed, nad5-4 and trnL-trnF were the most informatic markers. Thus the markers used could be sufficient to test the relevant phylogeographical history. The relevant Genbank numbers were recorded in Supplementary Tables 2, 3.
Population Structure and Demographic History Analyses
We used DNASP version 4.10 to calculate the genetic diversity values, including h (genotype diversity) and π (differences between genetic sequences) (Nei, 1987; Rozas et al., 2003). We run the DNASP for each species and population. We used the molecular diversity values to explore the spatial distribution patterns by using GDivPAL (Dellicour and Mardulyn, 2014). Such analyses in Spads were not performed using mtDNA, because of its extremely low diversity in each species. By using the software NETWORK, we further inferred the network relationships within mitotypes and chlorotypes (Bandelt et al., 1999). Moreover, each gap was treated as one mutation.
To survey the population differentiation, we used the PERMUT to calculate NST and GST, the genetic diversity within populations (HS), and the total gene diversity (HT) (Pons and Petit, 1996). A phylogeographic structure could be indicated if GST was significantly lower than the NST. Using the program ARLEQUIN 3.5, we run the AMOVA (molecular variance analysis) to survey the genetical variation (Excoffier and Lischer, 2010). We performed the Mantel test to estimate the correlation between genetic distance and geographical distances (Mantel, 1967; Nei and Li, 1979; Dupanloup et al., 2002).
To detect historical distribution range expansions, the mismatch distribution analyses were performed in Arlequin 3.5. If recent expansions were indicated, further analyses could estimate potential periods. The estimated formula was s = 2 ut (t means expansion age), u = μkg (μ means the substitution rates of each nucleotide site every year, k means the average length of nucleotide sequences, and g means the potential generation years in Abies) (Rogers and Harpending, 1992). Here, we designed the value of μ as 2.61–4.02 × 10⁻¹⁰ ss–1 y–1, the value of k as 1111 bp, according to numerous published studies in Pinaceae and Abies (e.g., Gernandt et al., 2008; Shao et al., 2020). The g value was designed as 25 years (option 1) or 50 years (option 2) for the occurrence of two different effective generation times of Abies (Xiang, 2001; Brown et al., 2004; Fan, 2006). Furthermore, such mismatch distribution analyses were performed in three species except for A. nephrolepis, because the chlorotype diversity within all the populations of A. nephrolepis was relatively low, which was fixed by C8 (Figure 3B).
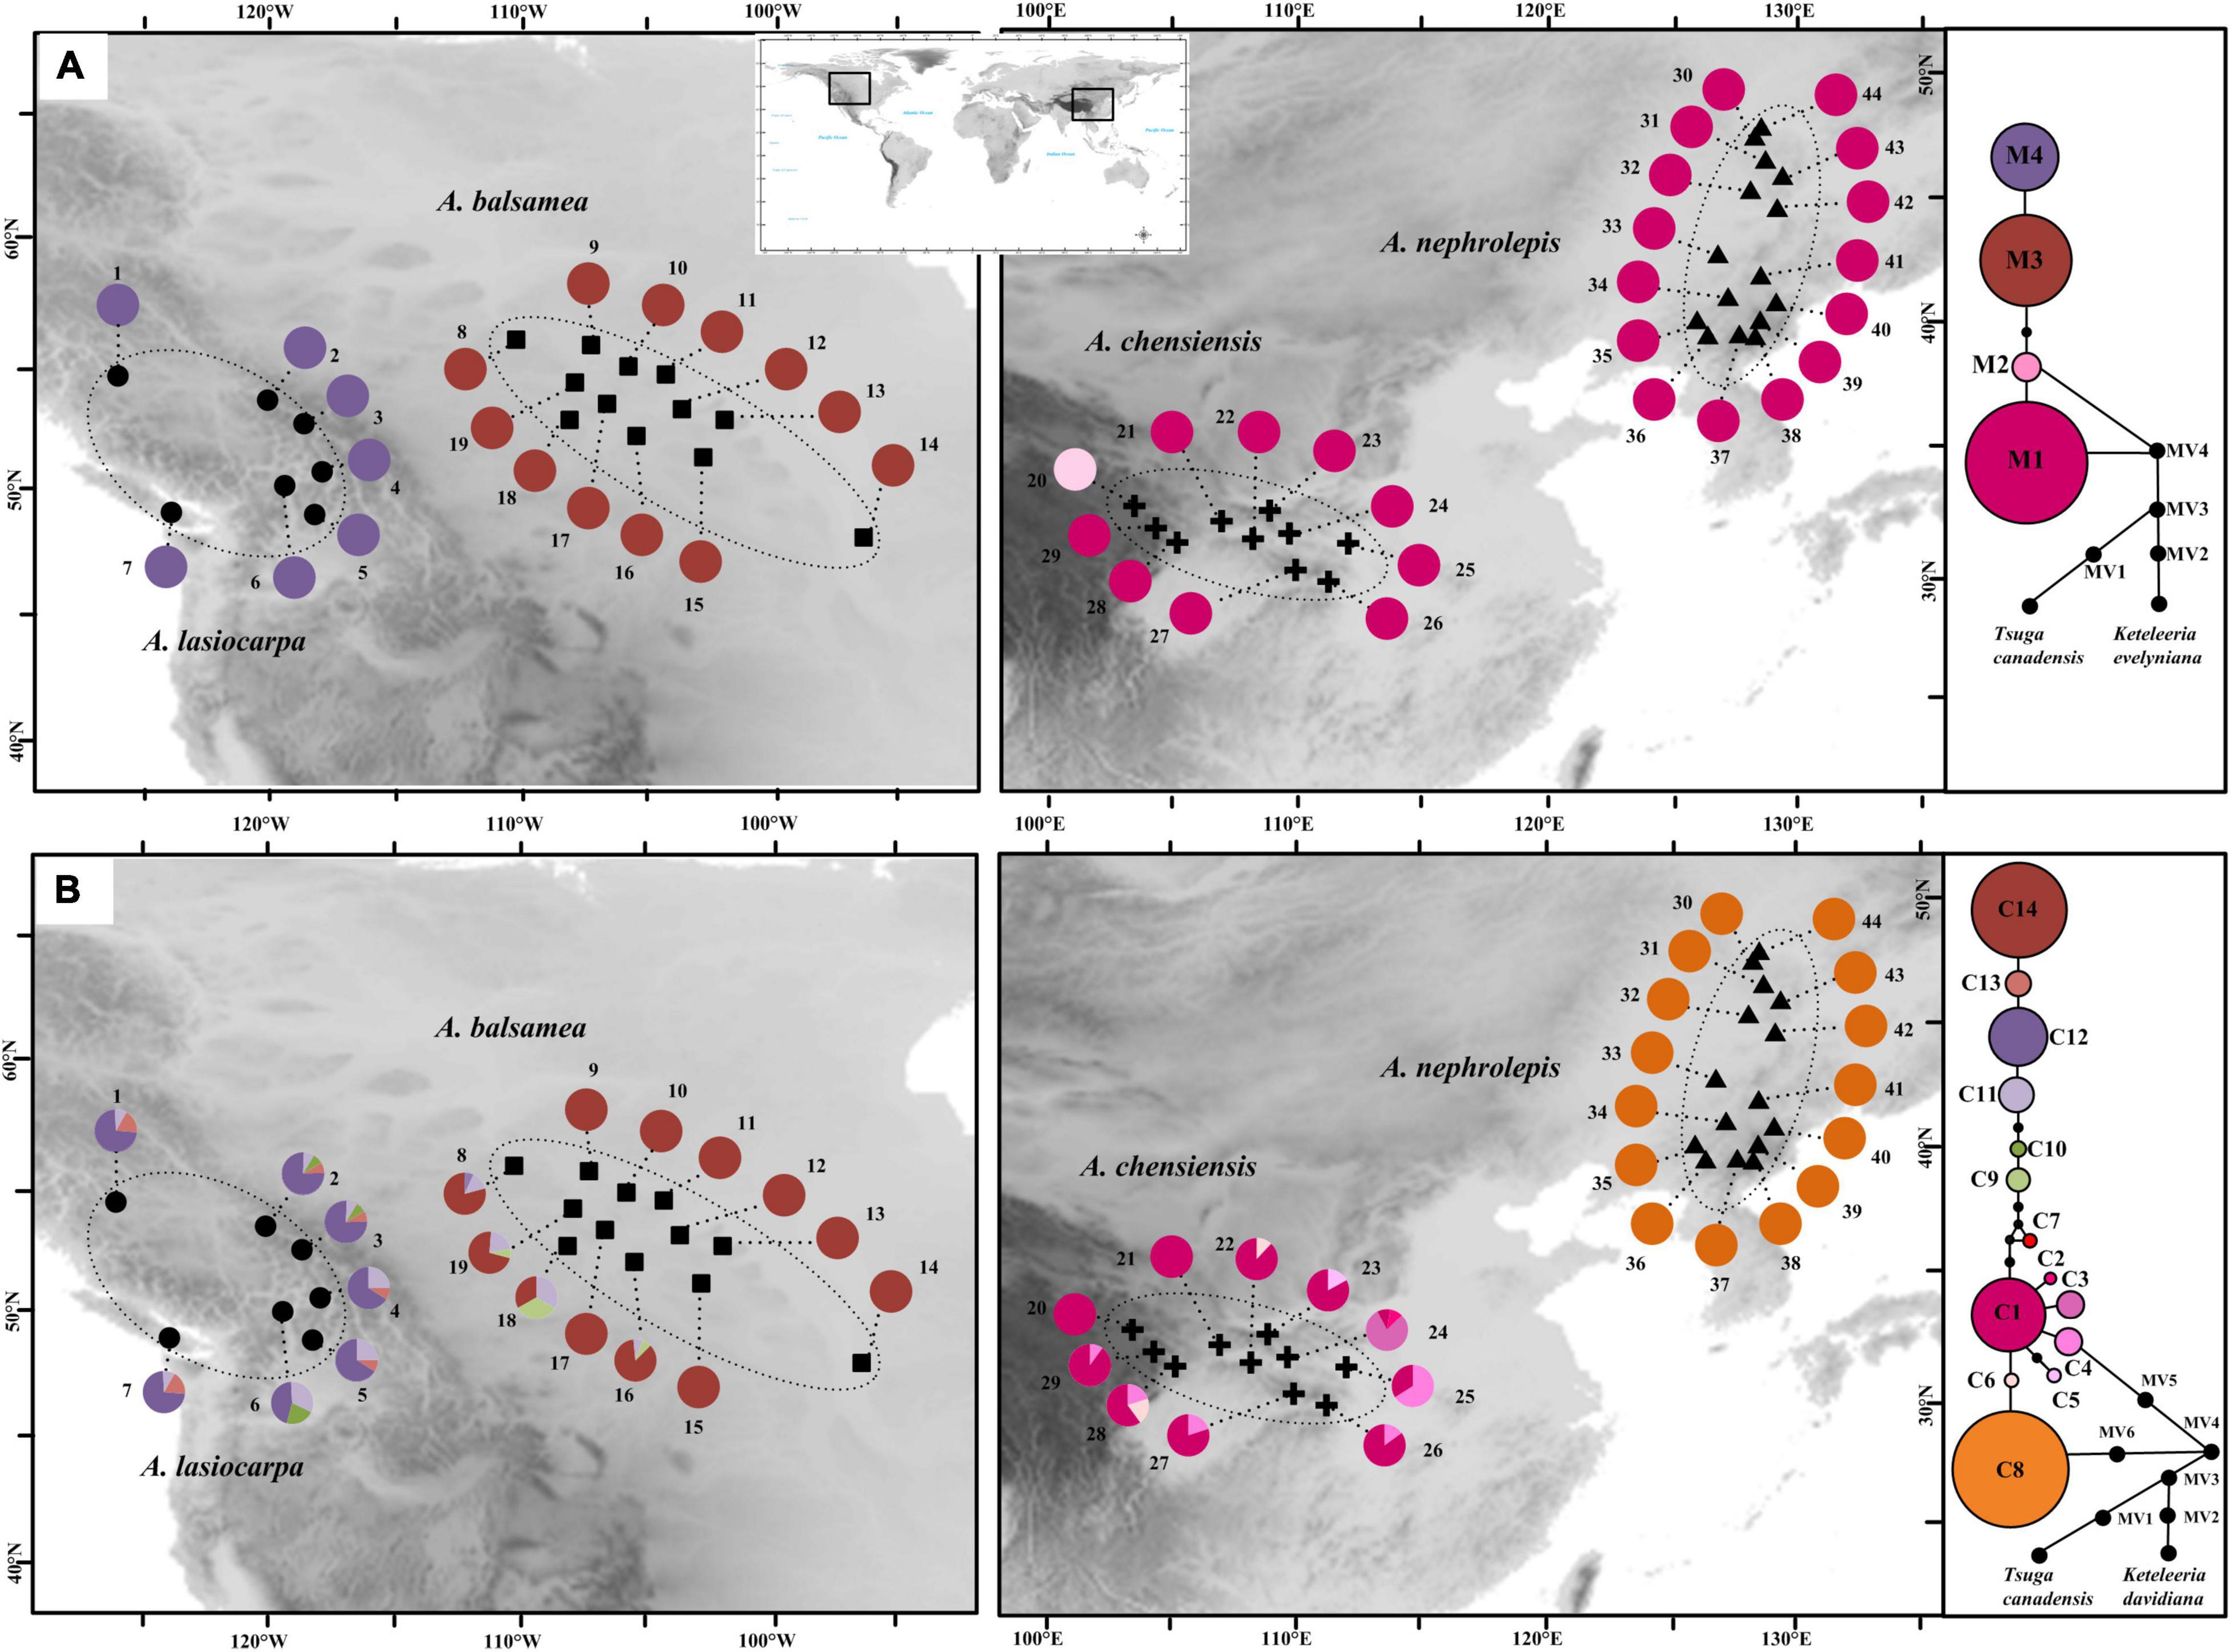
Figure 3. Geographic distribution and network relationships of mtDNA genotypes (A) and cpDNA genotypes (B).
Species Distribution Modelling
The occurrence data for the whole of geographic distribution range were calculated from field observations, the Global Biodiversity Information Facility,1 and the Chinese Virtual Herbarium.2 Although many herbarium records did not specify latitude and longitude, we were able to geo-reference detailed locations, using only locations specified in the label information. In total, after removing duplicate records within each pixel (30 arc s, ca. 1 km), we obtained 267 presence records (see Supplementary Table 4 for the list of all occurrences). These records involved 53 A. lasiocarpa records, 107 A. balsamea records, 64 A. chensiensis records, and 43 A. nephrolepis records.
The species distribution modelling (SDM) of these four firs was modelled using the MAXENT (version 3.2.1; Phillips et al., 2006). The environmental data were provided by the WorldClim database3 (Fick and Hijmans, 2017), including 19 BIOCLIM variables and three different periods in 30 arc s resolution. These different periods are current (for the period 1,950∼2,000) at a spatial resolution of 30 arc s, the last glacial maximum (LGM; ∼21,000 years BP) with a spatial resolution of 2.5 arc min resolution simulated under the CCSM and MIROC models, and the last interglacial period (LIG; ∼120,000–140,000 years BP) with spatial resolution in 30 arc s resolution. Following Zurell et al. (2020) and Nualart et al. (2021), we removed those highly correlated BIOCLIM variables (pairwise Pearson correlations, r greater than 0.8), seven variables were retained for subsequent analysis (bio2: mean diurnal range of temperature, bio4: temperature seasonality, bio5: the max temperature of warmest month, bio9: mean temperature of driest quarter, bio11: mean temperature of coldest quarter, bio16: precipitation of warmest quarter, bio17: precipitation of driest quarter). The pairwise Pearson correlations among 19 BIOCLIM variables were illustrated in Supplementary Table 5. Finally, the SDMs of these four firs under different periods were conducted in 100 replicate runs, maximum iterations (1500). To ensure the consistency of the model prediction, 70% of the localities were used to train the model and 30% were used to test it. The area under the curve (AUC) value was estimated to evaluate the model performance (Phillips et al., 2006). All predictions were visualised in ArcGIS v. 10.2 (ESRI, Redlands, CA, United States). The suitable areas (in km2) (l logistic value > 0.25) for all models at each time slice were also calculated in ArcGIS.
Results
Mitochondrial DNA Genealogy
The mtDNA nad5-4 was 246 bp in length. Four distinct mitotypes resulted from three point mutations and two indels (M1-4) (Supplementary Table 2). These four mitotypes were fixed in single species. Based on the NETWORK results, M1 and M2 were probably the ancestral haplotypes (Figure 3A). M1 and M2 were fixed in the East Asia species (A. chensiensis and A. nephrolepis) (Figure 3A). M3 and M4, which derived from M1 and M2, were exclusive to A. balsamea (Pop. 1–7) and A. lasiocarpa, respectively (Pop. 8–19).
The values of π and h were recorded in Supplementary Table 1. In AMOVA analyses, 95.17% mtDNA variation was scattered among species, and the HT was much higher than HS (Tables 1, 2). A significant phylogeographic structure of isolated geographic distributions were indicated (GST < NST; P < 0.05), and the geographic distances were remarkably related to mtDNA genetic diversity (r = 0.201, p = 0.037) (Table 2). In the SAMOVA analyses, there was no significant geographic division.

Table 1. The results of molecular variance analyses.
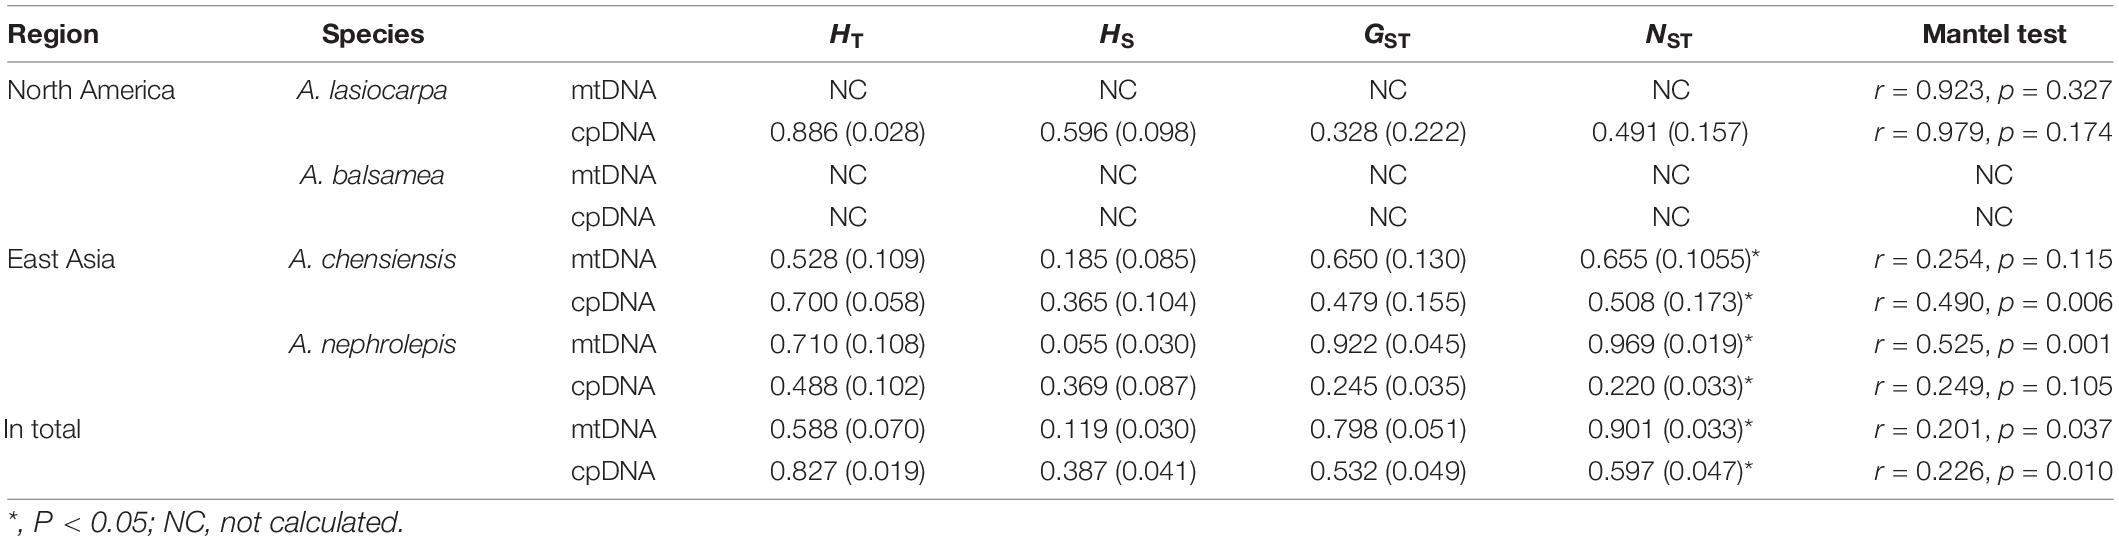
Table 2. The results of genetic diversity estimates and Mantel tests.
Chloroplast DNA Genealogy
In total, fourteen chlorotypes were resulted by nine substitutions and three indels (C1–14) (Supplementary Table 3). Among them, four chlorotypes had a frequency above 5% (C1, C8, C12, and C14), while twelve chlorotypes (C1–10 and C13–14) were fixed in single taxa. Moreover, C11 and C12 are shared two North American species (A. lasiocarpa and A. balsamea) (Figure 3B). Based on the NETWORK analysis, C1 and C8 might be the ancestral haplotypes (Figure 3B). In A. lasiocarpa and A. chensiensis, only one or two step mutations lain in the “star-like” network (Supplementary Figure 1).
In AMOVA analyses, 94.43% of the mtDNA variation was located among species, and the HT was much higher than HS (Tables 1, 2). A significant phylogeographic structure isolated geographic distributions were also indicated (GST < NST; P < 0.05). In our SAMOVA analyses, there was no significant geographic division, but the results of Mantel analyses indicated remarkable correlations between geographic distances and genetical distribution (r = 0.226, P = 0.010) (Table 2).
Compared to the mtDNA, higher genetic diversity appeared in the cpDNA genealogy (Figure 3 and Supplementary Table 1). Based on the Spads analyses on the species level, the mtDNA diversity did not show any latitudinal trend (Supplementary Table 1 and Figure 4). Based on π and h diversity, only one diversity centre was recognised in two low-elevation species (A. balsamea and A. nephrolepis), as three or two diversity centres were revealed in high-elevation species (A. lasiocarpa and A. chensiensis) (Figure 4).
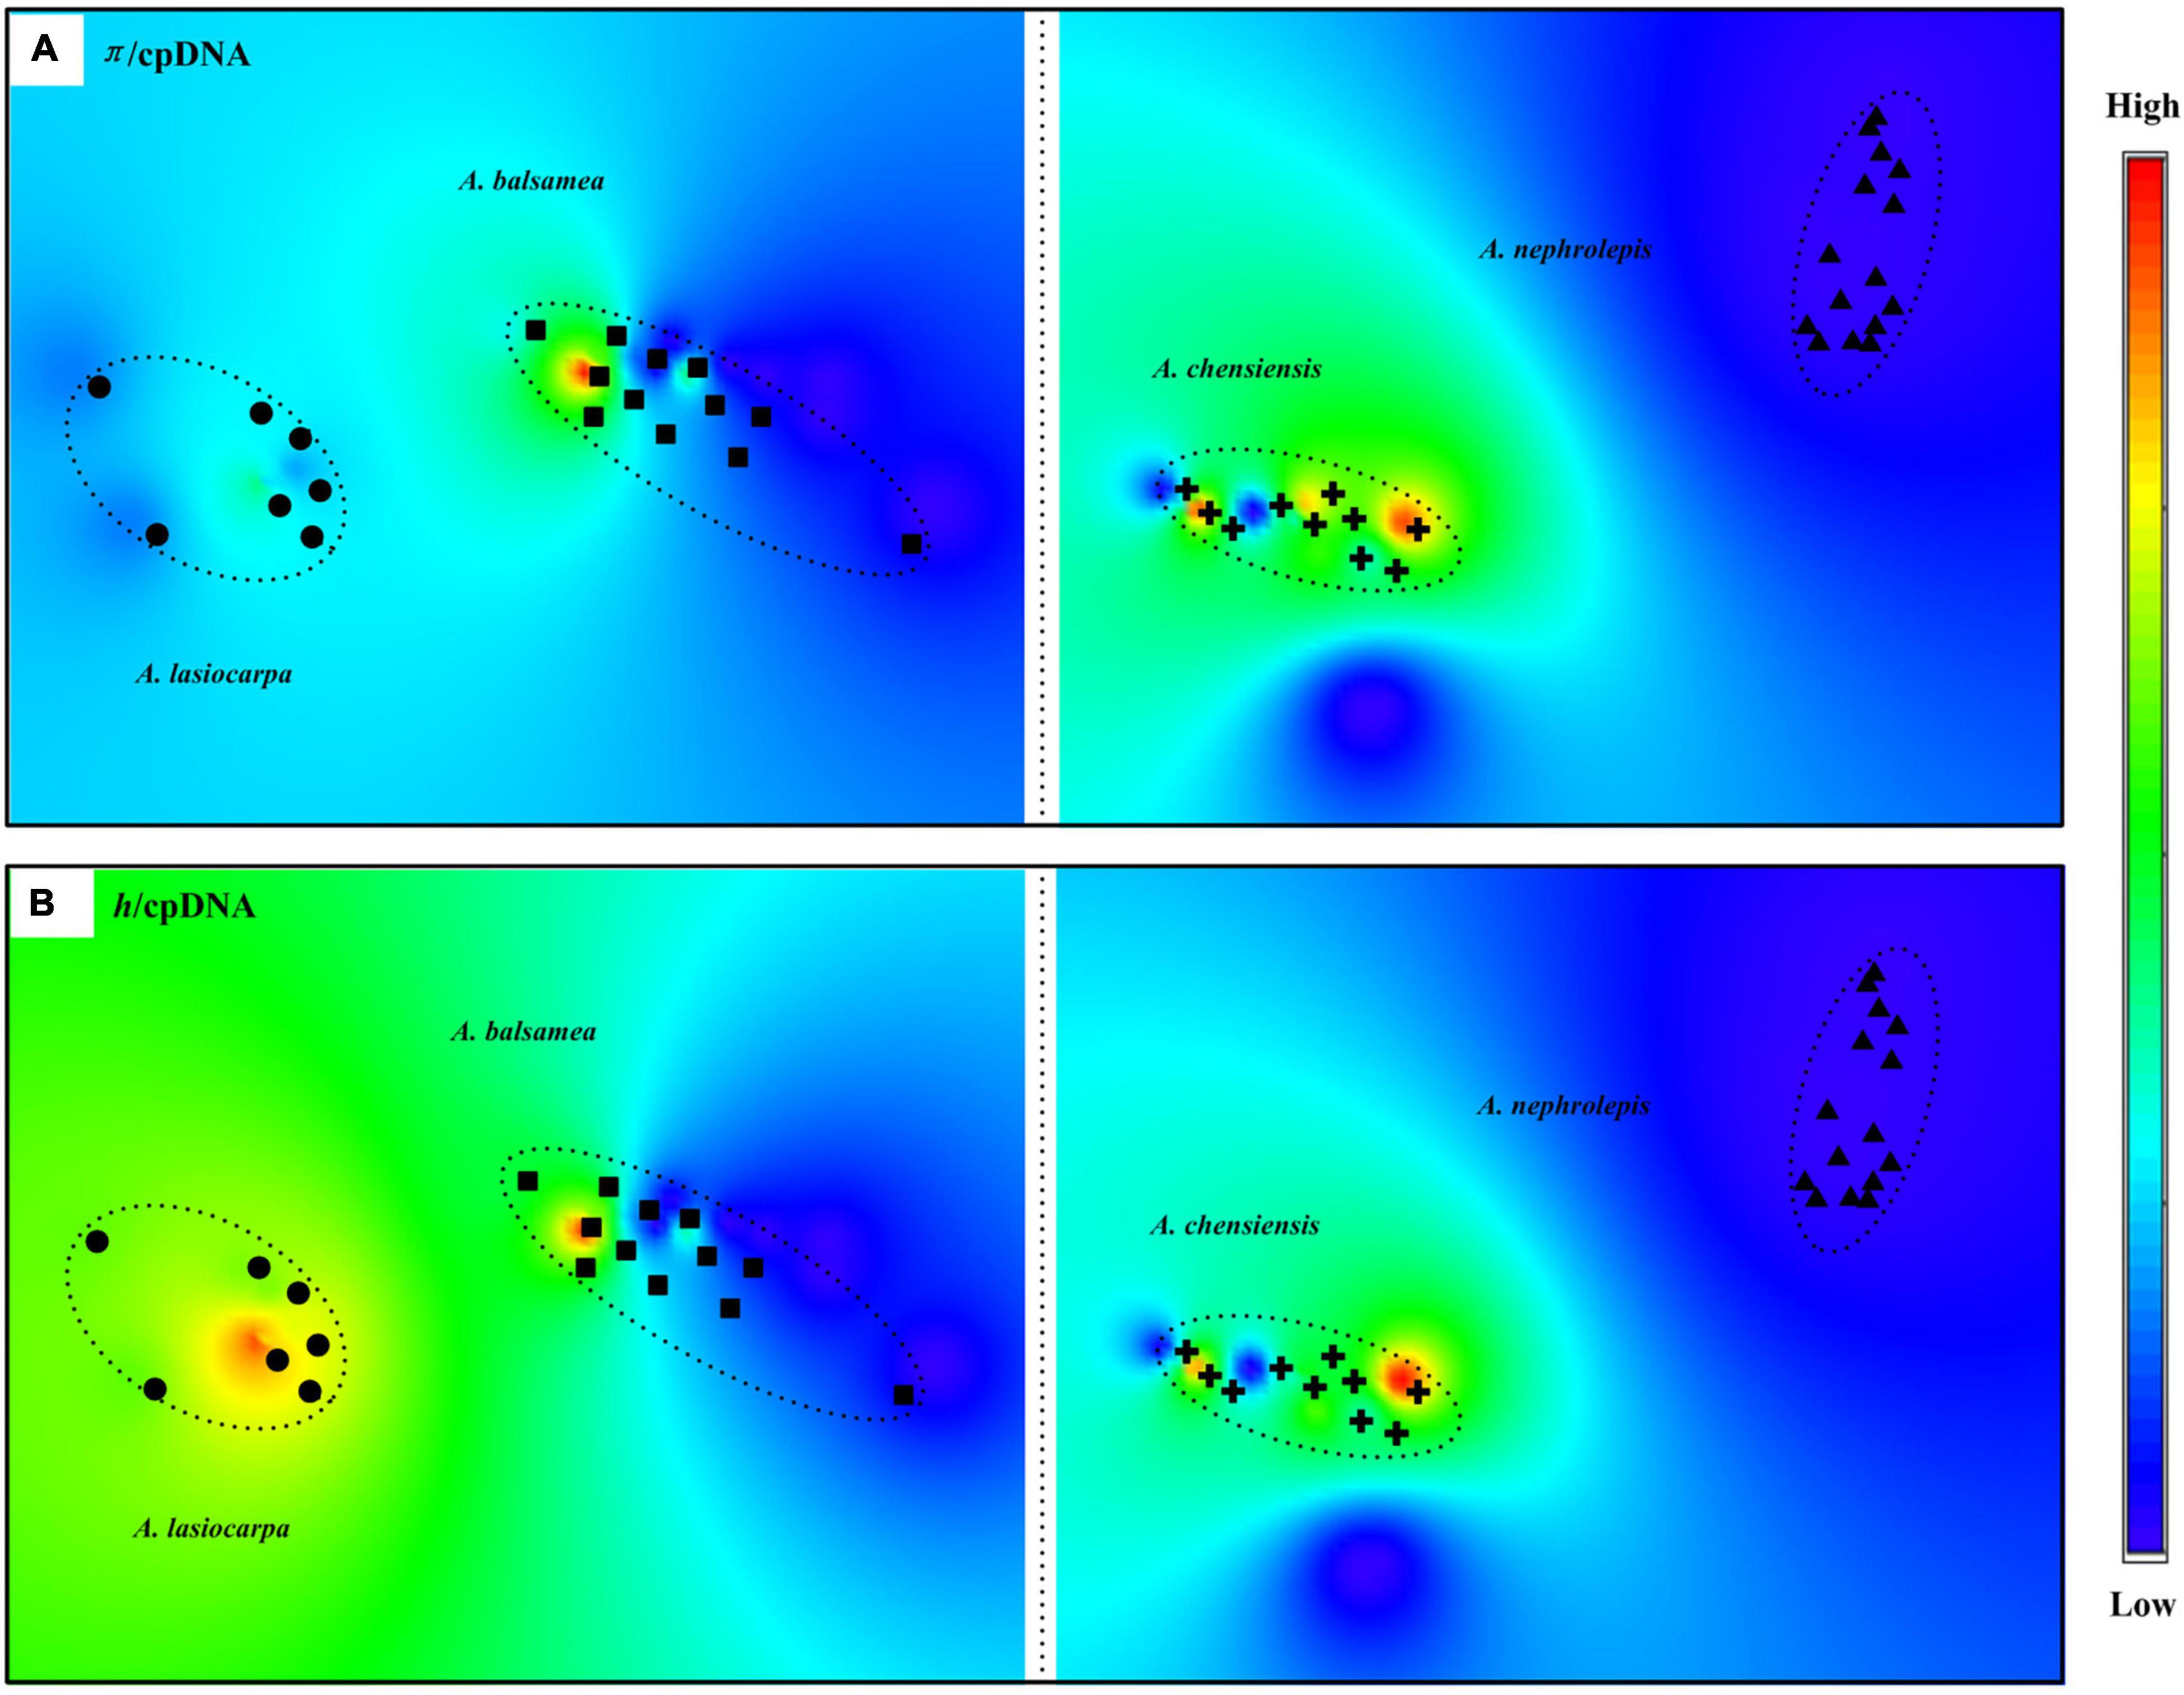
Figure 4. Genetic diversity of cpDNA haplotype across the range of the four fir species. (A) Distribution of cpDNA nucleotide diversity (π). (B) Distribution of cpDNA nucleotide diversity (h). X axis: longitude. Y axis: latitude.
Species Demographic History
The analyses of mismatch distribution were performed on species level using cpDNA sequences. In total, three species were included in the comments (A. lasiocarpa, A. balsamea, and A. chensiensis), excluded A. nephrolepis because of the low cpDNA variation (Variation of cpDNA = 0; Table 1).
Our mismatch distribution results did not support the historical expansion hypothesis of A. balsamea (PSSD = 0.020) (Supplementary Figure 2). Unlike A. balsamea, the expansion hypothesis was supported in two high-elevation firs, including A. lasiocarpa (PSSD = 0.147) and A. chensiensis (PSSD = 0.734) (Supplementary Figure 2). Further, our results estimated the relevant expansion periods of A. lasiocarpa in 43.8–28.4 kya (option 1: g = 25 years) or 21.9–14.2 kya (option 2: g = 50 years) (Figure 5 and Table 3). Moreover, the historical expansion of A. chensiensis probably occurred in 53.1–34.5 kya (option 1) or 26.6–17.2 kya (option 2).
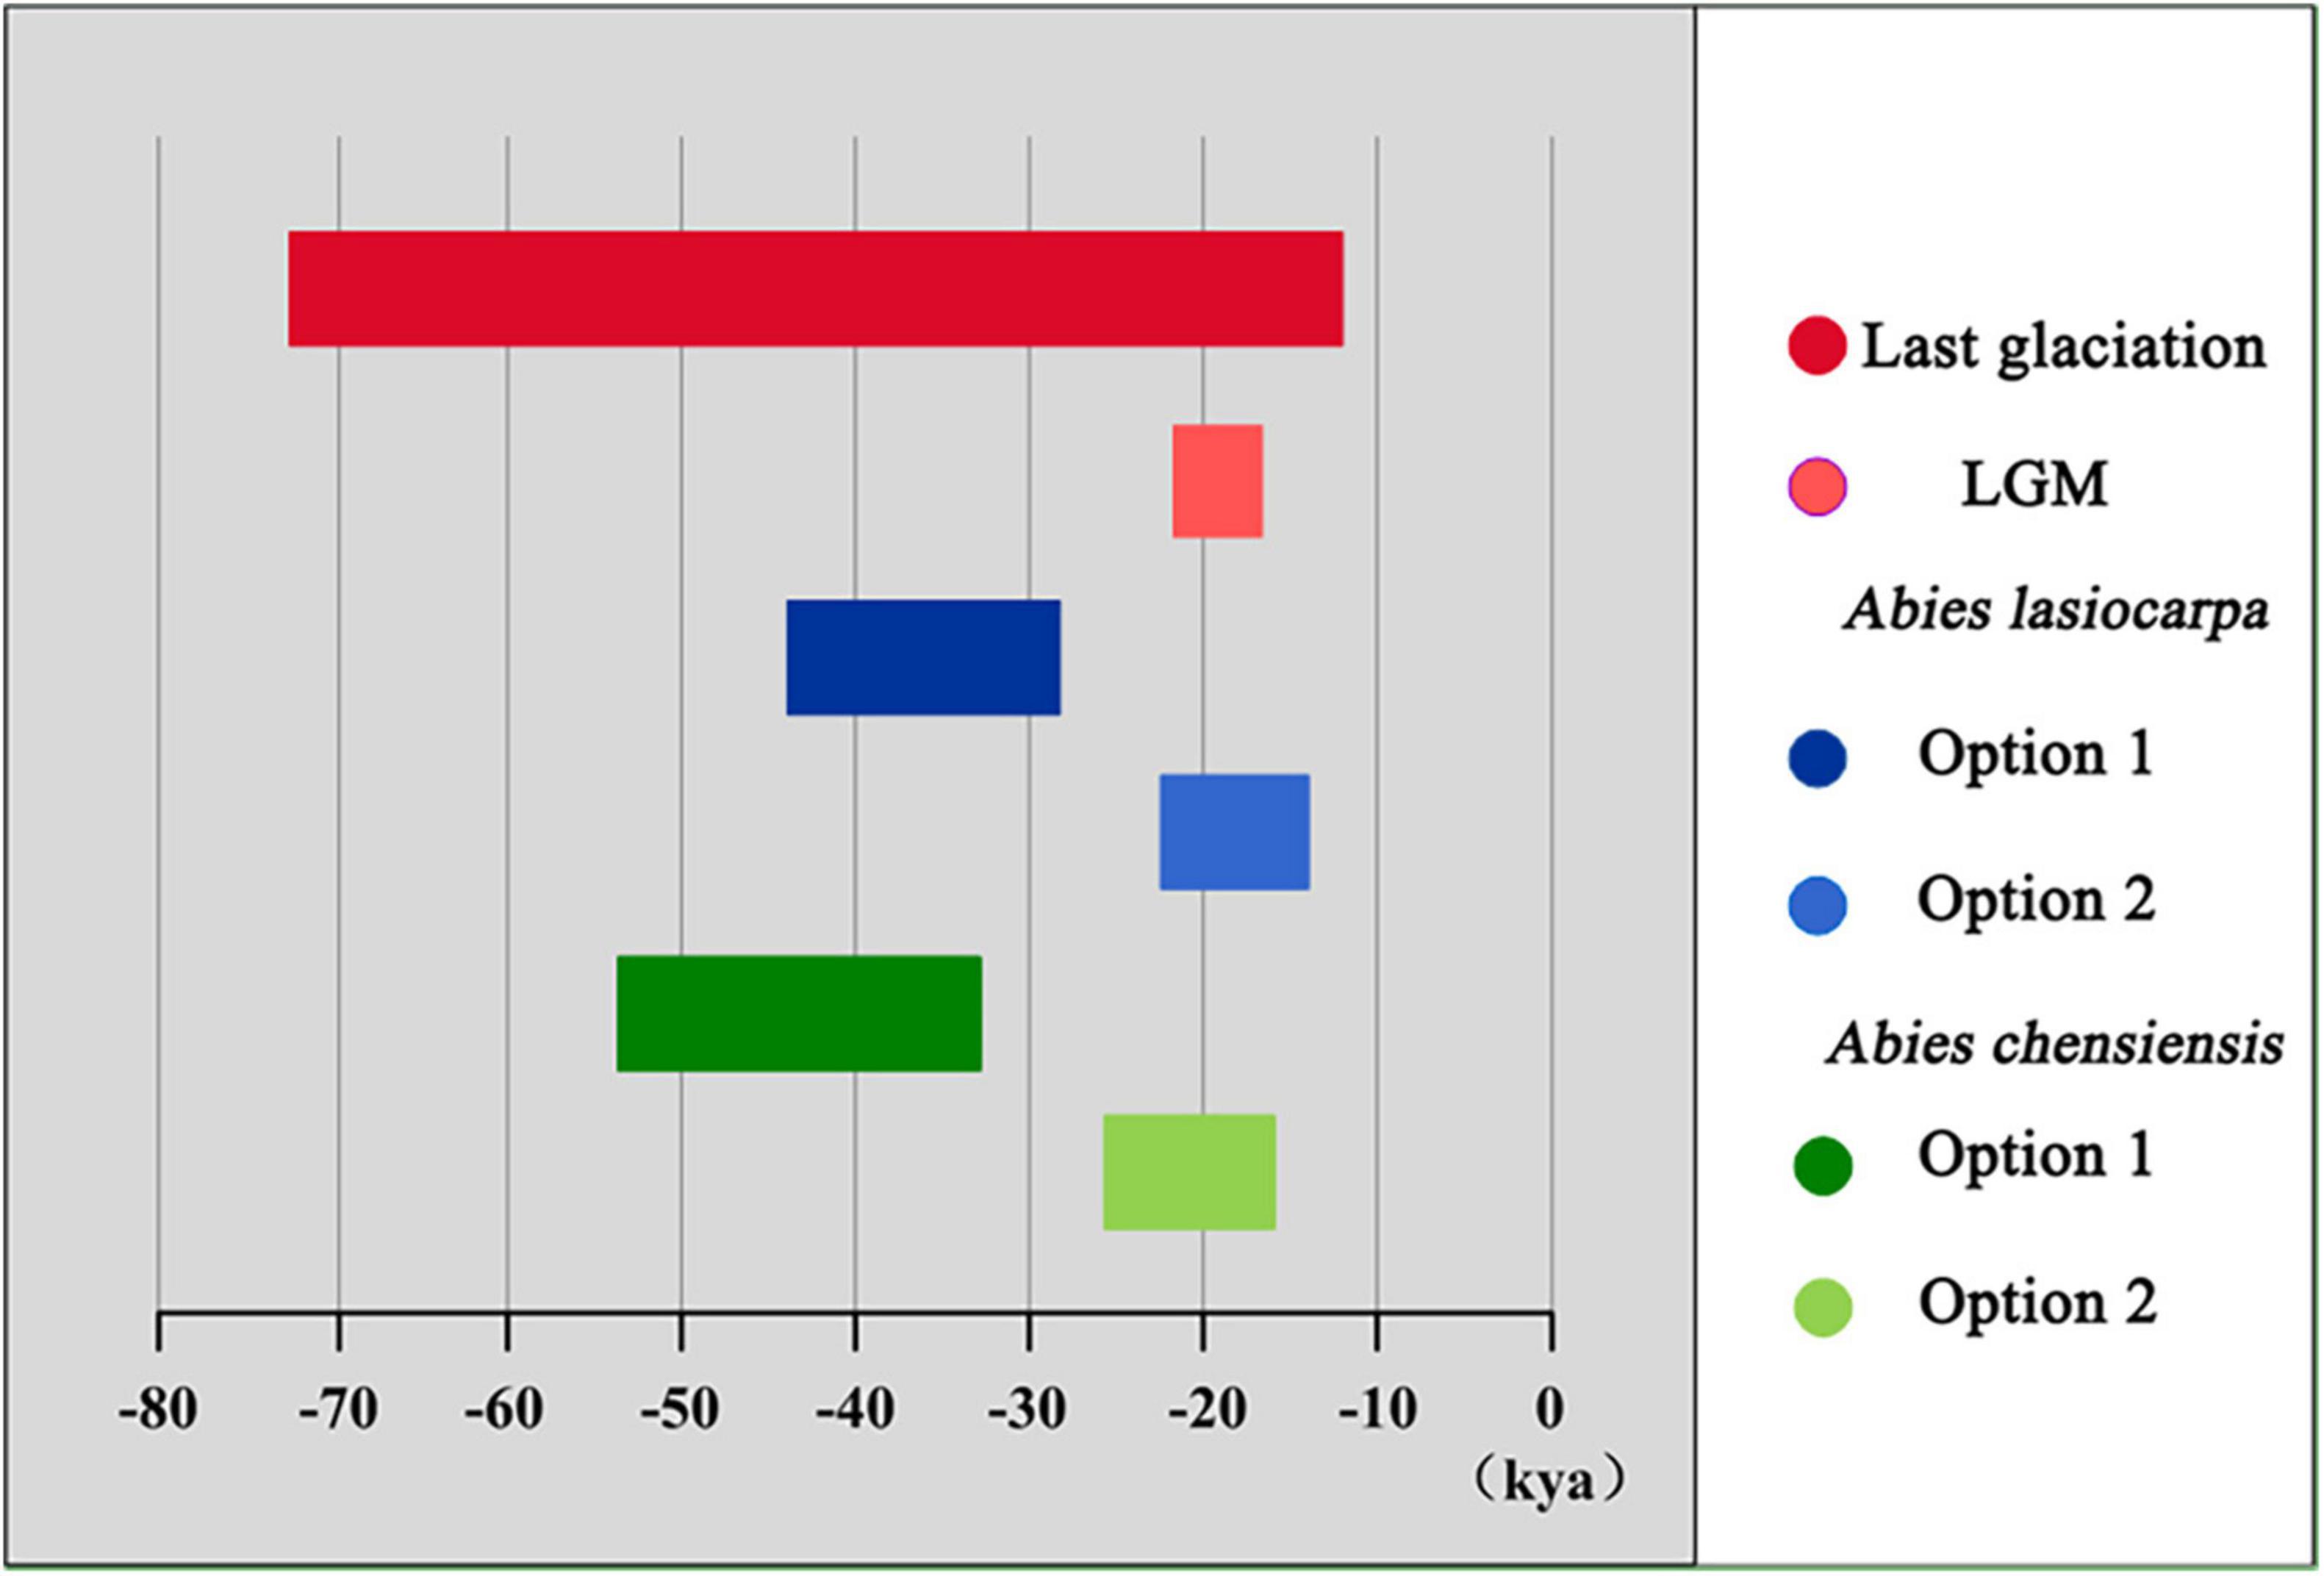
Figure 5. Duration of recent range expansions detected in two high-elevation firs (A. lasiocarpa and A. chensiensis).
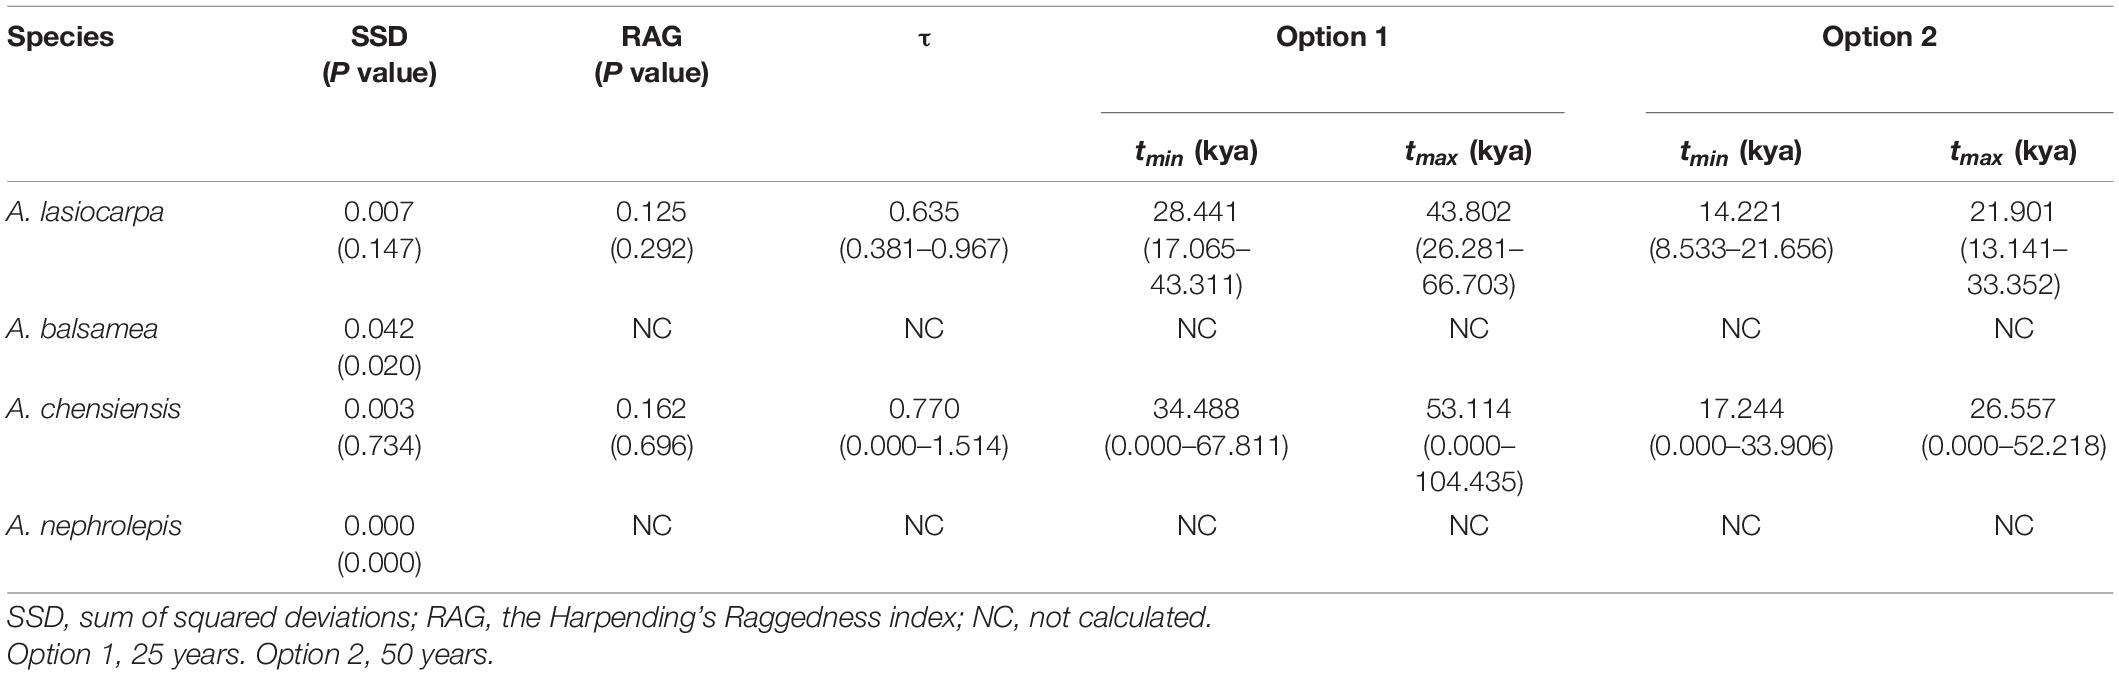
Table 3. The results of mismatch distribution analysis based on cpDNA sequence.
Species Distribution Modelling
The SDMs were built for four firs, separately, based on seven environmental variables under the present climate, the LGM (CCSM), the LGM (MIROC) and the LIG, respectively. All SDMs had high AUC values (greater than 0.9), indicating that the model predictions were much better than the chance (AUC = 0.5). The area of potential habitats, after accounting for uncertainty, was calculated using the logistic value > 0.25 (Table 4).
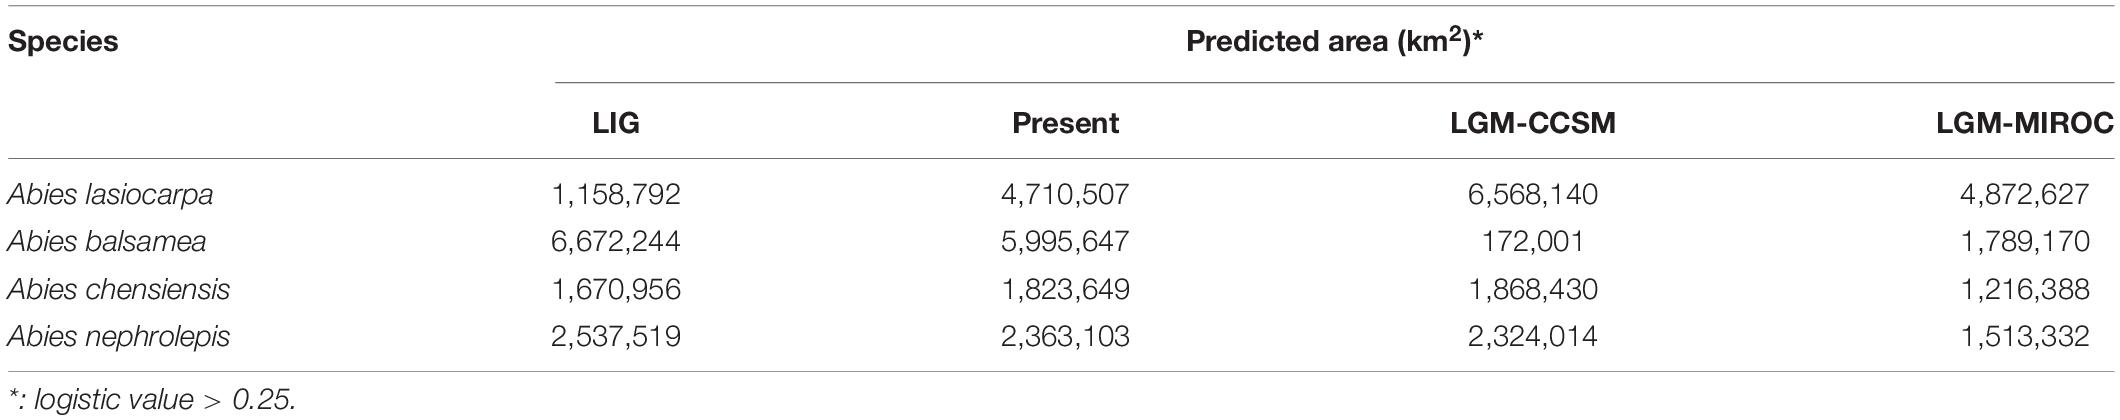
Table 4. Predicted potential distribution of four fir species during different time periods.
In North America, models for A. lasiocarpa showed a heavily decrease of suitable habitats while global warming, from the LGM (CCSM) (6,568,140 km2) to the present (4,710,507 km2) to the LIG (1,158,792 km2) (Figure 6A and Table 4). The potential habitats for the LGM (MIROC) (4,872,627 km2) were almost the same as the habitats under the current climate. These models predicted the lowest distribution areas under the warmest climate during the LIG. Models for A. balsamea showed obviously range expansion when global warming, from the LGM (CCSM) (172,001 km2) and LGM (MIROC) (1,789,170 km2) compared to the LIG (6,672,244) and present (5,995,647 km2) (Figure 6B and Table 4). In addition, the suitable habitat of A. balsamea during the LGM was distributed more southerly than the LIG and present models.
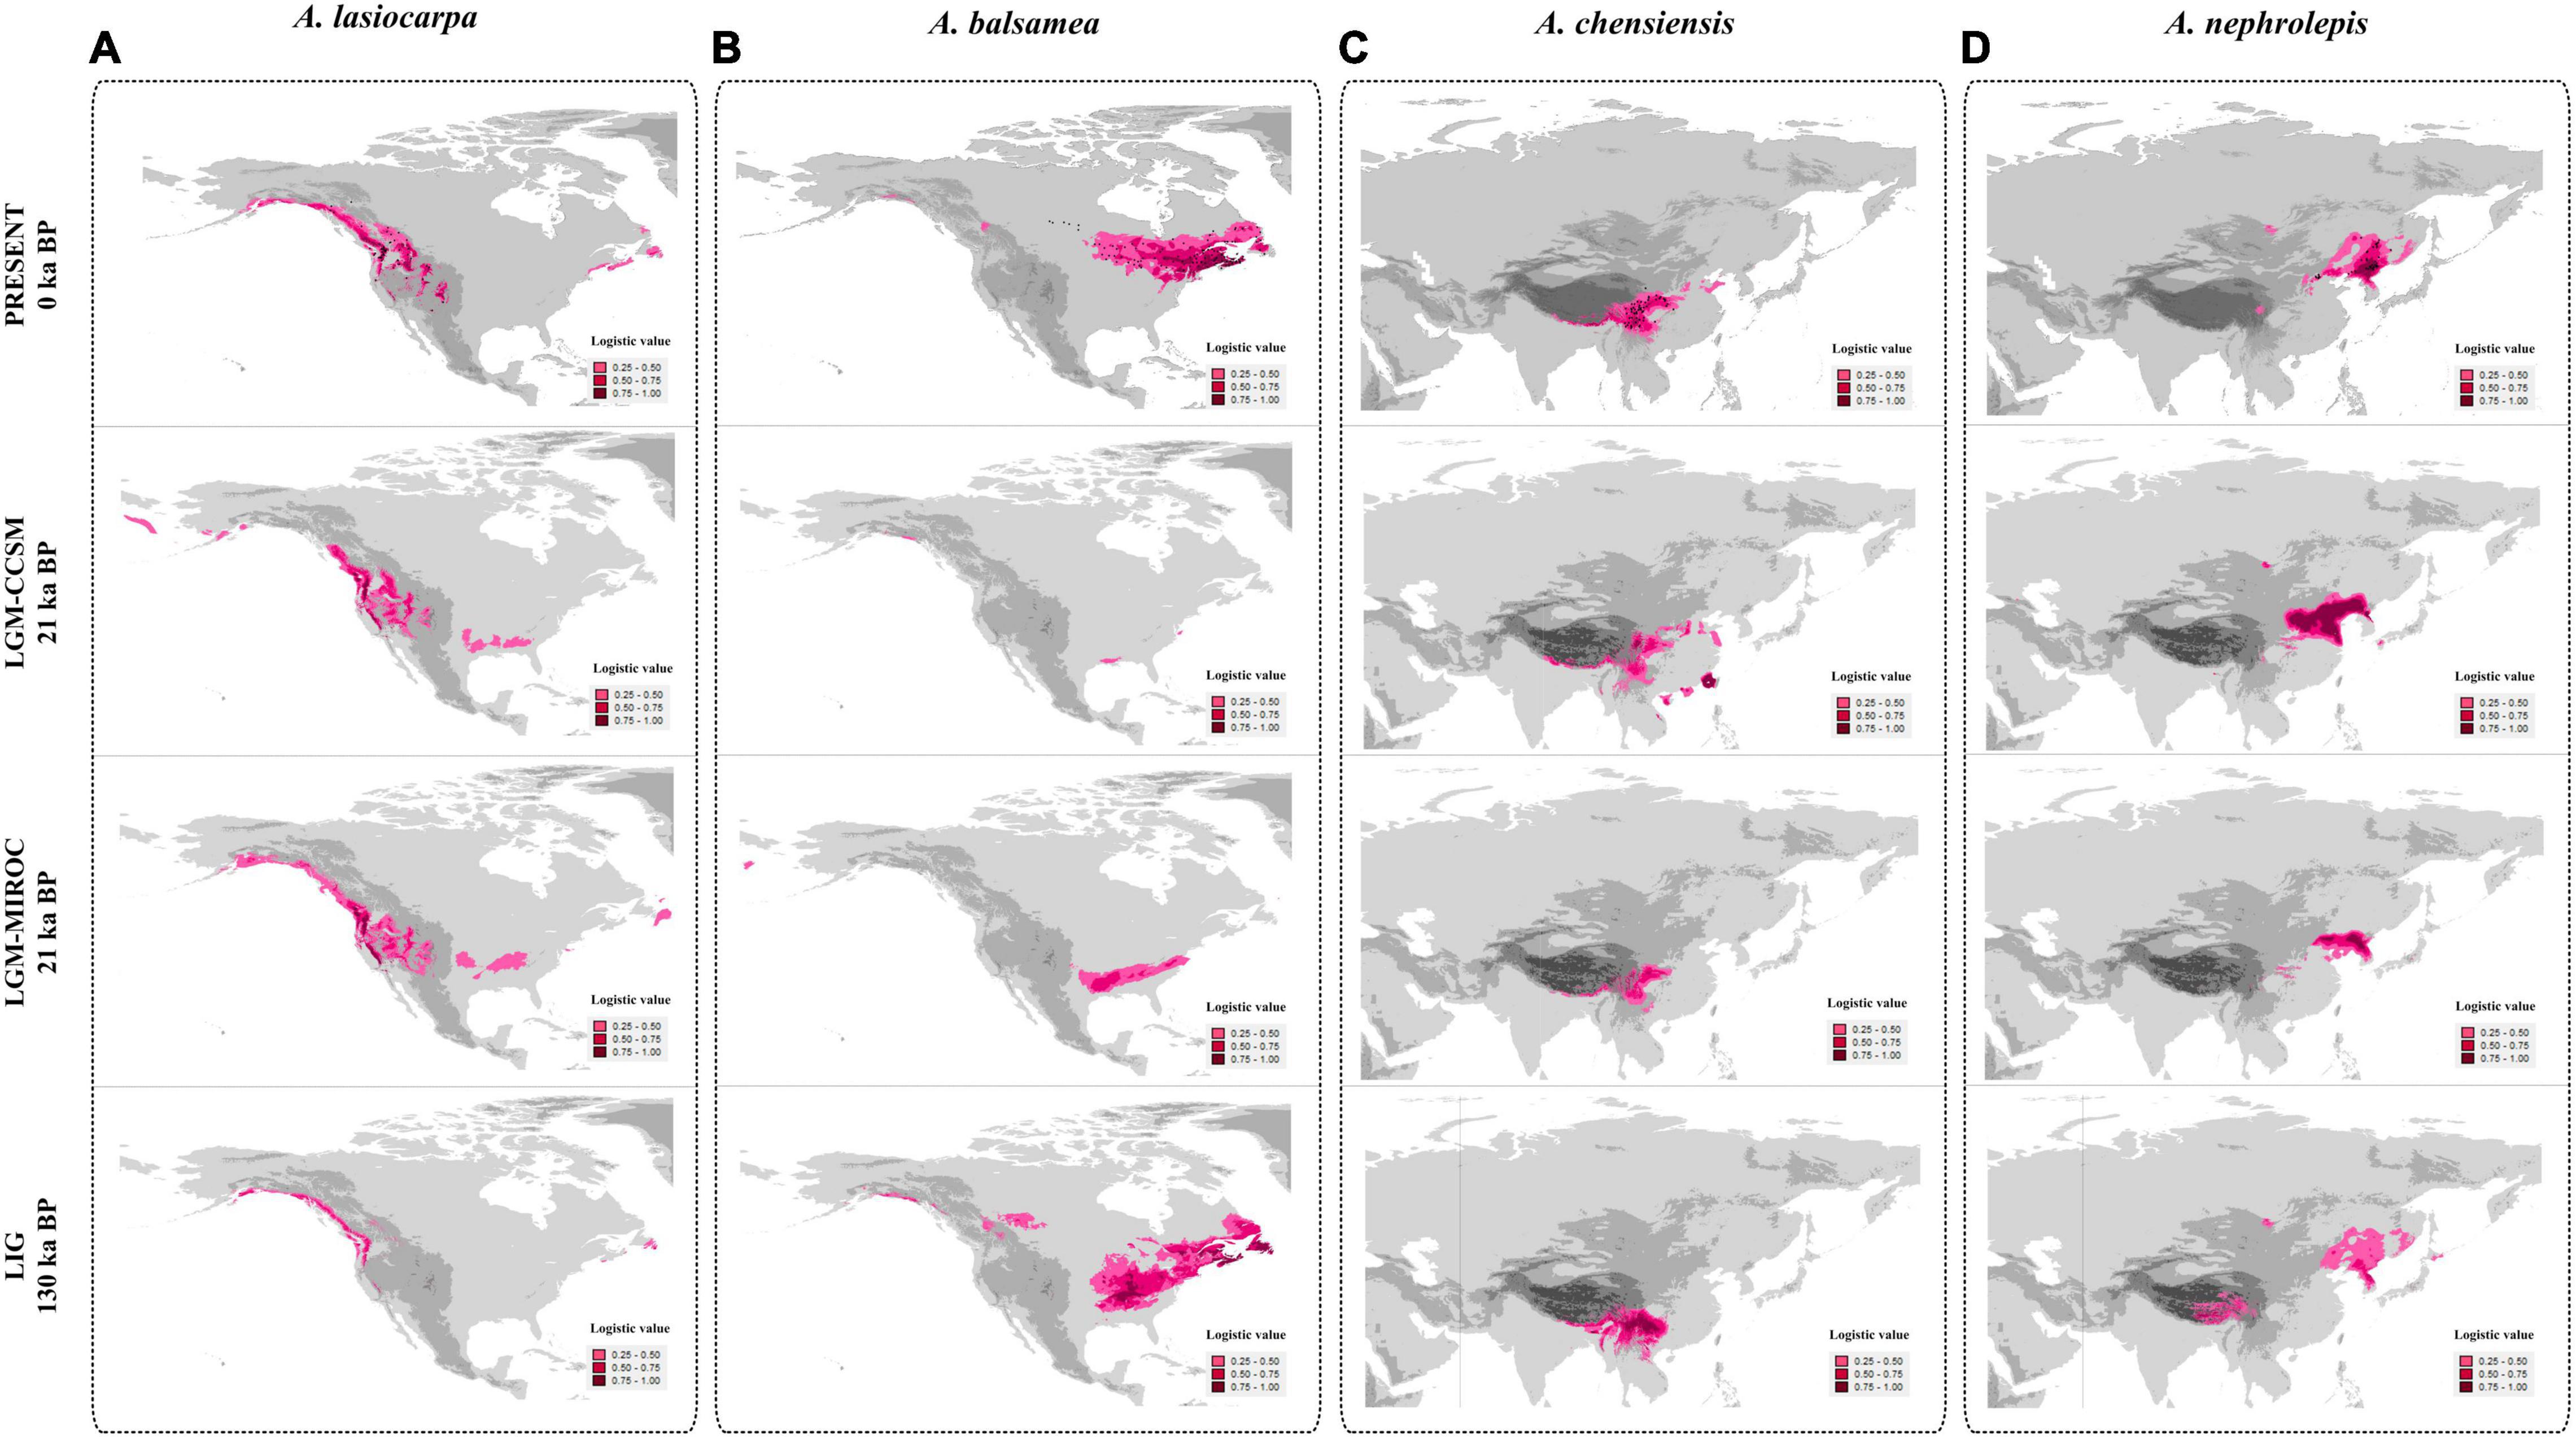
Figure 6. Species distribution modelling of four fir species. A. lasiocarpa, A. balsamea, A. chensiensis, and A. nephrolepis are presented in panels A–D, respectively. Black dots presents the occurrence records used in the analyses.
Compared to A. lasiocarpa and A. balsamea in North America, the suitable habitat shifting within A. chensiensis and A. nephrolepis in East Asia were unremarkable. For A. chensiensis, the models showed a slightly decreasing of suitable habitat while global warming, from the LGM (CCSM) (1,868,430 km2) to the present (1,823,649 km2) to the LIG (1,670,956 km2) (Figure 6C and Table 4). However, the LGM (MIROC) model (1,216,388 km2) was relatively smaller than others. And its potential habitats shifted along latitude during different periods. For A. nephrolepis, the models showed a slightly expansion of suitable habitat while global warming, from the LGM (CCSM) (2,324,014 km2) to the present (2,363,103 km2) to the LIG (2,537,519 km2) (Figure 6D and Table 4). But the LGM (MIROC) model (1,513,332 km2) was also relatively smaller than others. Moreover, the LGM (MIROC) models were quite different from the LGM (CCSM) models in three firs except for A. balsamea. Unlike the LGM (MIROC) models, the LGM (CCSM) models were consistent with the expansion or contraction trends from the LIG to the present models.
Discussion
Glacial Expansion of High-Elevation Firs and Interglacial Expansion of Low-Elevation Firs
Previous studies concerning arctic-alpine species in Northern Hemisphere indicate two distinct expansion hypotheses in response to global climate change. These two proposed hypotheses have never been simultaneously documented in comparable high-low elevations or distinct continents (Moritz and Agudo, 2013; Theodoridis et al., 2017; Lin et al., 2021). Using four closely related firs, this study evaluated their significance on distinct elevations and continents for the first time.
Our results certainly supported the glacial expansion of high-elevation firs and interglacial expansion of low-elevation firs, either in North America or East Asia. Firstly, recent expansions were revealed in two high-elevation firs (A. lasiocarpa, PSSD = 0.147; A. chensiensis, PSSD = 0.734), but not in A. balsamea (PSSD = 0.020) (Supplementary Figure 2). Similar analyses were not performed in A. nephrolepis because of its extremely low cpDNA variation (Table 1). Such recent expansions were confirmed by the Networks of chlorotypes. The chlorotypes of A. lasiocarpa and A. chensiensis showed a “star-like” pattern, which could be interpreted as characteristic of recent population expansions (Supplementary Figure 1; Hwang et al., 2003; Shao et al., 2020). Furthermore, the recent expansions’ age of A. lasiocarpa and A. chensiensis were estimated to be around 43.8–28.4 kya and 53.1–34.5 kya (option 1: g = 25 years), or 21.9–14.2 and 26.6–17.2 kya (option 2: g = 50 years), respectively (Table 3). It should be noted that the above time durations were highly consistent with the last glaciation of East Asia and North America (Figure 5). In East Asia and North America, the last glaciation was believed to occur around 73–10.4 kya, accompanied by maximum glacial around 21–18 kya (Hewitt, 1996, 2000, 2004; Yi et al., 2004). To be mentioned, potential genetic variation within continuous range species (A. balsamea and A. nephrolepis) might be difficult to capture for the generally low-variable in plastid markers. However, even though only two makers were used, they were almost the most informative sites available in the phylogeographical analyses of the genus Abies so far (Cinget et al., 2015a,b; Shao and Xiang, 2015; Shao et al., 2017, 2020). Similar analyses had all been successfully conducted in previous related studies (Cun and Wang, 2010; Shao and Xiang, 2015; Shao et al., 2017, 2020).
Our SDM models also depicted historical glacial expansions in high-elevation firs and interglacial expansions in low-elevation firs. The LGM (MIROC) models were quite different from the LGM (CCSM) models in three firs except for A. balsamea (Figure 6 and Table 4). Till now, the incongruence between the LGM (MIROC) and LGM (CCSM) had been widely surveyed (Guevara et al., 2019). The MIROC estimated noticeably more different climatic conditions than CCSM and suggested a remarkable different prediction of potential distribution (Rico et al., 2021). Compared to the LGM (MIROC), the LGM (CCSM) model was much more effective and widely used in related Pinaceae species, such as the East Asian white pines (Liu et al., 2022). In this study, the LGM (CCSM) models were highly consistent with the expansion or contraction trends from the LIG to the present models. For A. lasiocarpa and A. chensiensis, the distribution area estimations showed that the distribution range was more extensive in glacial period (the LGM CCSM) than in interglacial periods (the LIG and present) (Figures 6A,C). For A. balsamea and A. nephrolepis, the distribution range was reduced in glacial period (the LGM CCSM) than in interglacial periods (the LIG and present) (Figures 6B,D). These results suggested that A. lasiocarpa and A. chensiensis underwent expansions from the LIG till the LGM during global cooling and extensive reconstructions from the LGM to the present. Such patterns were also determined in the future geographic distribution modelling of four endemic fir species in Japan (Tanaka et al., 2012). In the context of global warming, three Japanese higher-elevation distributed firs (Abies mariesii, Abies veitchii, and Abies homolepis) were predicted to lose 45% suitable habitat but greater than 73% for lower-elevation distributed firs (Abies firma). Moreover, unlike North America, the habitat shifting in East Asia were unremarkable (Figure 6 and Table 4). For A. chensiensis and A. nephrolepis, the models showed slightly expansion or contraction of suitable habitats during different time periods. Such distinct spatial patterns could be explained by the difference in Quaternary climate between East Asia and North American (Shi et al., 1987; Shi, 2002). During Quaternary climatic fluctuations, North America has been repeatedly covered by large continuous ice sheets during glaciations, and only a few montane glaciers or valley glaciers occurred in East Asia regions. Our models indicated that the Asian range of the genus Abies was characterised by much more stable conditions, which might have facilitated the survival of many woody species that represent genera with highly disjunct distribution (e.g., Aesculus, Pterocarya, Fagus, Castanea) survived in East Asia (Zhang et al., 2020; Song et al., 2021).
The geographical distribution of genetic diversity could be another direct independent evidence. To distinguish interglacial and glacial expansion hypotheses, Hewitt (1996) proposed two different expansions models. One is the model of pioneer expansions, charactered by interglacial expansion hypothesis, which predicted along-latitude decreasing of genetic diversity while historical expansion (Hewitt, 2004). Another is the model of phalanx expansions, charactered by glacial expansion hypothesis, indicated along-elevation historical expansions, resulting in multiple diversity centres and no latitude trends (Oliveira et al., 2021; Wyatt et al., 2021). Based on current phylogeographical patterns, multiple diversity centers were revealed in only A. lasiocarpa and A. chensiensis, indicating no latitude decreasing trends (Figure 4). Thus the phalanx expansion model was probably activated in these two high- elevation firs. It should be noted that such pattern could also result from the fact that the isolation between potential refugia in the lowlands was less than in the mountains, which may have resulted in homogenization after the expansion period (Liu et al., 2022).
Moreover, the palynological records could be another convincing proof of species’ preferred past climatic conditions. In North America, the southernmost paleo records of A. lasiocarpa were US Rockies and Oregon, and could be its putative glacial refugia (Barnosky, 1981). Based on published macrofossils, A. lasiocarpa was originated in the Pleistocene and much common in the lower elevation regions, including Vancouver Island and Washington state (Bartlein et al., 1998; Cinget et al., 2015b). Nowadays, those lower elevation regions are dominated by Abies amabilis and Abies grandis (Farjon, 2001). For Abies balsamea, the palynological records reflected post-glacial migration from the refugium in southern and western Great Lakes towards central Alberta (Cinget et al., 2015a). In East Asia, numerous published palynological researches inferred a similar pattern (Xu et al., 1980, 2002; Cook et al., 2011). During interglacial periods, the pollen abundance in the high-elevation regions was obviously decreased in Eastern Asia (Tang et al., 2007; Yong et al., 2020). Indeed, those high-elevation fir species in central China (e.g., A. chensiensis) distributed more commonly in lowland forests during the LGM as the temperature decreased about 6–10°C (e.g., Li et al., 2019). Zhao et al. (2014) reported several remarkable impacts of repeating climate fluctuations since the LGM on the distribution of Abies in the mountaintop regions of central China, with obviously decreasing continuously with climate change from humid and cold (glacial) to dry and warm (interglacial). In addition, almost all the critically endangered Abies worldwide are restricted in the mountain top (Farjon, 2001; Xiang, 2001). Such current distribution pattern could be living evidence of interglacial fragmentation in high-elevation firs. Even though the significant deforestation during past decades, these critically endangered Abies species had never been the main targets for their high-elevation distribution in mountain tops and far away from human settlements (Fan, 2006). Thus climate-driven distribution changes and low seed viability could be the most critical factors.
In summary, the above results of five independent evidence lines, involving geographic-driven genetic patterns, mismatch distribution analysis, species distribution modelling, palynological records, and current distribution pattern, were highly uniform and reliable. Our findings supported the glacial expansion hypotheses of high-elevation firs and interglacial expansion hypotheses latitudinal of low-elevation firs during the Quaternary climate change in North America and East Asia.
The ex-situ Conservation of Critically Endangered Firs
The genus Abies Mill. (Pinaceae) discontinuous distributed in North America, Eastern Asia, and Europe (Xiang et al., 2018). Fir species are ecologically, and economically important plants that are dominant in Taiga and mountain conifer forests which maintain water and soil, protect the ecological environment, and conserve the biodiversity in the region (Farjon and Rushforth, 1989). However, eleven firs had been listed as endangered or critically endangered species (Xiang, 2001; International Union for Conservation of Nature [IUCN], 2021). Thus it is urgent to develop efficient conservation planning.
The primary goal in conservation biology is to determine how species respond to climate change, which generated conservation units to define (Petit et al., 1998). At present, all the endangered fir species had an extremely high elevation habitat (>1000 m), which was quite different from the two low-elevation firs used in this study (A. balsamea: 0–1700 m, A. nephrolepis: 0–1200 m) (Farjon, 2001). Furthermore, six fir species were listed as critically endangered (Abies beshanzuensis, Abies yuanbaoshanensis, Abies fanjingshanensis, Abies ziyuanensis, Abies fansipanensis, and Abies numidica) (Fu, 1992; Xiang, 2001; International Union for Conservation of Nature [IUCN], 2021). Their distribution ranges were restricted in limited mountain tops and extremely low effective breeding size. The critically endangered status might be resulted by historical rapid recolonization via elevational shifting in situ, following severe bottleneck effects (Cinget et al., 2015a,b; Jiang et al., 2015; Shao et al., 2020). Such evolutionary progress should not be constrained. For high-elevation firs, with A. lasiocarpa and A. chensiensis as example, more than one diversity centers were depicted (Figure 4). These different diversity centers and genotypes drawn from different populations cannot be ignored. For conservation purposes, it is necessary to define conservation units on an evolutionary level for these endangered firs.
In the context of global warming, our results showed that the high-elevation firs in Northern Hemisphere had undergone glacial expansion via elevational shift, which led to massive habitat fragmentation or isolation. Under this situation, the suitable habitat of high-elevation Abies could have begun to lose continually since the LGM and quicken steps, as depicted in the SDMs of A. lasiocarpa and A. chensiensis (Figure 6). Suitable habitats of these endangered Abies species continued to deteriorate, and the surviving individual numbers were continuously decreased (Xiang, 2001; Peng et al., 2012; International Union for Conservation of Nature [IUCN], 2021). At present, these critically endangered firs were vulnerable to the verge of extinction, for no enough elevational space to up-migrate in respond to future climate warming (Habel et al., 2011). By analysing available studies of latitudinal and elevation range shifts for multiple taxonomic groups, most species’ range shifting rate, in responding to climate change, were located around eleven meters along elevation per decade or 16.9 kilometres along latitudes per decade (Chen et al., 2011). As stated above, the endangered Abies species would be forced to contract up the slope by elevation shifting at a relatively high speed during the foreseeable global warming. However, these fir species have almost reached the mountaintop while no enough space to continue up-migrate, for example, Abies beshanzuenesis located in Baishanzu Mountain (1857 m) at 1750 m, Abies fanjingshanensis restricted in Fanjing Mountain (2494 m) with altitudes from 2100 to 2350 m, Abies yuanbaoshanensis distributes in Yuanbao Mountain (2081 m) at 1900–2000 m, and Abies ziyuanensis occurred in Shunhuang Mountain (1882 m) at 1700 m (Fan, 2006). To protect these critically threatened Abies, their up-migrate along elevation must be persisted and demanded critical attention by the government managements and protection organizations.
Till now, the general government protections of these critically endangered firs were fixed by in-situ conservation, but it was found to be not an effective and practical program. Indeed, the continued up-migrate of the six highly endangered firs was unsustainable. Facing the ongoing climate warming, they were believed to be near extinction or heavily contracted (Xiang, 2001; Xiang et al., 2009). Thus, we propose that the most helpful and urgent strategy was ex-situ management in more suitable areas, accompanied by breeding programs in botanical gardens. Even though these critically endangered firs were not included in our SDMs, the tendency was still reliable and they could be well represented for their conservative ecological niche requirement (Shao et al., 2017). As for the five critically endangered firs in China and Vietnam, the southern Hengduan Mountains region was always the suitable and ideal habitat during the whole Quaternary according to the SDMs results (Figure 6). And more than 35 National Botanical Reserves were constructed in the Heng-duan Mountains region and could play a meaningful role in the ex-situ conservation (Chen et al., 2009; Shao et al., 2020). Similar specific gardens and existing programs in other countries should be activated and strengthened the ex-situ conservation of defining conservation units. Our results are timely and significant to biodiversity conservation for endangered firs at current and future global climate change.
Data Availability Statement
The datasets presented in this study can be found in online repositories. The names of the repository/repositories and accession number(s) can be found in the article/Supplementary Material.
Author Contributions
YC and QW conceived and designed the experiments. Y-ZS and Y-YL analysed the data. Z-LY, Y-YZ, R-CX, and Y-ZY contributed reagents, materials, and analysis tools. Y-ZS, YC, and QW wrote the manuscript. All authors contributed to the article and approved the submitted version.
Funding
This research was supported by the Key Project of Science and Technology Research of Henan Province, China (212102110155) and the National Natural Science Foundation of China Grant (NSFC no. 31600163).
Conflict of Interest
The authors declare that the research was conducted in the absence of any commercial or financial relationships that could be construed as a potential conflict of interest.
Publisher’s Note
All claims expressed in this article are solely those of the authors and do not necessarily represent those of their affiliated organizations, or those of the publisher, the editors and the reviewers. Any product that may be evaluated in this article, or claim that may be made by its manufacturer, is not guaranteed or endorsed by the publisher.
Acknowledgments
We thank Xiao-Fang Lu and Zhao Wang for their support in the original data survey.
Supplementary Material
The Supplementary Material for this article can be found online at: https://www.frontiersin.org/articles/10.3389/fevo.2022.844354/full#supplementary-material
Footnotes
References
Aguirre-Planter, E., Jaramillo-Correa, J. P., Gomez-Acevedo, S., Khasa, D. P., Bousquet, J., and Eguiarte, L. E. (2012). Phylogeny, diversification rates and species boundaries of Mesoamerican firs (Abies, Pinaceae) in a genus-wide context. Mol. Phylogenet. Evol. 62, 263–274. doi: 10.1016/j.ympev.2011.09.021
Alexander, R. R., Shearer, R. C., and Shepperd, W. D. (1990). “Abies lasiocarpa (Hook.) Nutt,” in Silvics of North America, Vol. 1, eds R. M. Burns and B. H. Honkala (Washington: US Department of Agriculture, Forest Service), 60–70.
Avise, J. C. (2004). Molecular Markers, Natural History, and Evolution, 2nd Edn. Sunderland: Sinauer Associates,.
Awad, L., Fady, B., Khater, C., Roig, A., and Cheddadi, R. (2014). Genetic structure and diversity of the endangered fir tree of Lebanon (Abies cilicica Carr.): implications for conservation. PLoS One 9:e90086. doi: 10.1371/journal.pone.0090086
Bandelt, H. J., Forster, P., and Röhl, A. (1999). Median–joining networks for inferring intraspecific phylogenies. Mol. Biol. Evol. 16, 37–48. doi: 10.1093/oxfordjournals.molbev.a026036
Barnosky, C. W. (1981). A record of late Quaternary vegetation from Davis Lake, southern Puget lowland, Washington. Quat. Res. 16, 221–239. doi: 10.1016/0033-5894(81)90046-6
Bartlein, P. J., Anderson, K. H., Anderson, P. M., Edwards, M. E., Mock, C. J., Thompson, R. S., et al. (1998). Paleoclimate simulations for North America over the past 21,000 years: features of the simulated climate and comparisons with paleoenvironmental data. Quat. Sci. Rev. 17, 549–585.
Betancourt, J. L., Van, D. T. R., and Martin, P. S. (1990). Packrat Middens: The Last 40,000 Years of Biotic Change. Tucson: University of Arizona Press.
Birks, H. H. (2008). The Late-Quaternary history of arctic and alpine plants. Plant Ecol. Divers. 2, 135–146.
Brodie, L. P., Grey, K.-A., Bishop, J. M., and Midgley, G. F. (2021). Broadening predictive understanding of species’ range responses to climate change: the case of Aloidendron dichotomum. Front. Ecol. Evol. 9:715702. doi: 10.3389/fevo.2021.715702
Brown, G. R., Gill, G. P., Kuntz, R. J., Langley, C. H., and Neale, D. B. (2004). Nucleotide diversity and linkage disequilibrium in loblolly pine. Proc. Natl. Acad. Sci. U. S. A. 101, 15255–15260. doi: 10.1073/pnas.0404231101
Brown, K. J., and Hebda, R. J. (2002). Origin, development, and dynamics of coastal temperate conifer rainforests of southern Vancouver Island, Canada. Can. J. For. Res. 32, 353–372. doi: 10.1139/x01-197
Chen, I. C., Hill, J. K., Ohlemüller, R., Roy, D. B., and Thomas, C. D. (2011). Rapid range shifts of species associated with high levels of climate warming. Science 333, 1024–1026. doi: 10.1126/science.1206432
Chen, Y. H., Tang, Z. R., and Fang, J. Y. (2009). Distribution of nature reserves and status of biodiversity protection in China. Biodivers. Sci. 17, 664–674. doi: 10.3724/SP.J.1003.2009.08324
Cheng, W. C., and Fu, L. K. (1978). “Abies Mill,” in Flora Reipublicae Popularis Sinica, Vol. 7, eds W. C. Cheng and L. K. Fu (Beijing: Science Press), 55–95.
Cinget, B., Lafontaine, G. D., Gérardi, S., and Bousquet, J. (2015b). Integrating phylogeography and paleoecology to investigate the origin and dynamics of hybrid zones: insights from two widespread north American firs. Mol. Ecol. 24, 2856–2870. doi: 10.1111/mec.13194
Cinget, B., Gerardi, S., Beaulieu, J., and Bousquet, J. (2015a). Less pollen mediated gene flow for more signatures of glacial lineages: congruent evidence from balsam fir cpDNA and mtDNA for multiple refugia in eastern and central North America. PLoS One 10:e0122815. doi: 10.1371/journal.pone.0122815
Combe, F. J., Ellis, J. S., Lloyd, K. L., Cain, B., Wheater, C. P., and Harris, W. E. (2016). After the ice age: the impact of post-glacial dispersal on the phylogeography of a small mammal, Muscardinus avellanarius. Front. Ecol. Evol. 4:72. doi: 10.3389/fevo.2016.00072
Cook, C. G., Jones, R. T., Langdon, P. G., Leng, M. J., and Zhang, E. (2011). New insights on Late Quaternary Asian palaeomonsoon variability and the timing of the Last Glacial Maximum in southwestern China. Quat. Sci. Rev. 30, 808–820. doi: 10.1016/j.quascirev.2011.01.003
Cun, Y. Z., and Wang, X. Q. (2010). Plant recolonization in the Himalaya from the southeastern Qinghai–Tibetan Plateau: geographical isolation contributed to high population differentiation. Mol. Phylogenet. Evol. 56, 972–982. doi: 10.1016/j.ympev.2010.05.007
Dellicour, S., and Mardulyn, P. (2014). Spads 1.0: a toolbox to perform spatial analyses on DNA sequence data sets. Mol. Ecol. Resour. 14, 647–651. doi: 10.1111/1755-0998.12200
Dupanloup, I., Schneider, S., and Excoffier, L. (2002). A simulated annealing approach to define the genetic structure of populations. Mol. Ecol. 11, 2571–2581. doi: 10.1046/j.1365-294X.2002.01650.x
Ersmark, E., Klütsch, C. F. C., Chan, Y. L., Sinding, M.-H. S., Fain, S. R., Illarionova, N. A., et al. (2016). From the past to the present: wolf phylogeography and demographic history based on the mitochondrial control region. Front. Ecol. Evol. 4:134. doi: 10.3389/fevo.2016.00134
Excoffier, L., and Lischer, H. E. (2010). Arlequin suite ver 3.5: a new series of programs to perform population genetics analyses under Linux and Windows. Mol. Ecol. Resour. 10, 564–567. doi: 10.1111/j.1755-0998.2010.02847.x
Farjon, A. (2001). World Checklist and Bibliography of Conifers, 2nd Edn. London: The Royal Botanic Gardens, Kew.
Farjon, A., and Rushforth, K. D. (1989). A classification of Abies Miller (Pinaceae). Notes R. Bot. Gard. Edinburagh 46, 59–79.
Fick, S. E., and Hijmans, R. J. (2017). Worldclim 2: new 1km spatial resolution climate surfaces for global land areas. Int. J. Climatol. 37, 4302–4315.
Frank, R. M. (1990). “Abies balsamea (L.) Mill,” in Silvics of North America, Vol. 1, eds R. M. Burns and B. H. Honkala (Washington: US Department of Agriculture, Forest Service), 26–35.
Galbreath, K. E., Hafner, D. J., and Zamudio, K. R. (2009). When cold is better: climate-driven elevation shifts yield complex patterns of diversification and demography in an alpine specialist (American pika, Ochotona princeps). Evolution 63, 2848–2863. doi: 10.1111/j.1558-5646.2009.00803.x
Gavin, D. G., Fitzpatrick, M. C., Gugger, P. F., Heath, K. D., Rodríguez-Sánchez, F., Dobrowski, S. Z., et al. (2014). Climate refugia: joint inference from fossil records, species distribution models and phylogeography. New Phytol. 204, 37–54. doi: 10.1111/nph.12929
Gernandt, D. S., Magallón, S., López, G. G., Flores, O. Z., Willyard, A., and Liston, A. (2008). Use of simultaneous analyses to guide fossil based calibrations of Pinaceae phylogeny. Int. J. Plant Sci. 169, 1086–1099. doi: 10.1086/590472
Guevara, L., Morrone, J. J., and Leó-Paniagua, L. (2019). Spatial variability in species’ potential distributions during the last glacial maximum under different global circulation models: relevance in evolutionary biology. J. Zool. Syst. Evol. Res. 57, 113–126. doi: 10.1111/jzs.12238
Habel, J. C., Roedder, D., Schmitt, T., and Neve, G. (2011). Global warming will affect genetic diversity and uniqueness of Lycaena helle populations. Glob. Chang. Biol. 17, 194–205. doi: 10.1111/j.1365-2486.2010.02233.x
Halliday, W. E. D., and Brown, A. W. A. (1943). The distribution of some important forest trees in Canada. Ecology 24, 353–373. doi: 10.2307/1930537
Hewitt, G. M. (1996). Some genetic consequences of ice ages, and their role in divergence and speciation. Biol. J. Linn. Soc. 58, 247–276. doi: 10.1111/j.1095-8312.1996.tb01434.x
Hewitt, G. M. (2000). The genetic legacy of the quaternary ice ages. Nature 405, 907–913. doi: 10.1038/35016000
Hewitt, G. M. (2004). Genetic consequences of climatic oscillations in the Quaternary. Philos. Trans. R. Soc. Lond. B Biol. Sci. 359, 183–195.
Hosie, R. C. (1969). Native Trees of Canada, 7th Edn. Ottawa: Canadian Forest Service, Department of Environment.
Hwang, S. Y., Lin, T. P., Ma, C. S., Lin, C. L., Chung, J.-D., and Yang, J. C. (2003). Postglacial population growth of Cunninghamia konishii (Cupressaceae) inferred from phylogeographical and mismatch analyses of chloroplast DNA variation. Mol. Ecol. 12, 2689–2695. doi: 10.1046/j.1365-294X.2003.01935.x
Inoue, K., and Berg, D. J. (2016). Predicting the effects of climate change on population connectivity and genetic diversity of an imperiled freshwater mussel, Cumberlandia monodonta (Bivalvia: Margaritiferidae), in riverine systems. Glob. Chang. Biol. 23, 94–107. doi: 10.1111/gcb.13369
International Union for Conservation of Nature [IUCN] (2021). The IUCN Red List of Threatened Species. Version 2021-3. Available online at: https://www.iucnredlist.org (Accessed May 15, 2021)
Jiang, X. L., Shao, Y. Z., Wang, W. J., and Liu, B. D. (2015). The discovery, current status and future prospects of endangered firs in China. Bull. Biol. 50, 9–11.
Jiang, Z. Y., Peng, Y. L., Hu, X. X., Zhou, Y. F., and Liu, J. Q. (2011). Cytoplasmic DNA variation in and genetic delimitation of Abies nephrolepis and Abies holophylla in northeastern China. Can. J. For. Res. 41, 1555–1561. doi: 10.1139/x11-069
Lascoux, M., Palme, A. E., Cheddadi, R., and Latta, R. G. (2004). Impact of Ice Ages on the genetic structure of trees and shrubs. Philos. Trans. R. Soc. Lond. B Biol. Sci. 359, 197–207.
Li, Q., Wu, H., Yu, Y., Sun, A., and Luo, Y. (2019). Quantifying regional vegetation changes in China during three contrasting temperature intervals since the last glacial maximum. J. Asian Earth Sci. 174, 23–36.
Lin, N., Landis, J. B., Sun, Y. X., Huang, X. H., Zhang, X., Liu, Q., et al. (2021). Demographic history and local adaptation of Myripnois dioica (Asteraceae) provide insight on plant evolution in northern China flora. Ecol. Evol. 11, 8000–8013. doi: 10.1002/ece3.7628
Little, E. L. (1971). Atlas of United States Trees, Volume 1, Conifers and Important Hardwoods. Washington: US Department of Agriculture Miscellaneous Publication.
Liu, J. Q., Sun, Y. S., Ge, X. J., Gao, L. M., and Qiu, Y. X. (2012). Phylogeographical studies of plants in China: advances in the past and directions in the future. J. Syst. Evol. 50, 267–275. doi: 10.1111/j.1759-6831.2012.00214.x
Liu, T. S. (1971). A Monograph of the Genus Abies. Taipei: Department of Forestry, College of Agriculture, National Taiwan University.
Liu, Y. Y., Jin, W. T., Wei, X. X., and Wang, X. Q. (2022). Phylotranscriptomics reveals the evolutionary history of subtropical East Asian white pines: further insights into gymnosperm diversification. Mol. Phylogenet. Evol. 168:107403. doi: 10.1016/j.ympev.2022.107403
López-Pujol, J., López-Vinyallonga, S., Susanna, A., Ertuğrul, K., Uysal, T., Tugay, O., et al. (2016). Speciation and genetic diversity in Centaurea subsect, Phalolepis in Anatolia. Sci. Rep. 6:37818. doi: 10.1038/srep37818
Luzmm, E. Z., Licona-Vera, Y., Blanca, E. H., John, K., and Juan, F. O. (2020). Phylogeography of the widespread white-eared hummingbird (Hylocharis leucotis): pre-glacial expansion and genetic differentiation of populations separated by the Isthmus of Tehuantepec. Biol. J. Linn. Soc. 130, 247–267. doi: 10.1093/biolinnean/blaa043
Mantel, N. (1967). The detection of disease clustering and a generalization regression approach. Cancer Res. 27, 209–220.
Moritz, C., and Agudo, R. (2013). The future of species under climate change: resilience or decline? Science 341, 504–508. doi: 10.1126/science.1237190
Nei, M., and Li, W. H. (1979). Mathematical model for studying genetic variation in terms of restriction endonucleases. Proc. Natl. Acad. Sci. U. S. A. 76, 5269–5273. doi: 10.1073/pnas.76.10.5269
Nualart, N., Herrando-Moraira, S., Cires, E., Guardiola, M., and Laguna, E. (2021). Reusing old and producing new data is useful for species delimitation in the taxonomically controversial iberian endemic pair Petrocoptis montsicciana/P. pardoi (Caryophyllaceae). Diversity 13:205. doi: 10.3390/d13050205
Oliveira, F., Gehara, M., Solé, M., Lyra, M., Baptista Haddad, C. F., Silva, D. P., et al. (2021). Quaternary climatic fluctuations influence the demographic history of two species of sky-island endemic amphibians in the Neotropics. Mol. Phylogenet. Evol. 160:107113. doi: 10.1016/j.ympev.2021.107113
Peng, Y. L., Yin, S. M., Wang, J., Tian, B., Ren, G. P., Guo, Q. H., et al. (2012). Phylogeographical analyses of the fir species in southern China suggests complex origin and genetic admixture. Ann. For. Sci. 69, 409–416. doi: 10.1007/s13595-011-0170-3
Petit, R. J., Duminil, J., Fineschi, S., Hampe, A., Salvini, D., and Vendramin, G. G. (2005). Comparative organization of chloroplast, mitochondrial and nuclear diversity in plant populations. Mol. Ecol. 14, 689–701. doi: 10.1111/j.1365-294X.2004.02410.x
Petit, R. J., Mousadik, A. E., and Pons, O. (1998). Identifying populations for conservation on the basis of genetic markers. Conserv. Biol. 12, 844–855. doi: 10.1111/j.1523-1739.1998.96489.x
Phillips, S. J., Anderson, R. P., and Schapire, R. E. (2006). Maximum entropy modeling of species geographical distributions. Ecol. Modell. 190, 231–259. doi: 10.1016/j.ecolmodel.2005.03.026
Pons, O., and Petit, R. J. (1996). Measuring and testing genetic differentiation with ordered versus unordered alleles. Genetics 144, 1237–1245.
Rico, Y., León-Tapia, M. Á, Zurita-Solís, M., Rodríguez-Gómez, F., and Vásquez-Morales, S. G. (2021). Influence of Pleistocene climatic oscillations on the phylogeography and demographic history of endemic vulnerable trees (section Magnolia) of the Tropical Montane Cloud Forest in Mexico. Peer J 9:e12181. doi: 10.7717/peerj.12181
Rogers, A. R., and Harpending, H. (1992). Population growth makes waves in the distribution of pairwise genetic differences. Mol. Biol. Evol. 9, 552–569.
Rozas, J., Sánchez–DelBarrio, J. C., Messeguer, X., and Rozas, R. (2003). DnaSP, DNA polymorphism analyses by the coalescent and other methods. Bioinformatics 19, 2496–2497. doi: 10.1093/bioinformatics/btg359
Shao, Y. Z., Chen, Y., Zhang, X. C., and Xiang, Q. P. (2020). Species delimitation and phylogeography of Abies delavayi complex: inferred from morphological, molecular, and climatic data. J. Syst. Evol. 58, 234–246.
Shao, Y. Z., and Xiang, Q. P. (2015). Species delimitation and phylogeography of Abies chensiensis complex: inferred from morphological and molecular data. Bot. J. Linn. Soc. 177, 175–188. doi: 10.1111/boj.12235
Shao, Y. Z., Zhang, X. C., Phan, L. K., and Xiang, Q. P. (2017). Elevation Shift in Abies Mill. (Pinaceae) of Subtropical and Temperate China and Vietnam—Corroborative Evidence from Cytoplasmic DNA and Ecological Niche Modeling. Front. Plant Sci. 8:578. doi: 10.3389/fpls.2017.00578
Shi, N. (1996). Development spruce and fir in north China during the Pliocene and the early Pleistocene: palaeoclimatic implications. Quat. Sci. 4, 319–328.
Shi, Y. F. (2002). Characteristics of late Quaternary monsoonal glaciation on the Tibetan Plateau and in East Asia. Quat. Int. 97, 79–91. doi: 10.1016/S1040-6182(02)00053-8
Shi, Y. F., Cui, Z. J., and Li, J. J. (1987). Reassessment of Quaternary glaciation problems in East China. Earth Sci. 2, 45–54.
Song, Y. G., Walas, Ł, Pietras, M., Sâm, H. V., Yousefzadeh, H., Ok, T., et al. (2021). Past, present and future suitable areas for the relict tree Pterocarya fraxinifolia (Juglandaceae): integrating fossil records, niche modeling, and phylogeography for conservation. Eur. J. For. Res. 140, 1323–1339. doi: 10.1007/s10342-021-01397-6
Stewart, J. R., Lister, A. M., Barnes, I., and Dalén, L. (2010). Refugia revisited: individualistic responses of species in space and time. Proc. Biol. Sci. 277, 661–671. doi: 10.1098/rspb.2009.1272
Tanaka, N., Nakao, K., Tsuyama, I., Higa, M., Nakazono, E., and Matsui, T. (2012). Predicting the impact of climate change on potential habitats of fir (Abies) species in Japan and on the East Asian continent. Proc. Environ. Sci. 13, 455–466. doi: 10.1016/j.proenv.2012.01.039
Tang, L. Y., Li, C. H., An, C. B., and Wang, W. G. (2007). Vegetation history of the western Loess Plateau of China during the last 40ka based on pollen record. Acta Palaeontol. Sin. 46, 45–61. doi: 10.3969/j.issn.0001-6616.2007.01.003
Theodoridis, S., Randin, C., Peter Szövényi, Boucher, F., Patsiou, T., and Conti, E. (2017). Data from: how do cold-adapted plants respond to climatic cycles? Interglacial expansion explains current distribution and genomic diversity in Primula farinosa L. Syst. Biol. 66, 715–736. doi: 10.1093/sysbio/syw114
Waltari, E., Hijmans, R. J., Peterson, A. T., Nyári, ÁS., Perkins, S. L., and Guralnick, R. P. (2007). Locating Pleistocene refugia: comparing phylogeographical and ecological niche model predictions. PLoS One 2:e563. doi: 10.1371/journal.pone.0000563
Wang, J., Abbott, R. J., Peng, Y. L., Du, F. K., and Liu, J. Q. (2011). Species delimitation and biogeography of two fir species (Abies) in central China: cytoplasmic DNA variation. Heredity 94, 375–394. doi: 10.1038/hdy.2011.22
Wyatt, G. E., Hamrick, J. L., and Trapnell, D. W. (2021). Ecological niche modelling and phylogeography reveal range shifts of pawpaw, a North American understorey tree. J. Biogeogr. 48, 974–989. doi: 10.1111/jbi.14054
Xiang, Q. P. (2001). A preliminary survey on the distribution of rare and endangered plants of Abies in China. Guihaia 21, 113–117. doi: 10.3969/j.issn.1000-3142.2001.02.007
Xiang, Q. P., Wei, R., Shao, Y. Z., Yang, Z. Y., Wang, X. Q., and Zhang, X. C. (2015). Phylogenetic relationships, possible ancient hybridization, and biogeographic history of Abies (Pinaceae) based on data from nuclear, plastid, and mitochondrial genomes. Mol. Phylogenet. Evol. 82, 1–14. doi: 10.1016/j.ympev.2014.10.008
Xiang, Q. P., Wei, R., Zhu, Y. M., Harris, A. J., and Zhang, X. C. (2018). New infrageneric classification of Abies in light of molecular phylogeny and high diversity in western North America. J. Syst. Evol. 56, 562–572. doi: 10.1111/jse.12458
Xiang, Q. P., Xiang, Q. Y., Guo, Y. Y., and Zhang, X. C. (2009). Phylogeny of Abies (Pinaceae) inferred from nrITS sequence data. Taxon 58, 141–152.
Xu, Q. H., Yang, X. L., Ke, Z. M., Liang, W. D., and Yang, Z. J. (2002). Environment changes in Yanshan Mountain area during the latest Pleistocene. Geogr. Territorial Res. 18, 69–72. doi: 10.3969/j.issn.1672-0504.2002.02.019
Xu, R., Kong, Z. C., and Du, N. Q. (1980). Spruce - fir forest in pleistocene China and its significance in Quaternary Research. Quat. Res. 5, 48–56.
Yan, P., Pan, T., Wu, G., Kang, X., Ali, I., Zhou, W., et al. (2020). Species delimitation and evolutionary history of tree frogs in the Hyla chinensis group (Hylidae, Amphibian). Front. Ecol. Evol. 8:234. doi: 10.3389/fevo.2020.00234
Yi, C. L., Liu, K. X., Cui, Z. J., Jiao, K. Q., Yao, T. D., and He, Y. Q. (2004). AMS radiocarbon dating of late Quaternary glacial landforms, the source area of the Urumqi River, Tien Shan: a pilot study of 14C dating on inorganic carbon. Quat. Int. 121, 99–107. doi: 10.1016/j.quaint.2004.01.026
Yong, Z., Wang, W., Chen, D., Liu, L., and He, J. (2020). Pollen reconstructed holocene vegetation response to climate change and human activity in a semi-arid mountain area of north china. Catena 195:104878. doi: 10.1016/j.catena.2020.104878
Zhang, K., Liu, H., Pan, H., Shi, W., Zhao, Y., Li, S., et al. (2020). Shifts in potential geographical distribution of Pterocarya stenoptera under climate change scenarios in China. Ecol. Evol. 10, 4828–4837. doi: 10.1002/ece3.6236
Zhao, X., Ma, C., and Xiao, L. (2014). The vegetation history of Qinling Mountains, China. Quat. Int. 325, 55–62. doi: 10.1016/j.quaint.2013.10.054
Keywords: conservation, global climate change, phylogeography, species distribution modelling, endangered species
Citation: Shao Y-Z, Yuan Z-L, Liu Y-Y, Liu F-Q, Xiang R-C, Zhang Y-Y, Ye Y-Z, Chen Y and Wen Q (2022) Glacial Expansion or Interglacial Expansion? Contrasting Demographic Models of Four Cold-Adapted Fir Species in North America and East Asia. Front. Ecol. Evol. 10:844354. doi: 10.3389/fevo.2022.844354
Received: 28 December 2021; Accepted: 01 March 2022;
Published: 24 March 2022.
Edited by:
Jordi López-Pujol, Spanish National Research Council (CSIC), SpainReviewed by:
Łukasz Walas, Institute of Dendrology (PAN), PolandTakuto Shitara, Forestry and Forest Products Research Institute, Japan
Copyright © 2022 Shao, Yuan, Liu, Liu, Xiang, Zhang, Ye, Chen and Wen. This is an open-access article distributed under the terms of the Creative Commons Attribution License (CC BY). The use, distribution or reproduction in other forums is permitted, provided the original author(s) and the copyright owner(s) are credited and that the original publication in this journal is cited, in accordance with accepted academic practice. No use, distribution or reproduction is permitted which does not comply with these terms.
*Correspondence: Yun Chen, cyecology@163.com; Qian Wen, wenqian23@163.com
†These authors have contributed equally to this work