


Introduction
The Eemian Stage represents the last complete interglacial vegetation cycle in northwestern Europe. The stage was subdivided based on pollen assemblages (Jessen & Milthers, Reference Jessen and Milthers1928; Van der Vlerk & Florschütz, Reference Van der Vlerk and Florschütz1953; Zagwijn, Reference Zagwijn1961; Cleveringa et al., Reference Cleveringa, Meijer, Van Leeuwen, De Wolf, Pouwer, Lissenberg and Burger2000). The vegetation cycle shows the change from pioneer vegetation (Betula and Pinus), to deciduous forest (Quercus, Corylus), followed by Taxus, Carpinus and Picea in the second half of the stage and a return of Pinus and Betula in the final part of the interglacial (Zagwijn, Reference Zagwijn1961; Turner, Reference Turner2000; Caspers et al., Reference Caspers, Merkt, Müller and Freund2002; Börner et al., Reference Börner, Hrynowiecka, Stachowicz-Rybka, Niska, Moskal-del Hoyo, Kuznetsov, Maksimov and Petrov2018). As compared to the present Holocene interglacial, the Eemian is characterised by equal or slightly higher annual temperatures (Brewer et al., Reference Brewer, Guiot, Sánchez-Goñi and Klotz2008; Otto-Bliesner et al., Reference Otto-Bliesner, Rosenbloom, Stone, McKay, Lunt, Brady and Overpeck2013), higher eustatic sea level (Dutton & Lambeck, Reference Dutton and Lambeck2012; Long et al., Reference Long, Barlow, Busschers, Cohen, Gehrels and Wake2015), smaller global ice sheets (Plach et al., Reference Plach, Nisancioglu, Langebroek, Born and Le clec’h2019) and a comparable vegetation development. Therefore, the Eemian is often regarded as a possible analogue for future climate warming and sea-level rise, although this can be questioned because of differences in insolation (Loutre & Berger, Reference Loutre and Berger2003). The Eemian Stage is often regarded time-equivalent with marine isotope substage 5e; however, this assumption has been questioned because of age differences (Sánchez Goñi et al., Reference Sánchez Goñi, Turon, Eynaud, Shackleton and Cayre2000; Sier et al., Reference Sier, Peeters, Dekkers, Pares, Chang, Busschers, Cohen, Wallinga, Bunnik and Roebroeks2015).
The Eemian Stage is the last interglacial before the Weichselian glacial. Based on annually layered lake deposits in Bispingen (Germany), the duration of the stage was estimated to be 11,500 years (Müller, Reference Müller1974). However, absolute age boundaries are not straightforward, and the duration of the Eemian seems to vary (Govin et al., Reference Govin, Capron, Tzedakis, Verheyden, Ghaleb, Hillaire-Marcel, St-Onge, Stoner, Bassinot, Bazin, Blunier, Combourieu-Nebout, El Ouahabi, Genty, Gersonde, Jimenez-Amat, Landais, Martrat, Masson-Delmotte, Parrenin, Seidenkrantz, Veres, Waelbroeck and Zahn2015). Ages have been proposed from circa 131 ka (Beets et al., Reference Beets, Beets and Cleveringa2006) to 118 ka (Van Leeuwen et al., Reference Van Leeuwen, Beets, Bosch, Burger, Cleveringa, Van Harten, Waldemar Herngreen, Kruk, Langereis, Meyer, Pouwer and De Wolf2000), 129 to 120 ka (Scussolini et al., Reference Scussolini, Bakker, Guo, Stepanek, Zhang, Braconnot, Cao, Guarino, Coumou, Prange, Ward, Renssen, Kageyama, Otto-Bliesner and Aerts2019) and 121 to 110 ka (Sier et al., Reference Sier, Roebroeks, Bakels, Dekkers, Brühl, De Loecker, Gaudzinski-Windheuser, Hesse, Jagich, Kindler, Kuijper, Laurat, Mücher, Penkman, Richter and Van Hinsbergen2011; Peeters et al., Reference Peeters, Busschers and Stouthamer2015). Diachroneity of the end of the Eemian interglacial has been reported between southern and northern Europe (Turner, Reference Turner2002; Brauer et al., Reference Brauer, Allen, Mingram, Dulski, Wulf and Huntley2007; Brewer et al., Reference Brewer, Guiot, Sánchez-Goñi and Klotz2008). Recently, Vansteenberge et al. (Reference Vansteenberge, Verheyden, Genty, Blamart, Goderis, Van Malderen, Vanhaecke, Hodel, Gillikin, Ek, Quinif, Cheng, Edwards and Claeys2019) dated the Eemian to Weichselian transition at 117 ± 5 ka in speleothem records from Belgium. Because of the absolute age uncertainties, the pollen-based terrestrial biostratigraphical zonation established by Zagwijn (Reference Zagwijn1961) and duration of pollen zones established by Müller (Reference Müller1974) are used in this paper.
Eemian Stage interglacial deposits in the Netherlands are exceptionally well preserved in deeply scoured glacial basins that formed during the Saalian glaciation in the central Netherlands (Burck, Reference Burck1951; Jelgersma & Breeuwer, Reference Jelgersma, Breeuwer, Zagwijn and Van Staalduinen1975; Van den Berg & Beets, Reference Van den Berg, Beets and Van der Meer1987; Busschers et al., Reference Busschers, Van Balen, Cohen, Kasse, Weerts, Wallinga and Bunnik2008). These diatom and mollusc-rich interglacial deposits in both the Amsterdam and Amersfoort glacial basins (Fig. 1) were already noticed and studied in the 19th century (Harting, Reference Harting1852, Reference Harting1874; Bosch et al., Reference Bosch, Cleveringa and Meijer2000). Some of the mollusc species prefer warmer Lusitanian or Mediterranean conditions and do not occur along the present-day Dutch coast. Harting (Reference Harting1874) introduced the stratigraphic unit ‘Eemian’ for these deposits, after the river Eem in the central Netherlands near Amersfoort (Fig. 1).
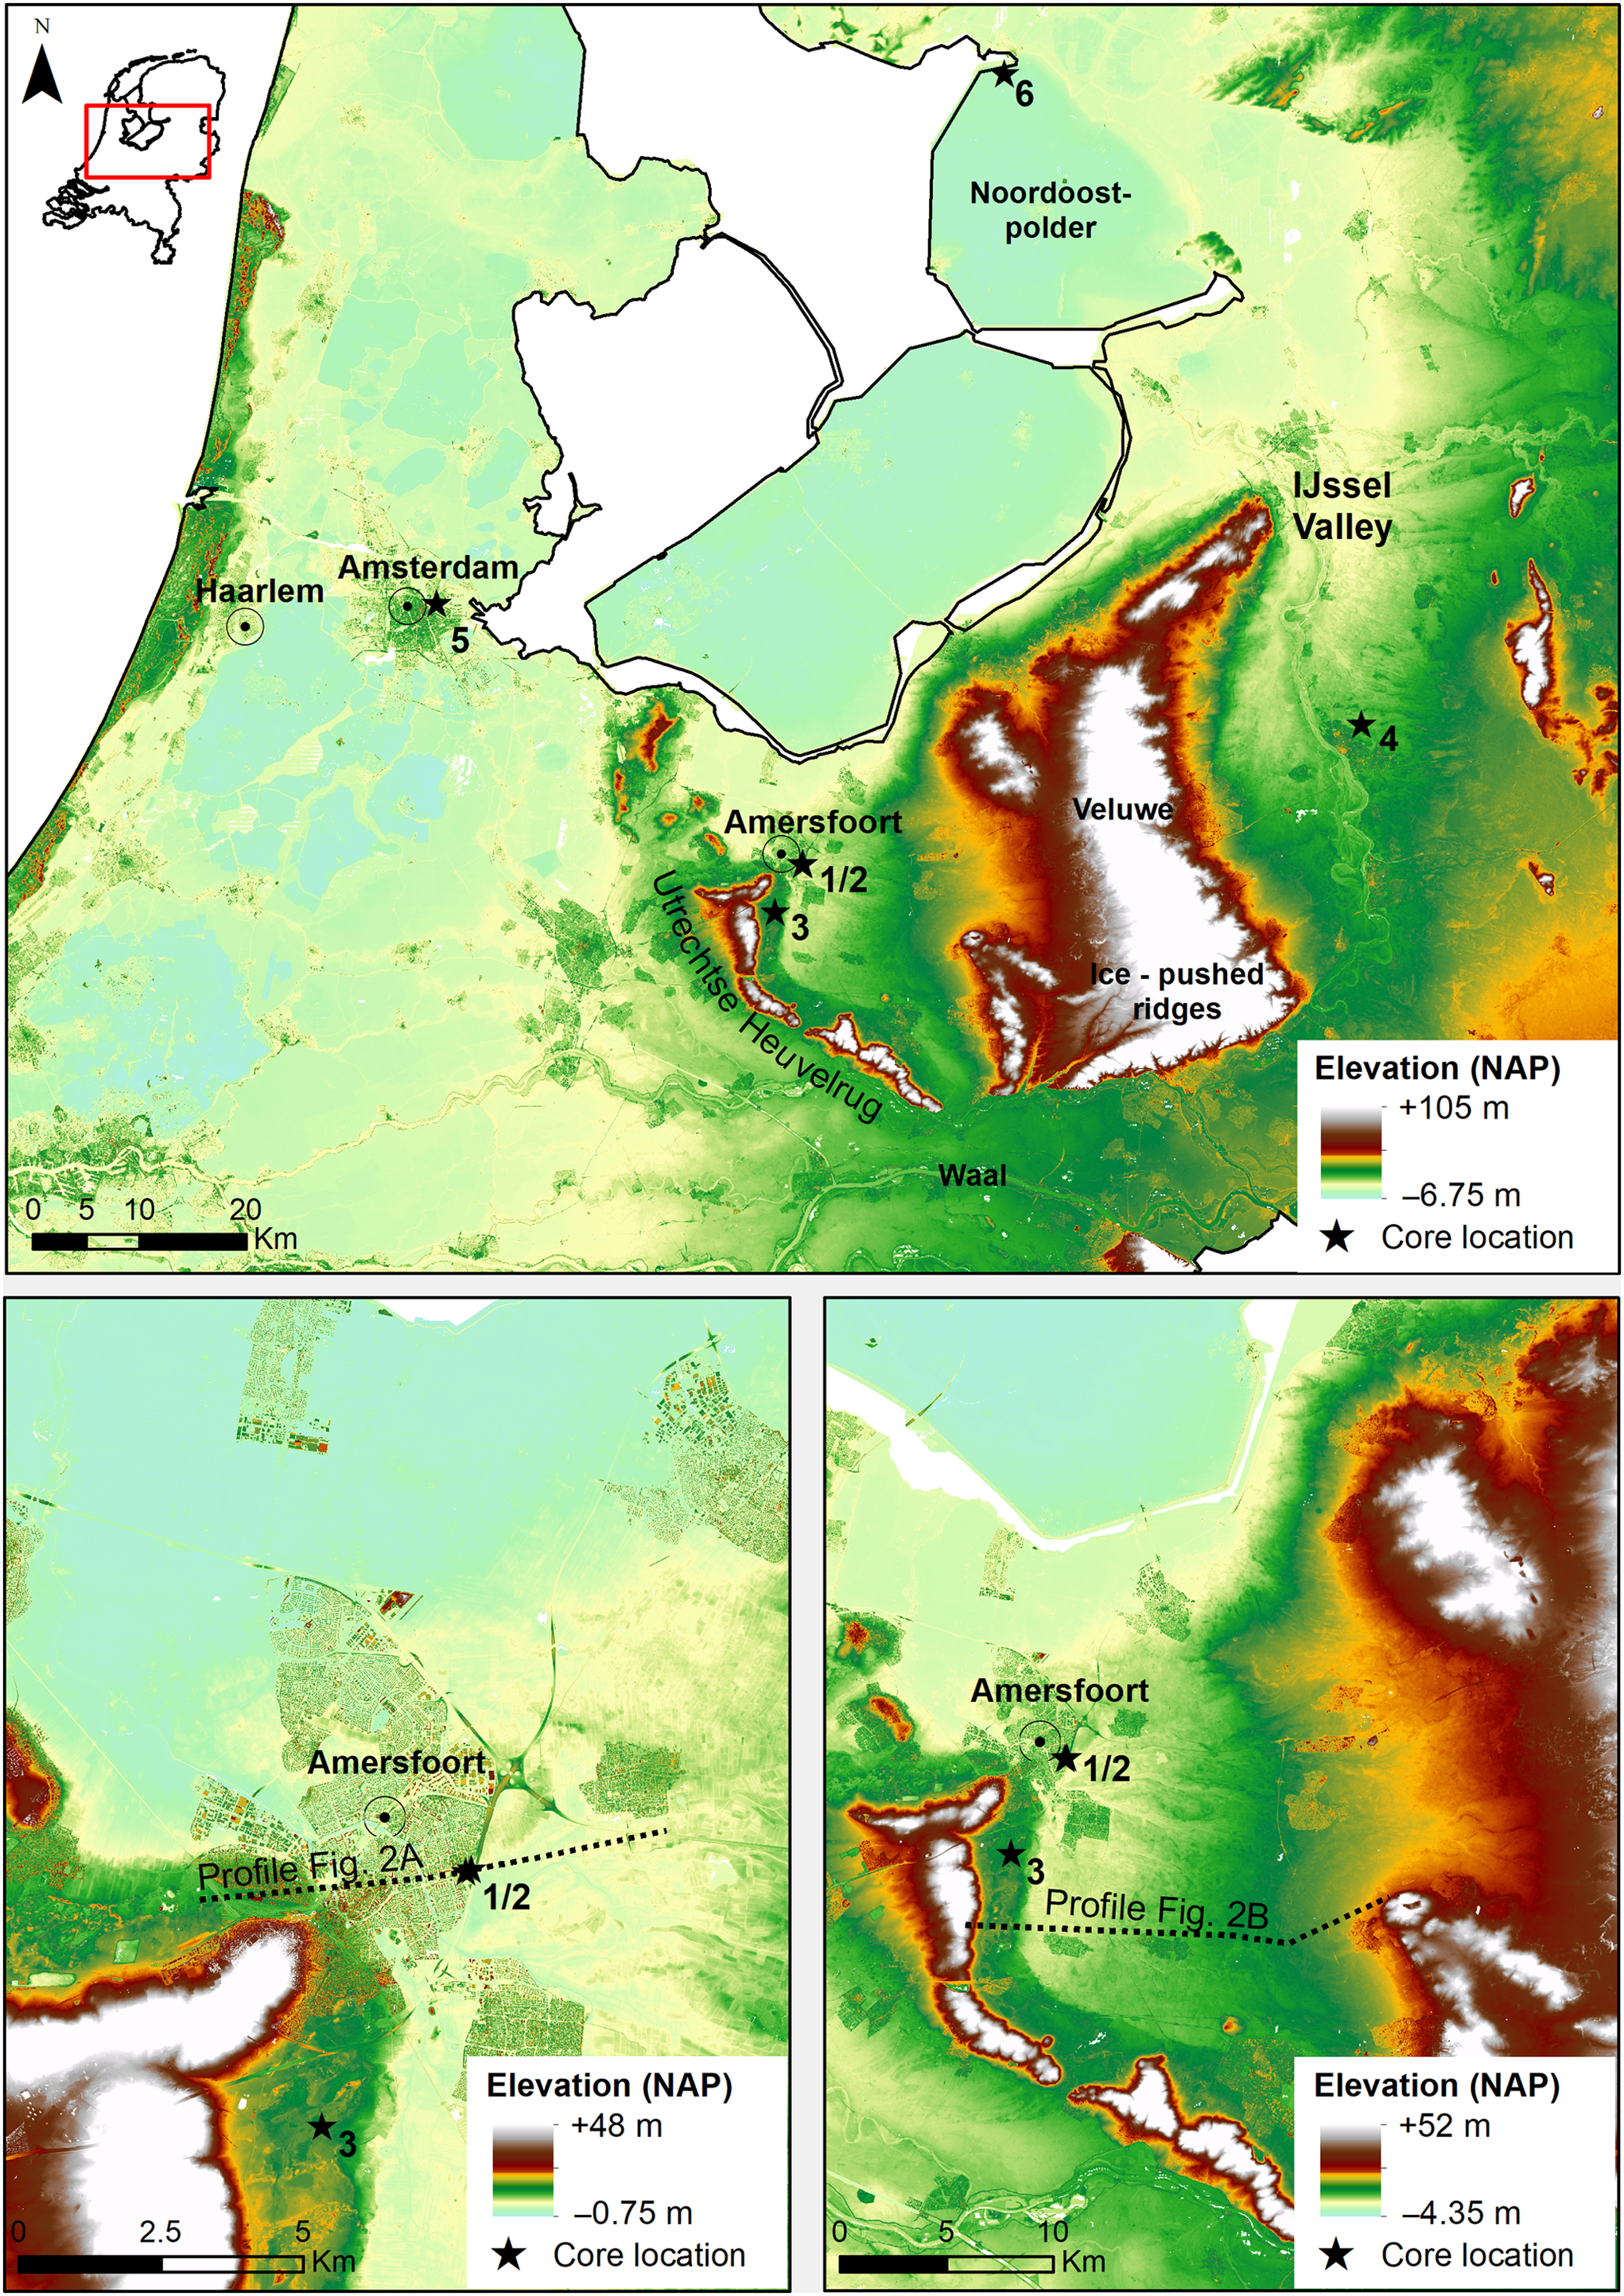
Fig. 1. Digital elevation maps of the study area in the Netherlands, including core locations with Eemian records in the Amersfoort Basin and adjacent regions and locations of the cross sections. 1. Amersfoort 1 (B32B0119); 2. Amersfoort New (B32B2092); 3. Den Treek (B32D1455); 4. Schalkhaar (B27G0118) 5. Amsterdam-Terminal (B25E0913); 6. Palaeo-Vecht valley, Rutten-Gemaalweg (B15F1501).
Extensive palynological research by Van der Vlerk and Florschütz (Reference Van der Vlerk and Florschütz1950, Reference Van der Vlerk and Florschütz1953) and Zagwijn (Reference Zagwijn1961) made Amersfoort the informal type locality of the Last Interglacial in northwestern Europe (Turner, Reference Turner2000). The base of the Eemian Stage, as a formal chronostratigraphic boundary, is located where non-tree pollen in pollen diagrams are succeeded by tree pollen. However, this transition is lacking in the original Amersfoort core (Amersfoort 1: B32B0119) (Van der Vlerk & Florschütz, Reference Van der Vlerk and Florschütz1953; Zagwijn, Reference Zagwijn1961; Cleveringa et al., Reference Cleveringa, Meijer, Van Leeuwen, De Wolf, Pouwer, Lissenberg and Burger2000). This is because the core site is located in the more shallow, southern part of the Amersfoort glacial basin, whereas the deepest part of the basin is located further north at −125 m NAP (Dutch Ordnance Datum). Furthermore, because of the position of the stratotype near the margin of the basin, high-energetic shallow-marine conditions prevailed during the Eemian sea-level highstand, leading to sand and clay deposition. Although pollen was retrieved from the (sandy) clay intervals, this is likely partly reworked. In addition, several erosional boundaries are present (Cleveringa et al., Reference Cleveringa, Meijer, Van Leeuwen, De Wolf, Pouwer, Lissenberg and Burger2000).
Later research demonstrated that the Amsterdam glacial basin, west of Amersfoort, is deeper and contains a more continuous late Saalian (LS) to early Eemian transition and a more complete Eemian sedimentary and biostratigraphical record (Zagwijn, Reference Zagwijn1983; Van Leeuwen et al., Reference Van Leeuwen, Beets, Bosch, Burger, Cleveringa, Van Harten, Waldemar Herngreen, Kruk, Langereis, Meyer, Pouwer and De Wolf2000). Therefore, it was proposed to define the Saalian-Eemian stage boundary and Eemian Stage stratotype in the Amsterdam-Terminal borehole (B25E0913) (Gibbard, Reference Gibbard2003). However, the lithology is changing at the Saalian–Eemian transition which might imply a break in the record. Cleveringa et al. (Reference Cleveringa, Meijer, Van Leeuwen, De Wolf, Pouwer, Lissenberg and Burger2000) re-evaluated the palynological and foraminifer results and supplied additional data for core Amersfoort 1 in context of the new investigations in the Amsterdam Basin. The LS interval in the Amsterdam Basin was thoroughly investigated by Beets and Beets (Reference Beets and Beets2003) and Beets et al. (Reference Beets, Beets and Cleveringa2006) who found proof for a temporal cooling during the LS.
Despite the general similarities of the Eemian and Holocene, the regional vegetation succession, landscape configuration and geomorphology of the Netherlands were different during the Eemian (De Gans et al., Reference De Gans, Beets and Centineo2000: 148–150; Busschers et al., Reference Busschers, Van Balen, Cohen, Kasse, Weerts, Wallinga and Bunnik2008; Peeters et al., Reference Peeters, Busschers, Stouthamer, Bosch, Van den Berg, Wallinga, Versendaal, Bunnik and Middelkoop2016). Although the general Eemian vegetation development is well studied, the local vegetation in relation to sedimentary environment and landscape geomorphology has received less attention. The Eemian landscape was strongly controlled by the previous Saalian glaciation of the northern and central part of the Netherlands. This glaciation had resulted in the formation of ice-pushed ridges (up to +100 m NAP, Dutch Ordnance Datum) and deep glacial basins (down to more than −100 m NAP) in the otherwise flat delta plain of Rhine and Meuse. As a consequence of this relief and the following Eemian sea-level rise and associated transgression, the glacial basins drowned and an irregular coastline formed, characterised by sheltered inland bays (Amsterdam Basin, Amersfoort Basin, IJssel Basin) and seaward protruding glacial highs. The Saalian morphology strongly contrasts with the westward dipping Weichselian surface, levelled by fluvial and aeolian erosion and deposition, that paved the way for the development of the straight barrier and back-barrier system of the western Netherlands during the Holocene sea-level rise (Beets & Van der Spek, Reference Beets and Van der Spek2000; De Gans et al., Reference De Gans, Beets and Centineo2000). Besides geomorphic differences, the Eemian soil conditions, partly determining vegetation succession and species composition, were possibly different from the Holocene. The soil at the (start) of the Eemian consisted of fresh, i.e. unweathered parent material, because of the landscape reset due to the preceding Saalian glaciation, whereas the Holocene soil parent material probably consists of sediments poorer in nutrients because of chemical and physical weathering in the Eemian and Weichselian periods.
To address some of the uncertainties and problems mentioned above, two new cores were retrieved from the Amersfoort Basin. The Eemian pollen record established by Zagwijn (Reference Zagwijn1961) was based on bailer drilling samples and contamination of the samples might have occurred. Therefore, a new continuous core was retrieved (Amersfoort New, B32B2092), 107 m northeast of core Amersfoort 1. Later, a new core was also taken at Leusden-Den Treek, circa 5 km southwest of Amersfoort 1, to study the late Quaternary sequence at the margin of the Amersfoort glacial basin (Den Treek, B32B1455), as part of a multi-proxy investigation into the geological and environmental setting of a buried Pinus woodland of Allerød age (Bazelmans et al., Reference Bazelmans, Van Balen, Bos, Brinkkemper, Colenberg, Doeve, Van Geel, Hakbijl, Van Hateren, Hoek, Huisman, Jansma, Kasse, Van Os, Van der Plicht, Schokker, Van der Putten and Van der Woude2021). It is hypothesised that in this marginal basin setting, low-energetic conditions prevailed with fine-grained (clay) deposition and peat formation. Reworked allochthonous material and sediment supply from fluvial sources (Rhine) should be minimal, giving a more reliable pollen record. Erosion during the sea-level highstand is also assumed to be less likely at the low-energetic basin margin, offering a more complete vegetation (pollen) and climatic highstand record without erosional unconformities. On the other hand, the marginal and higher position of core Den Treek (B32B1455), at the transition from the ice-pushed ridge to the glacial basin, could result in non-deposition, more extensive soil formation and a shorter sedimentary record. We present an in-depth description and interpretation of the Amersfoort cores and comparison to Eemian sites in the Netherlands. In order to enable comparison to sites outside the Netherlands, the duration of the Eemian pollen zones of Bispingen (Müller, Reference Müller1974) is given in table 1.
Therefore, the aims of this study are to: (i) make a regional vegetation reconstruction and explain the differences in local vegetation development in the Amersfoort Basin during the Eemian and Early Weichselian; (ii) correlate and compare the records in the Amersfoort glacial basin with other Eemian and Early Weichselian sites in the Netherlands; (iii) reconstruct the impact of climate change and sea level on the landscape and vegetation development; (iv) explore the role of sedimentary environment, reworking of pollen and accommodation space on the pollen record.
Geomorphological and geological setting
The three records are situated near the margin of the southern part of the Amersfoort glacial basin that was formed by the southward prograding Scandinavian ice sheet during the Saalian glacial period (Van den Berg & Beets, Reference Van den Berg, Beets and Van der Meer1987; Busschers et al., Reference Busschers, Van Balen, Cohen, Kasse, Weerts, Wallinga and Bunnik2008) (Fig. 1). The basin is flanked by up to +50 m NAP high ice-pushed ridges in the west (Utrechtse Heuvelrug) and east (Lunteren-Wageningen ridge). The present-day surface elevation of the basin is gently sloping from east (circa +15 m NAP) to west (circa +5 m NAP) and the morphology is characterised by an aeolian coversand relief of Weichselian Late Pleniglacial to early Late Glacial age (Maarleveld & Van der Schans, Reference Maarleveld and Van der Schans1961).
The stratigraphy of the research area is depicted in Figs 2 and 3. Glacio-tectonically deformed, pre-glacial Rhine-Meuse fluvial, mainly sandy and gravelly sediments (Urk Formation and Sterksel Formation), occur at the basin margins. The basin fill is up to 60 m thick. At the base is a till that was deposited below the Saalian ice sheet. Following ice retreat, but before the start of the Eemian, fluvioglacial and paraglacial deposits (Drente Formation), and local periglacial deposits (Boxtel Formation) were formed during the Late Saalian (Figs 2 and 3). The Eemian sequence (Eem Formation) starts with a local organic unit (Fig. 2: Lower peat member) in the deeper parts of the basin, consisting of fresh-water gyttja and peat. This unit is erosively overlain by coarse-grained, shell-bearing, shallow-marine sand, containing mollusc species characteristic for the Eemian (e.g. Cerastoderma glaucum, Venerupis aurea senescens and Bittium reticulatum) (Zagwijn, Reference Zagwijn1961: 22; Cleveringa et al., Reference Cleveringa, Meijer, Van Leeuwen, De Wolf, Pouwer, Lissenberg and Burger2000; Van Leeuwen et al., Reference Van Leeuwen, Beets, Bosch, Burger, Cleveringa, Van Harten, Waldemar Herngreen, Kruk, Langereis, Meyer, Pouwer and De Wolf2000: 162). The sand is rather abruptly overlain by clay with a top at circa −10 m NAP (core Amersfoort 1: B32B0119) or slightly higher at the margins of the basin (−7 m NAP, core Den Treek: B32D1455) (Figs 2 and 3). The clay was deposited in a brackish water lagoonal or estuarine environment with upward decreasing salinity according to foraminifera and diatom studies (Van Voorthuysen, Reference Van Voorthuysen1957; Cleveringa et al., Reference Cleveringa, Meijer, Van Leeuwen, De Wolf, Pouwer, Lissenberg and Burger2000). The clay changes upward into an extensive fresh-water peat (Fig. 2: Upper peat member; Woudenberg Formation) which can be interpreted as the final stage of the Eemian (Zagwijn, Reference Zagwijn1961). The peat is overlain by 10–15 m of mostly fine- to medium-grained sands of local shallow-fluvial and aeolian origin (Boxtel Formation) (Figs 2 and 3). Intercalated peats and organic deposits point to deposition during the Weichselian Early Glacial, Pleniglacial and Late Glacial (Zagwijn, Reference Zagwijn1961).

Fig. 2. (A) Cross-section of the deeper part of the Amersfoort Basin showing the lithostratigraphic setting of cores Amersfoort 1 and New; (B) Cross section of the Amersfoort Basin showing the lithostratigraphic setting of basin-marginal core Den Treek (after Zagwijn, Reference Zagwijn1961). For location, see Fig. 1.

Fig. 3. Sedimentary logs and biostratigraphical correlation of the cores in the Amersfoort Basin. Horizontal axis not to scale. E is Eem Formation; W is Woudenberg Formation. For location, see Fig. 1.
Previous research in the Amersfoort Basin
The Eemian was previously analysed in core Amersfoort 1 for its pollen composition (Zagwijn, Reference Zagwijn1961, Plate 1; Cleveringa et al., Reference Cleveringa, Meijer, Van Leeuwen, De Wolf, Pouwer, Lissenberg and Burger2000, their Fig. 3). The location of core and pollen diagram Amersfoort 1 (B32B0119; x = 157030; y = 463560; z = 2.70 m +NAP) is shown in Figs 1 and 2A. The original pollen counts from the archives of TNO-Geological Survey of the Netherlands have been used to create a pollen diagram in which the plant species are presented in percentages of the uniform pollen sum (see Methods). The Eemian vegetation development is summarised in Fig. 4. The full pollen diagram is presented in supplement figure S4.

Fig. 4. Concise pollen diagram of the original Eemian stratotype Amersfoort 1 (B32B0119) in the Amersfoort Basin showing the Eemian Stage and transition to the Weichselian Early Glacial (cf. Zagwijn, Reference Zagwijn1961; Cleveringa et al., Reference Cleveringa, Meijer, Van Leeuwen, De Wolf, Pouwer, Lissenberg and Burger2000). Pollen sum contains the arboreal pollen, upland herbs and Ericales.
The Saalian to Eemian transition and Betula zone E1 are lacking in core Amerfoort 1. The Eemian record starts with high Pinus values pointing to a coniferous woodland vegetation (zone E2) (Fig. 4). Zone E3 reflects the transition to a deciduous forest vegetation dominated by Quercus, and Alnus is an important element in the local wetland vegetation. Zone E4a is dominated by Corylus (up to 50%) at the expense of Quercus. The base of the zone coincides with a shell breccia reflecting an erosional boundary. Low values of Chenopodiaceae (now a subfamily of Amaranthaceae) and dinoflagellate cysts occur for the first time, indicating the onset of the transgression. Zone E4b is characterised by the increase of Taxus, whereas Carpinus and Picea show a first appearance. The sedimentary succession shows a coarsening-upward sequence reflecting the drowning of the basin. The transition of pollen zone E4b to E5 cannot be pinpointed because of the general absence of pollen in the overlying sand unit (Fig. 3). One pollen spectrum with low pollen sum at 24 m has not been included in the diagram. In the late Eemian, the vegetation is dominated by Carpinus, and Abies has its first appearance (zone E5). Chenopodiaceae show peak values reflecting the final stage of transgression with clay deposition in a brackish-water marsh environment. In the final stage of the Eemian (zone E6) Pinus and Picea (and Abies) are important, indicating a change from the previous mixed deciduous forest to coniferous woodland. The presence of Alnus suggests local fresh-water conditions. The Eemian to Weichselian transition (E6-EWI) is characterised by an increase of Ericales, Betula and Pinus. Artemisia and Poaceae reflect more open vegetation conditions that are attributed to the climate cooling of the Weichselian Early Glacial (cf. Chaline & Jerz, Reference Chaline and Jerz1984). At the top of the diagram, Betula shows a strong increase followed by Pinus, indicating the return of coniferous woodland related to the climate warming of the Amersfoort Interstadial (EWII) (Zagwijn, Reference Zagwijn1961), considered to be equivalent to the Brørup Interstadial (Behre, Reference Behre1989).
Methods
Two new undisturbed cores were retrieved, core Amersfoort New (B32B2092) circa 107 m northeast of core locality Amersfoort 1 (Zagwijn, Reference Zagwijn1961) and core Den Treek (B32D1455) at the margin of the glacial basin, circa 5 km southwest of core Amersfoort 1 (Fig. 1). Both cores extend to the base of the glacial basin. The lithology of the cores is described according to SBB 5.1 (Bosch, Reference Bosch2000) and the lithostratigraphy is interpreted according to TNO-GDN (2021) (Fig. 3). Fine-grained intervals were sampled for pollen analysis.
Pollen samples were treated following the standard method by Faegri and Iversen (Reference Faegri and Iversen1989), after which they were mounted in glycerine jelly. Pollen types were subsequently identified using Beug (Reference Beug2004) and Moore et al. (Reference Moore, Webb and Collinson1991). Pollen records were digitised and visualised using the Tilia software package (Grimm, Reference Grimm1992). Pollen zones and their boundaries are differentiated based on changes in the main pollen taxa, sometimes coinciding with changes in lithology. The pollen zones are correlated to the Eemian pollen zones defined by Zagwijn (Reference Zagwijn1961, Reference Zagwijn1996). In order to enable comparison of the three pollen diagrams, a uniform pollen sum was used as a basis for calculating pollen percentages, because different pollen sums were applied in previous publications. Zagwijn (Reference Zagwijn1961) included all pollen taxa in the pollen sum. Bunnik and Cremer (Reference Bunnik and Cremer2011) used a pollen sum consisting of trees, herbs (upland and wetland herbs, only excluding aquatic plants) and heathers. The uniform pollen sum, used as calculation basis for the three pollen sections in the present study, includes trees and shrubs (AP Arboreal Pollen), upland herbs and Poaceae (NAP Non-Arboreal Pollen) and heathers (Ericales). By using this pollen sum in the pollen diagrams, a distorting dominance of very local wetland plants at the core site is avoided. Ecological interpretations are based on Van der Meijden (Reference Van der Meijden2005) and FLORON (2021). The detailed pollen zone descriptions of cores Amersfoort New and Den Treek are presented in Appendix. The pollen diagrams are presented in two formats. The concise diagrams are shown in the text (Figs 4–6), whereas the complete diagrams are provided as online supplements (Figs S4–S6).

Fig. 5. Concise pollen diagram of core Amersfoort New (B32B2092), situated 107 m northeast of Amersfoort 1. Pollen sum contains the arboreal pollen, upland herbs and Ericales.

Fig. 6. Concise pollen diagram of core Den Treek (B32D1455) at the margin of the Amersfoort Basin, showing the late Eemian and transition to the Weichselian Early Glacial. Pollen sum contains the arboreal pollen, upland herbs and Ericales.
Description and interpretation of the Amersfoort records
Sedimentary succession
Cores Amersfoort 1 (B32B0119) and Amersfoort New (B32B2092) are located in the deeper part of the Amersfoort glacial basin, while core Den Treek (B32D1455) is located at the western margin of the Amersfoort glacial basin (Figs 1 and 2). Therefore, the lithological successions of the cores are different (Fig. 3). The Eemian interval (E2–E6) in cores Amersfoort 1 and Amersfoort New are approximately 15–17 m thick, while in core Den Treek the Eemian (E4b–E6) only covers 1.5 m. Especially, the fine-grained and organic interval of the early Eemian (zones E2-4a) and the up to 9 m thick sandy shallow-marine sediments of zone E4b–E5 are missing in core Den Treek (Fig. 3). The later start of registration in comparison to Amersfoort New is explained by the basin marginal position of core Den Treek. The organic base of core Den Treek is dominated by thermophilous trees and the presence of Taxus is indicative for Eemian zone E4b. The presence of Helianthemum and Ericales in the lowest spectrum of core Den Treek suggests remnants of pollen zone LS (Late Saalien), followed by a small Betula peak, normally associated with zone E1 (Fig. 6). Therefore, the base of core Den Treek represents a condensed section with slow organic accumulation in combination with some bioturbation. Furthermore, the sand below the organic interval in core Den Treek (deeper than 14.47 m below surface) is moderately humic and homogenous (i.e. no sedimentary structures) with bleached sand grains and rooting traces indicating soil formation. This indicates a period of non-deposition, covering the Eemian pollen zones E1-3, before the start of peat formation. Obviously, the Eemian sedimentary units, which were formed in relation to groundwater and sea-level rise, pinch out towards the basin margin (Figs 2A,B and 3) (Zagwijn, Reference Zagwijn1961).
The lithology of the cores Amersfoort 1 (B32B0119) and Amersfoort New (B32B2092) generally shows a good correspondence (cf. Zagwijn, Reference Zagwijn1961; Cleveringa et al., Reference Cleveringa, Meijer, Van Leeuwen, De Wolf, Pouwer, Lissenberg and Burger2000) (Fig. 3). The cores show sand at the base, overlain by an organic (gyttja/peat) unit reflecting the drowning of the basin during the early Eemian. The upper part of the organic unit contains shells and is therefore reworked during the Eemian transgression in the basin. The organic unit is overlain by a coarsening-upward sequence of circa 1 m of loam and fine sand, followed by a circa 8 m thick shell-bearing coarse-grained sand. The sand is rather abruptly overlain by loam and clay (∼4.5 m), followed by peat (∼1 m), sand (∼2 m) and peat (∼2 m) (Fig. 3). Although core Amersfoort New was retrieved only 107 m to the northeast of core Amersfoort 1 and the lithological succession and thickness of the units are largely comparable, the absolute depths differ with respect to Dutch Ordnance Datum. The depths in core Amersfoort New are generally larger and the deviations range from circa 2.8 m (base of zone E2) to 1.6 m in the upper part (top of zone E5) (Fig. 3). Obviously, core Amersfoort New is situated in a deeper part of the Amersfoort glacial basin and the elevation differences were gradually levelled over time. The different position of the two Amersfoort cores in the glacial basin has affected the local vegetation development. Zagwijn (Reference Zagwijn1961, his fig. 4) postulated the presence of local dead-ice depressions in the Amersfoort Basin following ice retreat that might explain these elevation differences between the two Amersfoort cores.
Vegetation development
The combination of the three records from the Amersfoort Basin arguably eliminates the problems of the individual sites (erosion, non-deposition, reworking). Sites Amersfoort 1 (B32B0119) and Amersfoort New (B32B2092) in the deeper part of the basin provide a larger accommodation space and offer a long record and early registration of the Eemian sequence. Site Den Treek (B32D1455), in the marginal low-energy setting of the basin, offers a good registration of the Eemian sea-level highstand (maximum flooding) and Eemian to Weichselian transition.
The pollen diagrams (Figs 4–6) show a comparable regional vegetation development with a near complete Eemian interglacial succession and start of the Early Weichselian glacial in cores Amersfoort 1 and Amersfoort New. The pollen diagrams show that the interglacial vegetation development resembles a succession starting with a protocratic phase (Zone E2), followed by the mesocratic phase (Zone E3 and E4) with closed deciduous forests (Birks & Birks, Reference Birks and Birks2004). Then the oligocratic phase (Zone E5) occurs with increased coniferous forest elements and the telocratic phase (E6) with coniferous forest at the end of the interglacial. Finally, the vegetation succession returns to the more open cryocratic phase of the next glacial (Zone EWI). Hence, the combined diagrams of the Amersfoort Basin show an illustrative example of the vegetation and ecosystem succession during a glacial to interglacial cycle.
Late Saalian and Eemian E1
The Late Saalian and early Eemian (Zone E1; Betula) are not recorded in cores Amersfoort 1 (Fig. 4; Zagwijn, Reference Zagwijn1961; Cleveringa et al., Reference Cleveringa, Meijer, Van Leeuwen, De Wolf, Pouwer, Lissenberg and Burger2000) and Amersfoort New (Fig. 5). Registration starts in both cores during pollen zone E2, dominated by Pinus. The coarse-grained sand at 30.76-31.00 m below surface in Amersfoort New may represent an erosional event marking the Saalian to Eemian climatic transition and associated changes in water and sediment supply (cf. Vandenberghe, Reference Vandenberghe2015). Soil formation and rooting, related to non-deposition that could explain the absence of zone E1, were not observed. Since pollen zone E1 covers a 100 year period only (Müller, Reference Müller1974; Zagwijn, Reference Zagwijn1996), it is possible that zone E1 is present in the condensed basal part of the Eem sequence. On the other hand, it is more likely that the Saalian to Eemian transition was not registered here, since both cores are located in the shallower part of the Amersfoort Basin. Sea level and groundwater levels were still low during zone E1, in combination with the permeable sandy subsoil, organic accumulation did not occur. Furthermore, the landscape was not fully stabilised during the LS and early stages of the Eemian, due to the restricted pioneer vegetation cover. Therefore, clastic deposition, poor in pollen, may have continued in some areas and dominated over organic accumulation in the early stages of the Eemian. A more complete Saalian to Eemian transition may be present in the central deepest part of the basin further north (cf. Amsterdam Basin; Van Leeuwen et al., Reference Van Leeuwen, Beets, Bosch, Burger, Cleveringa, Van Harten, Waldemar Herngreen, Kruk, Langereis, Meyer, Pouwer and De Wolf2000).
Eemian E2
Registration starts in core Amersfoort 1 and Amersfoort New during zone E2, dominated by Pinus. However, Betula is still important in the lower part of zone E2 in core Amersfoort 1, possibly reflecting the transition from pollen zone E1 to E2 or local birch growth in the more shallow core Amersfoort 1 (Fig. 4). Low values of Artemisia in core Amersfoort New show more open conditions at the start of the zone (Fig. 5). Zone E2 shows the development from a mixed Betula–Pinus woodland to a closed coniferous forest surrounding the shallow lake basin (Fig. 7). Pinus values are higher in core Amersfoort New than in core Amersfoort 1, possibly due to floating Pinus pollen in the more open-water conditions in core Amersfoort New, which is situated in a slightly deeper part of the basin (Fig. 7). The wetland herbs show a rapid decrease in core Amersfoort New. In combination with the lithological change from sand and clay to organic (gyttja) deposition, this possibly reflects the drowning of the site and deepening of the lake.

Fig. 7. Conceptual west-east cross section and model of sedimentary environments and vegetation development in the Amersfoort Basin during the Eemian Stage.
Eemian E3
In Zone E3, Pinus is decreasing and Quercus shows an abrupt rise and characterises zone E3 with values between 20% and 40% in both cores, reflecting the change in the regional vegetation to a deciduous forest (Figs 4 and 5). Fraxinus (3%) and Ulmus (5%) are characteristic elements of the oak forest vegetation and Corylus shows a rise in the upper part of this zone. Hedera (2%) was found in core Amersfoort 1 and indicates mild winter conditions early in the Eemian interglacial (Fig. 4) (Zagwijn, Reference Zagwijn1996: 461).
Alnus is present as part of the local wetland vegetation (alder brook). However, Alnus values in core Amersfoort 1 (in zone E3 and following zones) are much higher than in core Amersfoort New (Figs 4 and 5). This implies that core Amersfoort 1 was located closer to the moist woodland in the transitional zone between the ice-pushed ridge and the fresh-water basin, in comparison to core Amersfoort New (Fig. 7). Here, the local vegetation with Ceratophyllum and Nuphar (Supplement full diagram Fig. S5), the diatom composition (Bunnik & Cremer, Reference Bunnik and Cremer2011, sample 29.67 m) and the organic character of the sediment (gyttja) indicate shallow fresh water, lake conditions.
Eemian E4a
During the transition of zone E3 to zone E4a, erosion occurred followed by a change in lithology. The sediment changes from a gyttja to a gyttja-dy with salt-water shells in core Amersfoort 1 (at 27.11–27.14 m shell breccia) (Fig. 4) and from gyttja to peat with some gravel and shells in core Amersfoort New (at 29.66 m) (Fig. 5). Therefore, an erosional boundary is present at the transition of zone E3 to E4a (cf. Cleveringa et al., Reference Cleveringa, Meijer, Van Leeuwen, De Wolf, Pouwer, Lissenberg and Burger2000, their fig. 11). This abrupt facies change in cores Amersfoort 1 and Amersfoort New was caused by erosion and redeposition of reworked organic material during the onset of transgression in the Amersfoort Basin related to the rapid sea-level rise in the early stages of the Eemian (cf. Zagwijn, Reference Zagwijn1961, Reference Zagwijn1983; Long et al., Reference Long, Barlow, Busschers, Cohen, Gehrels and Wake2015). In core Den Treek, at the basin margin, the first salt-water influence (Chenopodiaceae rise) is recorded later, at the start of zone E5 (Fig. 6). The different timing of transgression is caused by elevation differences of the basin margin in comparison to the basin centre in relation to sea level (Fig. 3). The transition of zone E4 to E5 in core Den Treek is located at 14.29 m below surface (−7.29 m NAP), while the E3–E4a transition in core Amersfoort 1 is situated at 27.14 m below surface (−24.44 m NAP). Therefore, the impact of sea-level rise on the sedimentation during the Eemian is time-transgressive along the margin of the Amersfoort Basin.
During zone E4a, the thermophilous trees reach high values and are dominated by Corylus (circa 50%), whereas Quercus and Pinus show lower percentages (Figs 4 and 5). Corylus favours sunny to moderately shady growing conditions and dry to moist moderately nutrient-rich mineral soils, which were present west of the site at the transition of the basin to the ice-pushed ridges (Fig. 7). Low values of Chenopodiaceae in core Amersfoort 1 and dinoflagellates and foraminifers in core Amersfoort New occur for the first time and indicate the start of salt-water conditions. This is supported by diatom analysis indicating a benthic marine-brackish assemblage from the near-shore, intertidal zone (Bunnik & Cremer, Reference Bunnik and Cremer2011: 9–10, table 2, samples 29.55 and 29.22).
Eemian E4b
The transition of zone E4a to E4b coincides with a lithological change from gyttja to sandy gyttja with shells in core Amersfoort 1 (at 26.60 m below surface) and from peat with some shells to sandy loam with shells in core Amersfoort New at 28.87 m (Figs 4 and 5). Both cores show a decrease in organic matter content and an abrupt increase in grain size indicating increased energy of the depositional environment, and some erosion at the E4a–E4b transition is therefore likely (cf. Cleveringa et al., Reference Cleveringa, Meijer, Van Leeuwen, De Wolf, Pouwer, Lissenberg and Burger2000). High percentages of dinoflagellates and planktonic diatom species in core Amersfoort New indicate a salt water to brackish, subtidal environment with increasing water depth (Bunnik & Cremer, Reference Bunnik and Cremer2011: 9–10, table 2, samples 28.78, 28.55 and 27.72 m). Sea level was rapidly rising and high at the end zone E4b (Zagwijn, Reference Zagwijn1983; Cleveringa et al., Reference Cleveringa, Meijer, Van Leeuwen, De Wolf, Pouwer, Lissenberg and Burger2000). However, salt-water deposits of zone E5 overlie zone E4b sediments, indicating that sea-level rise continued, at a slower rate, during zone E5 (Fig. 7). Abrupt oscillations or jumps in sea level during the Eemian highstand have not been observed in the record (cf. Long et al., Reference Long, Barlow, Busschers, Cohen, Gehrels and Wake2015).
Zone E4b shows a drop in Corylus, increase of Quercus (and Pinus) and presence of Ulmus, Tilia, Fraxinus (in core Amersfoort 1) (Figs 4 and 5). This indicates the presence of optimum interglacial forest vegetation along the basin, possibly related to maximum interglacial temperatures (Cleveringa et al., Reference Cleveringa, Meijer, Van Leeuwen, De Wolf, Pouwer, Lissenberg and Burger2000: 212; Bunnik & Cremer, Reference Bunnik and Cremer2011: 11). However, according to Zagwijn (Reference Zagwijn1996) the summer thermal maximum of the Eemian occurred already during zone E4a.
Taxus, which is a characteristic element of pollen zone E4b (Cleveringa et al., Reference Cleveringa, Meijer, Van Leeuwen, De Wolf, Pouwer, Lissenberg and Burger2000), is present in core Amersfoort 1, but is missing in zone E4b of core Amersfoort New. The E4b interval in core Amersfoort New is thinner (79 vs 130 cm) than in Amersfoort 1 and only two spectra were investigated (Fig. 3). The limited thickness of zone E4b in core Amersfoort New is probably caused by later erosion before or during the start of the overlying coarse-grained sediments and therefore the upper part of zone E4b with higher Taxus values might be missing. In addition, local ecological factors may play a role, since Taxus can grow at the transition from dry to wetter ground (Van der Meijden, Reference Van der Meijden2005; FLORON, 2021). Palaeobotanical investigations of the Holocene coastal deposits in Flanders show the presence of Taxus in peat beds, indicating a large diversity of ecological preferences (Deforce & Bastiaens, Reference Deforce and Bastiaens2007). Local Taxus stands were possibly situated closer to core Amersfoort 1, which is situated more to the basin margin than core Amersfoort New (Fig. 7).
Carpinus and Picea show a first appearance with values less than 5% and Pinus shows a slight increase in both Amersfoort cores (Figs 4 and 5). However, the clastic sediments (loam, fine sand) of this interval indicate sediment transport by tidal currents and waves to the site, which may contain allochthonous pollen. During the Eemian, the Rhine occupied a course through the deeply scoured IJssel glacial basin (Busschers et al., Reference Busschers, Van Balen, Cohen, Kasse, Weerts, Wallinga and Bunnik2008; Peeters et al., Reference Peeters, Busschers and Stouthamer2015). Rhine sediments were redistributed further to the west in estuarine and tidal environments as found in the Amersfoort and Amsterdam basins and therefore may contain pollen derived from the German hinterland. Especially floating saccate pollen types like Pinus, Picea and Abies may easily be overrepresented in the open water depositional environment (Traverse & Ginsburg, Reference Traverse and Ginsburg1967; Heusser & Balsam, Reference Heusser and Balsam1977; Chowdhury, Reference Chowdhury1982). Picea may have been present in the vegetation in the upstream Rhine catchment. However, the presence of Picea in the regional vegetation around the Amersfoort Basin during zone E4 can be questioned. The presence of high Pinus and Picea values in the clastic LS deglaciation sediments in core Amsterdam-Terminal (Van Leeuwen et al., Reference Van Leeuwen, Beets, Bosch, Burger, Cleveringa, Van Harten, Waldemar Herngreen, Kruk, Langereis, Meyer, Pouwer and De Wolf2000; Beets & Beets, Reference Beets and Beets2003) further demonstrates the importance of influx of allochthonous pollen in the sedimentary record.
Alnus values are high (up to 60%) in core Den Treek in comparison to cores Amersfoort 1 (20%) and Amersfoort New (10%) (Figs 4–6). These high values reflect local presence of alder at the basin margin in comparison to further into the basin (Fig. 7). Local Alnus growth in core Amersfoort 1 and Amersfoort New occurred earlier (in zones E3–E4a) than in core Den Treek, probably related to groundwater and sea-level rise and subsequent drowning followed by first shallow-marine deposition in zone E4a.
Eemian E5
The transition from zone E4b to E5 may coincide with the lithological boundary from sandy clay to coarse shell-bearing sands in core Amersfoort 1 (at 25.30 m below surface) and from fine to coarse shell-bearing sands in core Amersfoort New (at 28.08 m) (Figs 4 and 5). Therefore, erosion is likely at the E4b to E5 transition (cf. Cleveringa et al., Reference Cleveringa, Meijer, Van Leeuwen, De Wolf, Pouwer, Lissenberg and Burger2000). The 8 to 9 m thick coarse-grained sands were unsuited for pollen analysis. One spectrum in core Amersfoort 1 at 24 m with a low pollen sum (not included in the concise diagram Fig. 4) contains lower Corylus and Quercus values, whereas some Carpinus pollen is present. Therefore, the shell-bearing sands were assigned to zone E5 (Zagwijn, Reference Zagwijn1961) or, alternatively, to zone E4b (Cleveringa et al., Reference Cleveringa, Meijer, Van Leeuwen, De Wolf, Pouwer, Lissenberg and Burger2000: Amersfoort 1; Bunnik & Cremer, Reference Bunnik and Cremer2011: Amersfoort New). The sands were deposited in a shallow-marine environment. The presence of augite in the heavy mineral assemblage (Cleveringa et al., Reference Cleveringa, Meijer, Van Leeuwen, De Wolf, Pouwer, Lissenberg and Burger2000: 208) indicates reworking of Rhine sediments (Urk Formation) from the ice-pushed ridges. The coarsening-upward trend and the shell beds at 23.77–25.00 m and 19.39–19.80 m below surface (core Amersfoort New; Fig. 5) may represent shallowing of the water depth, wave action and near-shore beach conditions (Cleveringa et al., Reference Cleveringa, Meijer, Van Leeuwen, De Wolf, Pouwer, Lissenberg and Burger2000). The large thickness of this unit in Amersfoort 1 and Amersfoort New is the result of the large accommodation space created by rapid sea-level rise during E4a–E4b (Zagwijn, Reference Zagwijn1996, his fig. 15). In core Den Treek, zone E5 is only 0.83 m thick and consists of clay, whereas the coarse-grained shell-bearing sands of core Amersfoort 1 and Amersfoort New are missing. It shows the pinching out of the coastal sediments towards the basin margin (Fig. 3).
In the second part of zone E5, loam and clay with shell fragments were deposited in Amersfoort 1 and Amersfoort New (Figs 4 and 5). The transition of coarse sand to clay is abrupt and may reflect that sea-level rise slowed down. Cleveringa et al. (Reference Cleveringa, Meijer, Van Leeuwen, De Wolf, Pouwer, Lissenberg and Burger2000: 211) even suggest a sea-level lowering during the second part of pollen zone E5. However, the lithological change can be explained by shallowing or partial closure of the basin. An eastward longshore current along the northern margin of the ice-pushed ridges (Haarlem–Amsterdam–Het Gooi) may have formed a spit along the northern margin of the Amersfoort Basin and a more sheltered low-energy basin south of the spit in which clay and silt were deposited. Similar environmental changes and barrier formation were proposed by De Gans et al. (Reference De Gans, Beets and Centineo2000: 147) and Van Leeuwen et al. (Reference Van Leeuwen, Beets, Bosch, Burger, Cleveringa, Van Harten, Waldemar Herngreen, Kruk, Langereis, Meyer, Pouwer and De Wolf2000: 181) in the Amsterdam Basin.
The elevation of the top of the salt-marsh clay (zone E5) is different in the three cores (Fig. 3). In core Den Treek, the top is at 13.46 m below surface (−6.46 m NAP); while in core Amersfoort 1 the top is at 13.21 m below surface (−10.51 m NAP) and in core Amersfoort New at 15 m (−12.08 m NAP). Since the clay of zone E5 changes into peat of zone E6, erosion of the top of the clay can be excluded and the elevation differences are explained by differential compaction of the thicker Eemian clay and organic units in the centre of the basin (cf. De Gans et al., Reference De Gans, Beets and Centineo2000: 156 for the Amsterdam Basin). Furthermore, the high elevation and pinching out of the salt-marsh clay in core Den Treek demonstrates that sea level in the Amersfoort Basin reached its highest position (−6.46 m NAP) at the end of zone E5. This is in contrast to Zagwijn (Reference Zagwijn1983, Reference Zagwijn1996), who assumed highest sea level at the end of zone E4b at −10 m NAP, and also in contrast to Cleveringa et al., (Reference Cleveringa, Meijer, Van Leeuwen, De Wolf, Pouwer, Lissenberg and Burger2000: 211) who suggested a sea-level lowering during the second part of pollen zone E5. The high sea level at the end of Eemian E5 is in accordance with De Clercq et al. (Reference De Clercq, Missiaen, Wallinga, Zurita Hurtado, Versendaal, Mathys and De Batist2018) and Vansteenberge et al. (Reference Vansteenberge, Verheyden, Genty, Blamart, Goderis, Van Malderen, Vanhaecke, Hodel, Gillikin, Ek, Quinif, Cheng, Edwards and Claeys2019: 33, 35), who indicated that peak eustatic sea level occurred at the end of the Eemian and rapidly fell at the end of MIS5e after 118 ka. There is no evidence for abrupt sea-level oscillations during the Eemian highstand in the Amersfoort record other than sea-level rise at the onset and fall at the end of the highstand (cf. Long et al., Reference Long, Barlow, Busschers, Cohen, Gehrels and Wake2015).
The pollen assemblage of zone E5 is dominated by Carpinus and Picea indicating that the forest species composition had changed (Figs 4–6). Thermophilous trees like Quercus, Corylus and Ulmus show lower values in comparison to previous zones, indicating lower summer temperatures (Zagwijn, Reference Zagwijn1996: 465). Highest Carpinus values occur in core Den Treek (up to 45%) in comparison to Amersfoort 1 (40%) and Amersfoort New (25%). The dominance of Carpinus pollen and its gradual decrease from basin margin towards basin centre demonstrates the existence of Carpinus forests on the ice-pushed ridge, where the growing conditions were favourable in E5 (Fig. 7).
The increase of Picea and Abies in zone E5 in core Amersfoort 1 and Amersfoort New (Figs 4 and 5) reflects an increase of coniferous forest elements in the regional vegetation (oligocratic stage) which may be related to soil acidification and decreasing soil fertility of the ice-pushed ridges (Birks & Birks, Reference Birks and Birks2004). In core Den Treek, Picea is present for the first time in zone E5, coinciding with the lithological transition from peat (zone E4b) to sand and clay (zone E5) (Fig. 6). However, in cores Amersfoort 1 and Amersfoort New Picea occurs earlier for the first time in zone E4a/b at the transition of peat to reworked peat and clastic material with shell remains, indicating the first influence of the transgression. This different timing and coincidence with a lithological change may indicate that Picea pollen in low values in zone E4a/b at Amersfoort were transported as allochthonous pollen together with the clastic sediment provided by the Rhine (Busschers et al., Reference Busschers, Van Balen, Cohen, Kasse, Weerts, Wallinga and Bunnik2008; Peeters et al., Reference Peeters, Busschers and Stouthamer2015).
The spatial increase of Picea in zone E5 from basin margin (10%, Fig. 6) to basin centre (35%, Fig. 5) possibly illustrates the influx of allochthonous pollen in the shallow-marine environment during zone E5, since zone E5 consists mostly of clastic sediments. Pinus, Picea and Abies may easily be overrepresented in clay deposits by allochthonous pollen influx from the hinterland (Traverse & Ginsburg, Reference Traverse and Ginsburg1967; Heusser & Balsam, Reference Heusser and Balsam1977; Chowdhury, Reference Chowdhury1982). However, Picea values are high in zone E5 suggesting regional presence on the ice-pushed ridges (Fig. 7). The presence of Picea in the peat beds of zone E6 in the three cores proves the autochtonous presence of Picea in the regional vegetation around the Amersfoort Basin during the late Eemian.
Alnus on the other hand shows the opposite spatial trend to Picea. Alnus values are high in zone E5 (and in E4b, E6, EW1) in the basin marginal core Den Treek (Fig. 6) and low values occur in core Amersfoort New (Fig. 5). This demonstrates the local favourable growth conditions for Alnus in fresh-water marshes along the basin margin, in comparison to the shallow-marine conditions towards the basin centre (Fig. 7).
Abies is present for the first time in zone E5 in cores Amersfoort 1 and Amersfoort New and is increasing in the upper part of zone E5 to 5% (Figs 4 and 5). Picea and Abies can tolerate cold winter conditions, although Abies cannot stand very low winter temperatures (Zagwijn, Reference Zagwijn1996). According to Zagwijn (Reference Zagwijn1992), the spread of Abies in the later part of the Eemian (E5-6) was related to an oceanic climate with high precipitation, cool summers and relatively warm winters associated with high sea level. The presence of Ilex in zone E5 in the three diagrams (Supplement Figs S4–S6) supports the relatively mild winter conditions. This is in agreement with Van Geel et al. (Reference Van Geel, Klink, Pals and Wiegers1986) who conclude that the expansion of Picea (and Abies) at the E5 to E6a transition is not related to a decline in mean temperature since the presence of Ilex and Hedera in their pollen zone E6a indicates mild winter temperatures. Higher effective precipitation may have caused increased leaching and soil acidification of the ice-pushed ridges, favouring Picea growth.
Chenopodiaceae form a continuous curve in the clay units of zone E5 in the three cores (Figs 4–6). In combination with the occurrence of foraminifera and dinoflagellates in core Amersfoort New (Supplement full diagram Fig. S5) and dinoflagellate cysts in core Amersfoort 1, it indicates a basin-marginal depositional environment (Zagwijn, Reference Zagwijn1961; Bunnik & Cremer, Reference Bunnik and Cremer2011). Peak values of Chenopodiaceae in the upper part of E5 (Figs 4 and 5) probably indicate local presence of intertidal or supratidal salt or brackish water marshes or tidal litter zones (Bohncke, Reference Bohncke and Schoute1984; Kasse, Reference Kasse1988; Cleveringa et al., Reference Cleveringa, Meijer, Van Leeuwen, De Wolf, Pouwer, Lissenberg and Burger2000: 212). Species like Atriplex littoralis and Atriplex prostrata are reported from present-day tidal litter zones (FLORON, 2021). The clay in core Amersfoort New (15.00–16.54 m below surface) is firm and crumbly indicating soil ripening during deposition in the intertidal or supratidal marsh environment (Pons & Zonneveld, Reference Pons and Zonneveld1965).
Eemian E6
The late Eemian and Early Weichselian (E6-EWII) sedimentary succession and vegetation development is largely similar in the three cores (Figs 4–6). This can be explained by the palaeogeographical development of the region (Fig. 7). During the Eemian, there was a strong contrast between the deeper part of the basin (core Amersfoort 1 and Amersfoort New) with shallow-marine conditions and the basin margin (Den Treek) with soil formation and peat growth. Local geomorphological differences in relief and drainage and associated differences in ecological conditions were important then. In the final stages of the Eemian and Early Weichselian, the basin was largely filled, landscape gradients decreased and the vegetation became more uniform over the region (Fig. 7). However, the thickness of the E6 to EWII interval increases from the basin margin to the centre from 1.86 m in core Den Treek to 4.51 m in core Amersfoort 1 and 5.14 m in core Amersfoort New, reflecting the ongoing infill of the former glacial basin (Fig. 3). The different thickness of zone E6 in cores Amersfoort 1 (36 cm) and nearby Amersfoort New (114 cm) may be related to different boundary definitions for the E6-EWI transition. The E6-EWI boundary in core Amersfoort 1 is based on the strong increase of Ericales and Sphagnum found within the peat layer (Fig. 4) (cf. Zagwijn, Reference Zagwijn1961; Chaline & Jerz, Reference Chaline and Jerz1984), and as a consequence the high Pinus values are attributed to zone EW1. In core Amersfoort New, the increase of Ericales seems to occur somewhat later (at the peat to sand transition) and the high Pinus values are then incorporated in zone E6 (Fig. 5) (cf. Bunnik & Cremer, Reference Bunnik and Cremer2011). When the high Pinus values at the base of pollen zone EW1 of core Amersfoort 1 would be incorporated in zone E6 the thickness of zone E6 would increase to 94 cm, which is comparable to 114 cm in core Amersfoort New.
The E5 to E6 transition coincides with a rapid change in lithology from clay to peat (Fig. 3). However, erosion is not assumed since the transition indicates a change to a lower energy environment. The abrupt disappearance of Chenopodiaceae (Figs 4–6), dinoflagellate cysts (core Amersfoort 1; Zagwijn, Reference Zagwijn1961) and dinoflagellates (core Amersfoort New; Supplement full diagram Fig. S5) all reflect the change of a brackish-water marsh environment to fresh-water peat formation.
The thermophilous trees Carpinus, Corylus and Quercus show a strong or abrupt (Amersfoort New) decrease at the start of zone E6, indicating climate cooling (Figs 4–6). Picea and Abies are important in the lower part of this zone and Pinus shows a strong increase up to 90% in the upper part in core Amersfoort New (Fig. 5). Pinus values are much lower in core Amersfoort 1 because of local dominance of Alnus. The coniferous vegetation was probably present on the nearby ice-pushed ridge, while Alnus was an important element in the local vegetation (Fig. 7). Picea and Abies are considered part of the regional vegetation as their pollen occur in peat beds and hence will not be due to floating by river water from the hinterland. The changes reflect the transition to a coniferous, boreal forest at the end of the Eemian (zone E6). The decrease of Abies in the upper part may indicate further decreasing winter temperatures (Zagwijn, Reference Zagwijn1996). The climate cooling resulted in the onset of sea-level fall, and may offer an explanation for the rapid lithological transition from clay to peat (Cleveringa et al., Reference Cleveringa, Meijer, Van Leeuwen, De Wolf, Pouwer, Lissenberg and Burger2000: 212).
Alnus shows high values in core Den Treek and in the lower part of zone E6 in core Amersfoort 1, while Alnus is absent in zone E6 in core Amersfoort New (Figs 4–6). The high values can be explained by local presence of Alder in Den Treek and Amersfoort 1 (Fig. 7). The presence of Alnus points to eutrophic conditions in the basal part of the peat that overlies the clay of zone E5. Similar successions from brackish-water marsh to alder forest conditions are reported during other interglacials in the final stage of transgression (Kasse, Reference Kasse1988, late Tiglian; Beets & Van der Spek, Reference Beets and Van der Spek2000, Holocene). The absence of Alnus and first expansion of Spagnum in core Amersfoort New point to more open and oligotrofic conditions towards the central part of the basin.
The role of Abies in the biostratigraphic zonation of the Eemian seems unclear (Cleveringa et al., Reference Cleveringa, Meijer, Van Leeuwen, De Wolf, Pouwer, Lissenberg and Burger2000: 212). There is agreement that Abies occurs in the Late Eemien. According to Zagwijn (Reference Zagwijn1961), Abies is especially important in zone E6a (diagram Tunnelpit). However, in core Amersfoort 1 and Amersfoort New Abies is well represented in the upper part of zone E5 and basal part of E6 (Figs 4 and 5). In core Den Treek Abies is missing in zone E5 and more important in the upper part of zone E6 (Fig. 6). Similar considerations related to the early presence of Picea in zone E4 by allochthonous influx of pollen may apply to Abies. The presence of Abies in zone E5 in the clastic sediments in the more central parts of the Amersfoort Basin, compared to the basin margin, may be related to the open water depositional environment and influx of reworked pollen, supplied by the Rhine from the German hinterland.
Zone EWI (Herning Stadial)
The transition of late Eemian zone E6 to Weichselian Early Glacial zone EWI occurs in the upper part of a peat bed or coincides with a lithological change from peat to sandy sediments (Figs 4–6). This zone is characterised in the three cores by a decrease in arboreal pollen and strong increase of Ericales and Sphagnum. The strong rise of Ericales is regarded as the Eemian to Weichselian boundary (Zagwijn, Reference Zagwijn1961; Chaline & Jerz, Reference Chaline and Jerz1984; Börner et al., Reference Börner, Hrynowiecka, Stachowicz-Rybka, Niska, Moskal-del Hoyo, Kuznetsov, Maksimov and Petrov2018). However, according to Cleveringa et al. (Reference Cleveringa, Meijer, Van Leeuwen, De Wolf, Pouwer, Lissenberg and Burger2000: 212) oligotrophic peat growth started already earlier in other locations. Pinus values decrease in zone EWI and the thermophilous trees Carpinus, Corylus and Quercus mostly disappear. Low values of thermophilous trees in the sandy intervals can be attributed to reworking of older Eemian material. Pinus, Picea and Betula form the main taxa in the boreal forest (Figs 4–6). Alnus is still present in cores Amersfoort 1 and Den Treek, reflecting local presence of Alnus woodland (Fig. 7). Betula is an important element in the vegetation now, although the values differ between the cores ranging from 5% to 25% (core Amersfoort 1). Higher Betula values may be expected closer to the basin margin. The increase of Betula indicates a change from a coniferous forest during the late Eemian (E6) to a mixed pine-birch woodland in the Early Weichselian (EWI).
Artemisia is present in low values in the cores, especially in the upper part of zone EWI (Figs 4–6). The upland herbs and Poaceae show a peak in core Den Treek and Amersfoort 1, reflecting the decline of trees as effect of the climate cooling. This is also reflected in the high diversity of herbs in this zone. Dry conditions probably prevailed on the higher parts of the ice-pushed ridge. The decreasing vegetation cover resulted in increasing landscape dynamics and a change from peat formation to sand deposition (Fig. 3) (cf. Caspers et al., Reference Caspers, Merkt, Müller and Freund2002: 50; Herning Stadial). The sand interval in core Amersfoort New (from 13.86 to 12.64 m below surface) shows a coarsening-upward trend from fine to medium coarse and coarse sand followed by a weakly developed fining-upward trend (Fig. 3). The grain size, the grain-size trend and sedimentary bedding point to fluvial deposition, possibly in a prograding alluvial fan environment. The sediment was most likely eroded from the ice-pushed ridges in the west and transported by local streams to the investigated sites during zone EWI (Fig. 7). Towards the top of the zone the environment changed to open water conditions, given the occurrence of the lacustrine Pediastrum algae. Despite the cold and dry climate, the local environment changed into a peatland, possibly related to the establishment of deep seasonal frost or local permafrost and poorer drainage conditions.
Zone EWII (Amersfoort/Brørup Interstadial)
The zone is characterised by a strong decrease in Ericales and Sphagnum (Figs 4–6). Core Amersfoort 1 and Den Treek show first an increase in Betula followed by a strong increase in Pinus in the three cores, which is explained by vegetation succession related to climate warming (cf. Caspers et al., Reference Caspers, Merkt, Müller and Freund2002: 51; Brørup Interstadial). The slight increase of Quercus at the end of the zone may represent zone EWIIb (cf. Zagwijn, Reference Zagwijn1961). The pollen assemblage reflects the re-establishment of a boreal coniferous forest on or very close to the site. Ferns (Dryopteris/Filicales/Monolete psilate) are a characteristic component in the peat-forming vegetation at the sites. The vegetation cover was more dense and the landscape was more stable as reflected by the peat growth in this zone. The erosion of the ice-pushed ridge and deposition of sand in alluvial fans came to a hold, which contrasts with the previous zone EWI.
Discussion
Comparison of vegetation development of different sites in the Netherlands
Long and (semi-)continuous LS, Eemian and Early Weichselian shallow-marine, estuarine, fluvial and local deposits are found in Saalian deep glacial basins in the Netherlands such as in the Amersfoort Basin (Zagwijn, Reference Zagwijn1961; Cleveringa et al., Reference Cleveringa, Meijer, Van Leeuwen, De Wolf, Pouwer, Lissenberg and Burger2000), Amsterdam Basin (De Gans et al., Reference De Gans, Beets and Centineo2000; Van Leeuwen et al., Reference Van Leeuwen, Beets, Bosch, Burger, Cleveringa, Van Harten, Waldemar Herngreen, Kruk, Langereis, Meyer, Pouwer and De Wolf2000), Dinkel-Nordhorn Basin (Van Huissteden et al., Reference Van Huissteden, Vandenberghe and Van Geel1986, core Kamphuis), IJssel Basin (Busschers et al., Reference Busschers, Kasse, Van Balen, Vandenberghe, Cohen, Weerts, Wallinga, Johns, Cleveringa and Bunnik2007) and in the palaeo-Vecht valley of the central Netherlands (Wiggers, Reference Wiggers1955; Peeters et al., Reference Peeters, Busschers and Stouthamer2015, Reference Peeters, Busschers, Stouthamer, Bosch, Van den Berg, Wallinga, Versendaal, Bunnik and Middelkoop2016) (Fig. 8A) (Table 1). These basins offered a large accommodation space for LS and Eemian deposits because of glacial scouring and subsequent Eemian sea-level rise.

Fig. 8. (A) Map of the late Saalian ice-pushed ridges and glacial basins and Eemian fluvial and coastal deposits to illustrate the environmental setting of the investigated sites. (B–D) Palaeogeographic maps of the latest Saalian, Eemian and Weichselian Early Glacial, respectively (after Peeters et al., Reference Peeters, Busschers and Stouthamer2015).
Table 1. Comparison of the pollen composition of the Late Saalian to Early Weichselian pollen zones in the Amersfoort, Amsterdam, IJssel basins and Palaeo-Vecht valley

Characteristic species are indicated in the left column and additional information is given in the site columns (r. is reworked pollen). Coloured bars represent depositional environment: light blue is lacustrine; blue is shallow marine; green is fluvial; yellow is aeolian and local fluvial.
The stratotype of the Eemian in the Amsterdam Basin (Core Amsterdam-Terminal: B25E0913; +1.45 m NAP) contains a 45-m long record of LS and Eemian deposits (Table 1) (De Gans et al., Reference De Gans, Beets and Centineo2000; Van Leeuwen et al., Reference Van Leeuwen, Beets, Bosch, Burger, Cleveringa, Van Harten, Waldemar Herngreen, Kruk, Langereis, Meyer, Pouwer and De Wolf2000), which is much longer than the same sequence in the Amersfoort Basin (17 m in core Amersfoort New and 1.5 m in core Den Treek) (Fig. 3). In addition, the LS and Eemian sedimentary infill of the Amsterdam Basin largely consists of fine-grained sediments deposited in low-energy environments, while high-energetic, basin-marginal, coarse-grained intervals (E4b–E5) occur in the Amersfoort Basin. Therefore, especially the lower part of core Amsterdam-Terminal with pollen zones LS (Betula-Pinus, reworked pollen (Quercus, Corylus, Picea), Artemisia, Juniperus), E1 (Betula, Juniperus), E2 (Pinus), E3 (Quercus), E4a (Corylus) and E4b (Taxus) is well developed (Van Leeuwen et al., Reference Van Leeuwen, Beets, Bosch, Burger, Cleveringa, Van Harten, Waldemar Herngreen, Kruk, Langereis, Meyer, Pouwer and De Wolf2000, their fig. 14). The current stratotype Amsterdam-Terminal reveals a fully developed LS to Eemian transition and contains the boundary stratotype for the base of the Eemian Stage (Gibbard, Reference Gibbard2003).
The Saalian, Eemian and Weichselian infill in the IJssel Basin was studied by Burck (Reference Burck1951), Van der Vlerk and Florschütz (Reference Van der Vlerk and Florschütz1953: 208), Van de Meene and Zagwijn (Reference Van de Meene and Zagwijn1978) and Busschers et al. (Reference Busschers, Kasse, Van Balen, Vandenberghe, Cohen, Weerts, Wallinga, Johns, Cleveringa and Bunnik2007). During the Saalian deglaciation, the IJssel Basin was largely filled with glacio-lacustrine and deltaic Rhine deposits (Fig. 8B). LS residual channels provided accommodation space and were filled with mostly fine-grained flood basin deposits that reveal a LS and Eemian succession (LS-E4b) (Table 1) (Busschers et al., Reference Busschers, Kasse, Van Balen, Vandenberghe, Cohen, Weerts, Wallinga, Johns, Cleveringa and Bunnik2007: their fig. 8 and online supplement B, core 27G0118, unit A1–A2).
The Eemian infill of the palaeo-Vecht valley in the Noordoostpolder (central Netherlands) was studied by Peeters et al. (Reference Peeters, Busschers and Stouthamer2015, Reference Peeters, Busschers, Stouthamer, Bosch, Van den Berg, Wallinga, Versendaal, Bunnik and Middelkoop2016). During the Eemian, this region was part of the Rhine estuary, situated in between the fluvial-dominated upstream part of the Rhine in the IJssel Basin (Busschers et al., Reference Busschers, Kasse, Van Balen, Vandenberghe, Cohen, Weerts, Wallinga, Johns, Cleveringa and Bunnik2007) and the shallow-marine environments in the former glacial basins to the west (De Gans et al., Reference De Gans, Beets and Centineo2000) (Fig. 8C). A 5–10 m-thick sequence, consisting of fluvial, flood-basin and estuarine sediments, contains the complete Eemian vegetation cycle from LS up to Weichselian Early Glacial (Peeters et al., Reference Peeters, Busschers, Stouthamer, Bosch, Van den Berg, Wallinga, Versendaal, Bunnik and Middelkoop2016; core Rutten-Gemaalweg: B15F1501; their fig. 5, Appendix S4a) (Table 1).
South of the maximum Saalian ice extent, Eemian deposits and soils are scarce and discontinuous because of limited accommodation space and later Weichselian erosion (Van den Toorn, Reference Van den Toorn1967: 76–83; Bisschops et al., Reference Bisschops, Broertjes and Dobma1985: 102–104; Bosch et al., Reference Bosch, Cleveringa and Meijer2000; Schokker et al., Reference Schokker, Cleveringa and Murray2004).
The Late Saalian (zone LS) is dominated by Pinus and herbs (Van Leeuwen et al., Reference Van Leeuwen, Beets, Bosch, Burger, Cleveringa, Van Harten, Waldemar Herngreen, Kruk, Langereis, Meyer, Pouwer and De Wolf2000; Busschers et al., Reference Busschers, Kasse, Van Balen, Vandenberghe, Cohen, Weerts, Wallinga, Johns, Cleveringa and Bunnik2007; Peeters et al., Reference Peeters, Busschers, Stouthamer, Bosch, Van den Berg, Wallinga, Versendaal, Bunnik and Middelkoop2016) (Table 1). Pre-Quaternary pollen types (Busschers et al., Reference Busschers, Kasse, Van Balen, Vandenberghe, Cohen, Weerts, Wallinga, Johns, Cleveringa and Bunnik2007) and Picea, Quercus and Corylus (Van Leeuwen et al., Reference Van Leeuwen, Beets, Bosch, Burger, Cleveringa, Van Harten, Waldemar Herngreen, Kruk, Langereis, Meyer, Pouwer and De Wolf2000; Peeters et al., Reference Peeters, Busschers, Stouthamer, Bosch, Van den Berg, Wallinga, Versendaal, Bunnik and Middelkoop2016) indicate reworking of older material and deposition of allochthonous pollen in the clastic sediments (Fig. 8B).
Early Eemian pollen zones E1–2 are dominated by Betula and Pinus (Table 1). Juniperus and Hippophae indicate an open woodland and dynamic landscape and soil conditions in which pioneer species could maintain in the early stages of the Eemian (Peeters et al., Reference Peeters, Busschers, Stouthamer, Bosch, Van den Berg, Wallinga, Versendaal, Bunnik and Middelkoop2016). The presence of Juniperus and Hippophae was also registered in zone E1 in the Amsterdam Basin (Van Leeuwen et al., Reference Van Leeuwen, Beets, Bosch, Burger, Cleveringa, Van Harten, Waldemar Herngreen, Kruk, Langereis, Meyer, Pouwer and De Wolf2000) and the IJssel Basin (Busschers et al., Reference Busschers, Kasse, Van Balen, Vandenberghe, Cohen, Weerts, Wallinga, Johns, Cleveringa and Bunnik2007, core 27G0118) (Table 1). In the Amersfoort records (Figs 4–6), the Saalian late glacial and early Eemian vegetation development (LS-E1) are not registered because of the higher position at the margin of the former glacial basin.
During pollen zones E3–E4a, Quercus and Corylus are important elements of the deciduous forest vegetation. The continuous presence of Ulmus and Fraxinus indicates high species diversity of the forest in the palaeo-Vecht valley (Peeters et al., Reference Peeters, Busschers, Stouthamer, Bosch, Van den Berg, Wallinga, Versendaal, Bunnik and Middelkoop2016), which resembles core Amersfoort 1 (Fig. 4) and the cores in the IJssel Basin (Busschers et al., Reference Busschers, Kasse, Van Balen, Vandenberghe, Cohen, Weerts, Wallinga, Johns, Cleveringa and Bunnik2007). Low values of Tilia occur at the end of zone E3 in the Vecht valley (Peeters et al., Reference Peeters, Busschers, Stouthamer, Bosch, Van den Berg, Wallinga, Versendaal, Bunnik and Middelkoop2016), whereas in core Amersfoort 1 (Fig. 4) and in the IJssel Basin (Busschers et al., Reference Busschers, Kasse, Van Balen, Vandenberghe, Cohen, Weerts, Wallinga, Johns, Cleveringa and Bunnik2007) low values of Tilia are reported for zone E4.
Adjacent to the LS residual channels in the IJssel Basin, a soil and thin peat bed, characterised by high values of Pinus, Quercus and Corylus, reflect Eemian zones E2, E3 and E4a (Busschers et al., Reference Busschers, Kasse, Van Balen, Vandenberghe, Cohen, Weerts, Wallinga, Johns, Cleveringa and Bunnik2007, their figs 4, 5, 8: core 27H0282, units A1-2, circa −7.9 to −7.7 m NAP) (Table 1). This condensed section resembles the lower part of core Den Treek at the margin of the Amersfoort Basin (Fig. 6). Due to the higher position in the landscape and limited accommodation space, soil formation and slow organic accumulation occurred during the early Eemian when sea level and groundwater level were still lower.
The first influence of the Eemian transgression in the Amsterdam Basin was registered by the transition of a fresh-water diatomite (pollen zone E3) to a brackish-water dark-coloured sapropel (Harting Layer) (pollen zone E4a) (Van Leeuwen et al., Reference Van Leeuwen, Beets, Bosch, Burger, Cleveringa, Van Harten, Waldemar Herngreen, Kruk, Langereis, Meyer, Pouwer and De Wolf2000: 166) (Table 1). The timing of the transgression is equal to the Amersfoort Basin (Figs 4 and 5) (Zagwijn, Reference Zagwijn1961; Cleveringa et al., Reference Cleveringa, Meijer, Van Leeuwen, De Wolf, Pouwer, Lissenberg and Burger2000), although the transition is recorded at circa −60 m NAP in the Amsterdam Basin.
The Eemian transgression in the palaeo-Vecht valley is reflected by the presence of dinoflagellates in pollen zones E4 and E5 (Table 1). It is related to sea-level rise and drowning of the flood basin, culminating in the sea-level highstand during pollen zone E5 (Peeters et al., Reference Peeters, Busschers, Stouthamer, Bosch, Van den Berg, Wallinga, Versendaal, Bunnik and Middelkoop2016: 56). However, in contrast to zone E5 in the Amersfoort and Amsterdam basins, Chenopodiaceae values are low in the palaeo-Vecht valley. It indicates that salt or brackish water marshes did not exist in the more fluvial-dominated part of the Eemian delta (Fig. 8C).
In the IJssel valley, there are no indications of salt-water deposition at the E3 to E4a boundary, which can be explained by the more upstream and higher position in the Rhine deltaic system (Fig. 8C). However, during Carpinus zone E5, dinoflagellates are present at a depth between −7.3 and −5.8 m NAP in the IJssel valley (Busschers et al., Reference Busschers, Kasse, Van Balen, Vandenberghe, Cohen, Weerts, Wallinga, Johns, Cleveringa and Bunnik2007, online supplement B). At the margin of the Amersfoort Basin (Fig. 6, core Den Treek), the highest Eemian E5 salt-water deposits were found at −6.5 m NAP, which corresponds well with the elevation of zone E5 in the IJssel Basin (assuming a more or less comparable tectonic and glacio-isostatic history of the two regions). However, Chenopodiaceae indicating brackish to salt-water marshes, are lacking in the IJssel valley. The contrast between microfauna and flora analyses can be explained by landward transport of sediment and salt-water microfossils in a fresh-water tidal environment (cf. Storme et al., Reference Storme, Bastiaens, Crombé, Cruz, Louwye, Verhegge and Deforce2020).
Picea is present in low values in zone E4(b) in the palaeo-Vecht valley (Peeters et al., Reference Peeters, Busschers, Stouthamer, Bosch, Van den Berg, Wallinga, Versendaal, Bunnik and Middelkoop2016: core B15F1501) and IJssel Basin (Busschers et al., Reference Busschers, Kasse, Van Balen, Vandenberghe, Cohen, Weerts, Wallinga, Johns, Cleveringa and Bunnik2007: core B27G0118). This resembles the Amersfoort 1 and Amersfoort New pollen records (Figs 4 and 5). However, in the Amsterdam-Terminal core and core Den Treek (Fig. 6), Picea is present as a continuous curve from pollen zone E5 onwards (Table 1). Abies is an important element in the upper part of zone E5 in the IJssel valley (Busschers et al., Reference Busschers, Kasse, Van Balen, Vandenberghe, Cohen, Weerts, Wallinga, Johns, Cleveringa and Bunnik2007: core B27H0282), which resembles the pollen assemblage of cores Amersfoort 1 and Amersfoort New (Figs 4 and 5). However, in cores Den Treek (Fig. 6) and Amsterdam-Terminal (Van Leeuwen et al., Reference Van Leeuwen, Beets, Bosch, Burger, Cleveringa, Van Harten, Waldemar Herngreen, Kruk, Langereis, Meyer, Pouwer and De Wolf2000) Abies is present in zone E6 only (Table 1).
Pollen zone E5 is normally characterised by the presence of Carpinus (Zagwijn, Reference Zagwijn1961). However, Carpinus values are relatively low to almost absent in the palaeo-Vecht valley (Peeters et al., Reference Peeters, Busschers, Stouthamer, Bosch, Van den Berg, Wallinga, Versendaal, Bunnik and Middelkoop2016), when compared to the high Carpinus values in the Amersfoort (Figs 4–6) (Zagwijn, Reference Zagwijn1961), Amsterdam (Van Leeuwen et al., Reference Van Leeuwen, Beets, Bosch, Burger, Cleveringa, Van Harten, Waldemar Herngreen, Kruk, Langereis, Meyer, Pouwer and De Wolf2000) and IJssel basins (Busschers et al., Reference Busschers, Kasse, Van Balen, Vandenberghe, Cohen, Weerts, Wallinga, Johns, Cleveringa and Bunnik2007) (Table 1).
The E5–E6 transition in core Amsterdam-Terminal is coarsening upward and silty clays (local pollen zone AT-14/E5) are erosively overlain by a shell bed and shelly sand (attributed to local pollen zones AT-15-16/E6-EW based on few pollen spectra) (Van Leeuwen et al., Reference Van Leeuwen, Beets, Bosch, Burger, Cleveringa, Van Harten, Waldemar Herngreen, Kruk, Langereis, Meyer, Pouwer and De Wolf2000: 172). The shell bed is coarse-grained, contains peat lumps and clay pebbles and the mollusc assemblage consists of a diverse mixture of intertidal and non-marine species. Although it is not clearly stated, Van Leeuwen et al. (Reference Van Leeuwen, Beets, Bosch, Burger, Cleveringa, Van Harten, Waldemar Herngreen, Kruk, Langereis, Meyer, Pouwer and De Wolf2000) seem to assume a marine origin of this interval. However, as peat and non-marine molluscs do not occur below this level, this unit can alternatively be interpreted as a fluvial lag deposit, followed by fluvial sand deposition with large-scale cross bedding. The salt-water shells are possibly reworked from underlying deposits and the U/Th date of 118.2 ± 6.3 ka should be regarded as a maximum age of the deposits. This re-interpretation of the late Eemian (E6-EW) as terrestrial fluvial deposits agrees with the change from salt-water clay deposition (E5) to fresh-water peat formation (E6) in the Amersfoort Basin cores (Figs 4–6) (Table 1). In contrast to the Amsterdam-Terminal core, the late Eemian (E5-E6-EW) succession in the Amersfoort Basin shows a fining-upward sequence with sand changing to low-energy salt-water clay (E5) with high Chenopodiaceae values, followed by fresh-water peat formation (E6). In these low-energy environments at Amersfoort, erosion is unlikely and therefore the Late Eemian–Early Weichselian sequence is more continuous here than in the Amsterdam Basin (Bosch et al., Reference Bosch, Cleveringa and Meijer2000: 143). Therefore, it is suggested to define the national boundary stratotype for the base of the Weichselian Stage in the Amersfoort Basin.
During the Eemian E5 to E6 transition in the IJssel Basin, organic deposition becomes more dominant (Busschers et al., Reference Busschers, Kasse, Van Balen, Vandenberghe, Cohen, Weerts, Wallinga, Johns, Cleveringa and Bunnik2007, units A2 to A3). This is comparable to sedimentary changes in the Amersfoort Basin (Fig. 3). The environmental change to flood-basin peat formation can possibly be explained by climate cooling, start of sea-level decline and decreasing accommodation space during Eemian E6. Zone E6 was interpreted as the Early Glacial Herning Stadial by Busschers et al. (Reference Busschers, Kasse, Van Balen, Vandenberghe, Cohen, Weerts, Wallinga, Johns, Cleveringa and Bunnik2007, their fig. 8), but is dominated by Pinus, Picea and Alnus, and thus reinterpreted to zone E6, in accordance with the Amersfoort Basin (Figs 4–6) (Table 1).
The Eemian to Early Weichselian transition is rarely found in the palaeo-Vecht valley due to later erosion during the Early Glacial (Peeters et al., Reference Peeters, Busschers, Stouthamer, Bosch, Van den Berg, Wallinga, Versendaal, Bunnik and Middelkoop2016) (Fig. 8D). A 3 m interval was assigned to zone E6 (Peeters et al., Reference Peeters, Busschers, Stouthamer, Bosch, Van den Berg, Wallinga, Versendaal, Bunnik and Middelkoop2016, core B15F1501, 12.3-9.3 m below surface), based on the dominance of Pinus and Picea. However, an increase of Calluna, Poaceae and some Artemisia and Hippophae reflects an opening of the vegetation cover and may alternatively be interpreted as the Eemian to Early Weichselian transition (zone EWI) (cf. Zagwijn, Reference Zagwijn1961; Caspers et al., Reference Caspers, Merkt, Müller and Freund2002: 50; Börner et al., Reference Börner, Hrynowiecka, Stachowicz-Rybka, Niska, Moskal-del Hoyo, Kuznetsov, Maksimov and Petrov2018) (Table 1). The Eemian to Early Weichselian transition and the beginning of the Early Weichselian (zone EWI) in the IJssel valley was previously interpreted as the Early Glacial Brørup Interstadial (Busschers et al., Reference Busschers, Kasse, Van Balen, Vandenberghe, Cohen, Weerts, Wallinga, Johns, Cleveringa and Bunnik2007, their fig 8) (Table 1). However, the pine forest vegetation opens with higher Calluna values, an increase of Poaceae and sporadic presence of Artemisia (Table 1). Betula is increasing in zone EWI showing a change towards a boreal birch-pine woodland. A similar Calluna and Betula increase was observed in the Amersfoort Basin at the Eemian to Early Weichselian transition (Figs 4–6). The increase of Juniperus (core B27H0047) points to further opening of the vegetation and a return to pioneer conditions in the course of zone EWI.
Following zone EWI, there is an increase of Betula and maximum values of Pinus (10.4 m below surface) in the palaeo-Vecht valley that reflect the return to boreal forest conditions (Peeters et al., Reference Peeters, Busschers, Stouthamer, Bosch, Van den Berg, Wallinga, Versendaal, Bunnik and Middelkoop2016). This part has been re-interpreted as the Amersfoort/Brørup Interstadial (EWII), thus reflecting the Amersfoort diagrams (Figs 4–6).
Impact of geomorphology and sedimentary environment on Eemian pollen records
Accommodation space
The deep Saalian glacial basins in the Netherlands offered large accommodation space for Eemian sedimentation. Despite the depth of the basins, the LS to Eemian transition and zone E1 are locally missing (Amersfoort basin). However, the completeness of the Eemian records depends on the location and position in the basins (Figs 7 and 8A). Deeper parts of the basins and a more sheltered position outside the active Rhine course have the highest preservation potential and reveal the late Saalian to Eemian transition (LS-E1, Van Leeuwen et al., Reference Van Leeuwen, Beets, Bosch, Burger, Cleveringa, Van Harten, Waldemar Herngreen, Kruk, Langereis, Meyer, Pouwer and De Wolf2000: core Amsterdam-Terminal; Busschers et al., Reference Busschers, Kasse, Van Balen, Vandenberghe, Cohen, Weerts, Wallinga, Johns, Cleveringa and Bunnik2007: IJssel Basin core 27G0118; Peeters et al., Reference Peeters, Busschers, Stouthamer, Bosch, Van den Berg, Wallinga, Versendaal, Bunnik and Middelkoop2016: palaeo-Vecht valley core 15F1501) (Table 1). The flanks of the basins show later registration as demonstrated in cores Amersfoort 1 (Fig. 4) and Amersfoort New (Fig. 5), where the Eemian sequence starts with gyttja and peat formation during pollen zone E2. The absence of the early Eemian does not necessarily imply non-deposition since the retreat of the ice (Fig. 2). It may be related to local remnants of dead ice in the basins (Zagwijn, Reference Zagwijn1961), but more importantly landscape instability may have persisted during the LS and early stages of the Eemian, due to the restricted pionier vegetation cover. Therefore, clastic deposition may have continued in some areas and dominated over organic accumulation in the early stages of the Eemian (Fig. 2). At the basin margins and higher locations, the start of Eemian registration is even later and occurred during E3 and E4b–E5 (Busschers et al., Reference Busschers, Kasse, Van Balen, Vandenberghe, Cohen, Weerts, Wallinga, Johns, Cleveringa and Bunnik2007: core 27H0282; core Den Treek Fig. 6) (Table 1). Therefore, the first part of the Eemian is reflected by non-deposition and soil formation, because of the high position in the landscape. Only later, peat formation started because of groundwater-level rise, probably related to sea-level rise. Thus, the base of the Eemian sequence is time-transgressive and related to the geomorphological conditions, as comparable to the Holocene coastal evolution (Beets & Van der Spek, Reference Beets and Van der Spek2000).
Equally to the start of Eemian registration, the onset of the Eemian transgression is time-transgressive and dependent on the geomorphological position of the investigated sites in relation to the existing glacial relief and location in the Eemian delta (Fig. 8C). In the western basins, the Eemian transgression is registered as an erosional boundary and reworking of peat deposits at the E3 to E4a transition (Amersfoort 1 and New: Figs 4 and 5; Van Leeuwen et al., Reference Van Leeuwen, Beets, Bosch, Burger, Cleveringa, Van Harten, Waldemar Herngreen, Kruk, Langereis, Meyer, Pouwer and De Wolf2000: Amsterdam-Terminal). De Gans et al. (Reference De Gans, Beets and Centineo2000) suggested the presence of a sill (threshold) north of the basins that was overtopped synchronously for both the Amsterdam and Amersfoort basins by the Eemian sea-level rise (Fig. 8).
Further upstream in the Eemian delta, the effect of sea-level rise and the Eemian transgression is recorded later. In the palaeo-Vecht valley, the first occurrence of dinoflagellates is registered in pollen zone E4b (Peeters et al., Reference Peeters, Busschers, Stouthamer, Bosch, Van den Berg, Wallinga, Versendaal, Bunnik and Middelkoop2016). In the IJssel valley, dinoflagellates occur in zone E5 in a fresh-water tidal environment (Busschers et al., Reference Busschers, Kasse, Van Balen, Vandenberghe, Cohen, Weerts, Wallinga, Johns, Cleveringa and Bunnik2007). This eastward shift in timing is probably related to sea-level rise and gradual eastward extension of the coastal prism culminating during the sea-level highstand in pollen zone E5. There are no indications in the sedimentary record for abrupt sea-level changes during the Eemian highstand other than sea-level rise at the onset and fall at the end of the highstand (cf. Long et al., Reference Long, Barlow, Busschers, Cohen, Gehrels and Wake2015).
Allochthonous and autochthonous pollen signals
The LS to Eemian to Early Weichselian sedimentary successions in the Netherlands consist mostly of alternations of organic and clastic sediments, formed in freshwater marshes, fluvial and coastal environments. Therefore, the pollen signal is a mixture of allochthonous and autochthonous material, which may hamper ecological and biostratigraphic interpretations. High-energy environments are characterised by the deposition of clastic material (sand and clay) and possible influx of allochthonous pollen by fluvial processes from the hinterland, redistributed by tides and waves in the western part of the delta. The influx of allochthonous pollen can be demonstrated in several intervals.
During the LS and the transition to the Eemian (E1), the pollen record is strongly influenced by the deposition of allochthonous pollen because of landscape instability and erosion due to a sparse vegetation cover and high meltwater-dominated river discharges (Fig. 8B). The presence of pre-Quaternary pollen types, thermophilous trees and high Pinus values in zone LS indicate reworking and depostion of older material following the Saalian deglaciation (Van Leeuwen et al., Reference Van Leeuwen, Beets, Bosch, Burger, Cleveringa, Van Harten, Waldemar Herngreen, Kruk, Langereis, Meyer, Pouwer and De Wolf2000: Amsterdam-Terminal core; Busschers et al., Reference Busschers, Kasse, Van Balen, Vandenberghe, Cohen, Weerts, Wallinga, Johns, Cleveringa and Bunnik2007: core 27G0118). Therefore, the reconstruction of LS climatic variability is difficult. The occurrence of a short-lived climatic cooling event (Kattegat Oscillation) during the LS in the IJssel Basin was postulated by Busschers et al. (Reference Busschers, Kasse, Van Balen, Vandenberghe, Cohen, Weerts, Wallinga, Johns, Cleveringa and Bunnik2007), as was done earlier at Amsterdam-Terminal (Beets et al., Reference Beets, Beets and Cleveringa2006). However, Younger Dryas style climate oscillations during the LS have been questioned (Turner, Reference Turner2000; Caspers et al., Reference Caspers, Merkt, Müller and Freund2002; Brewer et al., Reference Brewer, Guiot, Sánchez-Goñi and Klotz2008).
The influx of allochthonous pollen from the Rhine fluvial system is possibly demonstrated by temporal differences of first occurrence of Picea (E4 or E5) and Abies (E5 or E6) in clastic sediment intervals. The early occurrence of Picea in zone E4 and Abies in zone E5 in the more central part of the Amersfoort Basin, IJssel Basin and palaeo-Vecht valley is possibly related to influx of allochthonous pollen as part of the suspension load of the Rhine flowing along the IJssel valley (Fig. 8C). Saccate pollen types like Pinus, Picea and Abies (pollen with air sacks) can be transported over long distances in air or water, and hence can be overrepresented in open water depositional environments (Traverse & Ginsburg, Reference Traverse and Ginsburg1967; Heusser & Balsam, Reference Heusser and Balsam1977; Chowdhury, Reference Chowdhury1982). The different timing of Picea and Abies in the pollen records questions their stratigraphic value in the pollen zonation of the Eemian (cf. Cleveringa et al., Reference Cleveringa, Meijer, Van Leeuwen, De Wolf, Pouwer, Lissenberg and Burger2000: 212).
Local vegetation development
The regional Eemian vegetation succession, established by Zagwijn (Reference Zagwijn1961), has been recognised in many diagrams in the Netherlands (Van Huissteden et al., Reference Van Huissteden, Vandenberghe and Van Geel1986; Cleveringa et al., Reference Cleveringa, Meijer, Van Leeuwen, De Wolf, Pouwer, Lissenberg and Burger2000; Van Leeuwen et al., Reference Van Leeuwen, Beets, Bosch, Burger, Cleveringa, Van Harten, Waldemar Herngreen, Kruk, Langereis, Meyer, Pouwer and De Wolf2000; Schokker et al., Reference Schokker, Cleveringa and Murray2004; Busschers et al., Reference Busschers, Kasse, Van Balen, Vandenberghe, Cohen, Weerts, Wallinga, Johns, Cleveringa and Bunnik2007; Peeters et al., Reference Peeters, Busschers, Stouthamer, Bosch, Van den Berg, Wallinga, Versendaal, Bunnik and Middelkoop2016). However, differences in the (timing of) vegetation development can also be observed, most likely related to local geomorphological, relief and drainage conditions.
Juniperus and Artemisia are characteristic elements of the late-glacial pioneer vegetation on the high ice-pushed ridges fringing the Amsterdam (Van Leeuwen et al., Reference Van Leeuwen, Beets, Bosch, Burger, Cleveringa, Van Harten, Waldemar Herngreen, Kruk, Langereis, Meyer, Pouwer and De Wolf2000) and IJssel basins (Busschers et al., Reference Busschers, Kasse, Van Balen, Vandenberghe, Cohen, Weerts, Wallinga, Johns, Cleveringa and Bunnik2007: core 27G0118) during the LS and early Eemian (E1) (Table 1). In the palaeo-Vecht valley, however, values of Juniperus and Artemisia are lower (Peeters et al., Reference Peeters, Busschers, Stouthamer, Bosch, Van den Berg, Wallinga, Versendaal, Bunnik and Middelkoop2016), possibly related to the lower relief and wetter conditions (Fig. 8A).
Alnus is present in the local vegetation from Eemian pollen zone E3 onwards (Figs 4 and 5; Amersfoort 1/New) (Table 1). Local alder growth occurred in favourable locations in fresh-water marshes along the basin margins (Fig. 7). Peak Alnus values occur during the start of peat formation related to groundwater level rise in zones E3 and E4 in the Amersfoort Basin (Figs 4–6), and therefore, these Alnus maxima are time-transgressive. In the deeper, open water environment of the basin, Alnus values are lower (Fig. 5: Amersfoort New). In the final stages of the Eemian (E5 to E6 transition), sea-level rise stopped and salt-water clay deposition was succeeded by fresh-water peat formation and a hydroseral succession occurred with peak Alnus values (Fig. 7).
Carpinus is a characteristic element in pollen zone E5 (Zagwijn, Reference Zagwijn1961). However, Carpinus values are highly variable in the different sites (Table 1). This difference can be explained by the different geomorphological setting of the sites. Carpinus favours moderately moist, nutrient-rich, well-drained humic top-soil conditions (FLORON, 2021). The limited presence of Carpinus in the palaeo-Vecht valley may be related to high groundwater levels and wet environmental conditions due to the subdued morphology of till plains and low (+10–15 m NAP), till-covered ice-pushed ridges (Gaasterland, Urk, Steenwijk) close to the valley (Fig. 8A). In contrast, the higher Carpinus values in the basins are due to good growing conditions on the surrounding slopes of the high (+50 m NAP), well-drained ice-pushed ridges. These consist of moderately nutrient-rich, locally calcareous, Rhine and Meuse sediments, favouring the development of Carpinus-dominated forests.
Chenopodiaceae show a continuous curve in the sediments of the Amersfoort (Figs 4–6) and Amsterdam basins (Van Leeuwen et al., Reference Van Leeuwen, Beets, Bosch, Burger, Cleveringa, Van Harten, Waldemar Herngreen, Kruk, Langereis, Meyer, Pouwer and De Wolf2000) during the maximum transgression of the Eemian (zone E5) indicating a basin-marginal depositional environment (Fig. 8C) (Zagwijn, Reference Zagwijn1961; Bunnik & Cremer, Reference Bunnik and Cremer2011). Peak values of Chenopodiaceae occur in the upper part of zone E5 and probably indicate local presence on intertidal or supratidal salt or brackish-water marshes or tidal litter zones in the final stage of deposition (Bohncke, Reference Bohncke and Schoute1984; Kasse, Reference Kasse1988; Cleveringa et al., Reference Cleveringa, Meijer, Van Leeuwen, De Wolf, Pouwer, Lissenberg and Burger2000: 212). Chenopodiaceae values are lower in the palaeo-Vecht valley (Peeters et al., Reference Peeters, Busschers, Stouthamer, Bosch, Van den Berg, Wallinga, Versendaal, Bunnik and Middelkoop2016) and Chenopodiaceae are lacking in the IJssel valley in zone E5 (Busschers et al., Reference Busschers, Kasse, Van Balen, Vandenberghe, Cohen, Weerts, Wallinga, Johns, Cleveringa and Bunnik2007). This indicates that the salt- or brackish water marshes of the western and central Netherlands gradually changed into fresh water, possibly tidal, environments in the Eemian Rhine delta of the eastern Netherlands (Fig. 8C).
The vegetation development is more uniform in the Amersfoort Basin during the late Eemian and Early Weichselian (Fig. 8D). The basin was largely filled and landscape and hydrological gradients were smaller in comparison to the early and middle Eemian (Fig. 7). As a consequence, the sedimentary succession and vegetation were similar.
Conclusions
The original Eemian stratotype in the Netherlands (Amersfoort 1; Zagwijn, Reference Zagwijn1961) has been reinvestigated and two new cores in the more central part and at the western margin of the Amersfoort glacial basin were studied by pollen analysis. The results of the Amersfoort Basin are compared to the current Eemian stratotype in the Amsterdam Basin and other Eemian sites in the Netherlands. A more complete record of the Eemian vegetational development and its spatial variations has been reconstructed.
Fully developed Eemian records occur in the deeper parts of the former Saalian glacial basins that provided a large accommodation space (e.g. Amsterdam Basin). The Late Saalian to early Weichselian transition and pollen zone E1 are missing in the shallower part of the Amersfoort Basin near the city of Amersfoort. An erosional boundary reflects the Eemian transgression at the onset of zone E4a in the Amersfoort and Amsterdam basins. At the higher margin of the Amersfoort Basin, the Eemian record starts later during pollen zone E4b. Before that, soil formation took place.
The influx of reworked (allochthonous) pollen in clastic sediment units hampers vegetation and climatic reconstructions during the Late Saalian in the Amsterdam and IJssel basins. The early presence of Picea in the clastic sediments of zone E4 and Abies in zone E5 may be related to the influx of redistributed Rhine sediments in the basins.
Differences in the regional vegetation development in the basins are related to local environmental and geomorphological conditions. Local alder growth in the Amersfoort records occurred in the early Eemian (zone E3-4) as a consequence of paludification due to groundwater and sea-level rise, and in the final phase of the Eemian (zone E5-6) due to hydroseral succession. Salt- to brackish-water marshes and tidal litter zones, characterised by Chenopodiaceae (Amaranthaceae), established at high sea level during zone E5 in the Amsterdam and Amersfoort basins, while further upstream in the Rhine delta brackish to fresh-water tidal conditions were present during zone E5 (Vecht and IJssel basins). Carpinus forest growth in zone E5 was favoured by the presence of drained, nutrient-rich, ice-pushed ridges fringing the Amsterdam, Amersfoort and IJssel basins.
The Eemian to Early Weichselian boundary is set at the decline of the coniferous forest vegetation, increase of heathlands and opening of the vegetation cover with Poaceae and Artemisia, coinciding with erosion of the ice-pushed ridges and sand deposition in the Amersfoort Basin.
The vegetation records of the Amersfoort and Amsterdam basins present, when combined, the full Eemian interglacial cycle (composite-stratotype). The Saalian–Eemian boundary stratotype and first part of the Eemian Stage is best developed in the Amsterdam Basin. The late Eemian to early Weichselian transition and boundary stratotype for the base of the Weichselian Stage is best preserved in the Amersfoort Basin.
Supplementary materials
For supplementary material for this article, please visit https://doi.org/10.1017/njg.2022.4
Acknowledgements
Dr Jacqueline van Leeuwen is thanked for her help identifying Taxus pollen. P.L. Gibbard and B. Van Geel are thanked for their constructive comments that helped to improve the manuscript.
Appendix Description of the pollen diagrams
Core Amersfoort New B32B2092 (x = 157127; y = 463605; z = 2.92 m +NAP Dutch Ordnance Datum)
The location of core and pollen diagram Amersfoort New (B32B2092) is shown in Figs 1 and 2A. The core is located in the southern part of the Amersfoort glacial basin, 107 m northeast of Amersfoort 1 (Zagwijn, Reference Zagwijn1961), in the direction of the deeper part of the basin. The core lithology and lithostratigraphy are shown in Fig. 3. Deeper than 31 m below surface, several 2 to 3 m thick fining-upward sequences of coarse to medium fine sand occur, that are interpreted as local fluvial deposits (Boxtel Formation) of late Saalian age. The interval 31.00−30.76 m below surface is characterised by very coarse sand, that may represent an erosional event. This is overlain by organic deposits, sand and clay (30.76-15.00 m) and peat (15.00-13.94 m) (Eem Fm) of Eemian age, and mostly fine to medium grained sand and peat beds (Boxtel Fm) of Weichselian age.
The following pollen zones are distinguished in core Amersfoort New (Fig. 5). The zonation of the lower part conforms to Bunnik and Cremer (Reference Bunnik and Cremer2011); the upper part with zones E6 to PW is reinterpreted in the present study.
Zone E2 (30.76-30.04 m; loam and gyttja). This zone is characterised by high Pinus values up to 95%. Betula (and some Artemisia) occurs in the lower part, possibly reflecting the transition from pollen zone E1 to E2.
Zone E3 (30.04-29.66 m; gyttja). In this zone, Pinus values drop to 65% and Quercus increases rapidly to 20%. Ulmus, Corylus and Alnus appear for the first time in low percentages (∼5%). Ceratophyllum and Nuphar are characteristic for a fresh-water lake vegetation (see supplement full diagram Fig. S5).
Zone E4a (29.66-28.87 m; erosive basal boundary; peat with occasional shell fragments). The presence of salt-water shells fragments and occasional gravel in the peat indicates that the peat bed is not in situ. This is corroborated by the diatom association, which reveals salt-water conditions for this interval (Bunnik & Cremer, Reference Bunnik and Cremer2011). The zone is dominated by high values of thermophilous trees, especially Corylus attains values up to 55%. Quercus values are slightly lower than in the previous zone and Ulmus is still present. Low values of dinoflagellates and foraminifers indicate the start of shallow-marine conditions (supplement full diagram Fig. S5).
Zone E4b (28.87-≤28.08 m; coarsening-up sequence of loam to fine sand with shells). The upper boundary of zone E4b is unknown because of the thick sand interval without pollen. The base of the zone is characterised by a sharp drop in Corylus (to 10%) and increase of Quercus (to 40%), Pinus (to 45%) and Picea (5%). Taxus, which is a characteristic element in zone E4b (Zagwijn, Reference Zagwijn1996; Cleveringa et al., Reference Cleveringa, Meijer, Van Leeuwen, De Wolf, Pouwer, Lissenberg and Burger2000), is missing here. High values of dinoflagellates and the presence of Chenopodiaceae indicate salt-water depositional conditions.
Zone E5 (≥19.39-15.00 m; loam and clay with few shells). High Carpinus (25%) and Picea (30%) values indicate that the forest species composition has drastically changed. Thermophilous trees like Quercus and Corylus show low values in comparison to previous zones. Abies is present for the first time and increases to 5% in the upper part. Taxus is present in very low values. Chenopodiaceae form a continuous curve with a maximum of 10% at 15.97 m, probably indicating the nearby presence of salt or brackish water marshes or tidal litter zones. The basin marginal salt-water environment is supported by the presence of dinoflagellates throughout this zone (supplement full diagram Fig. S5).
Zone E6 (15.00-13.86 m; peat). The pollen assemblage changes abruptly at the lithological transition from clay to peat at 15.00 m. Carpinus and Quercus show an abrupt drop and Chenopodiaceae and dinoflagellates disappear at the clay-peat transition. The wetland herbs (Cyperaceae) show an increase, reflecting a change to fresh-water conditions during peat formation. Picea (40%) and Abies show peak values at the base of this zone. In the upper part, Picea is nearly absent and first Betula and then Pinus show a strong increase. These changes reflect the transition from the deciduous forest in zone E5 to a coniferous, boreal woodland at the end of the Eemian (zone E6). Associated with this change, Ericales (Calluna) and Sphagnum show a first increase.
Zone EWI (13.86-10.64 m; sand with organic laminations, peat and gyttja). The lower boundary of this zone is defined by the relative decrease of Pinus (to 70%) and strong increase of Ericales reflecting an opening of the boreal vegetation cover at the Eemian to Weichselian Early Glacial transition (cf. Zagwijn, Reference Zagwijn1961; Chaline & Jerz, Reference Chaline and Jerz1984). This coincides with a lithological change from peat to sand that reflects increasing landscape dynamics. The zone is dominated by Pinus and Picea, while thermophilous trees are virtually absent. In the upper part of the zone low values of Artemisia and a rise of Betula values possibly indicate further opening of the vegetation cover, related to climatic cooling during the stadial. The peat and gyttja in the upper part of this zone reflects local wet conditions, supported by the increase of wetland plants.
Zone EWII (10.64-9.86 m; peat). The zone is characterised by higher Pinus (up to 95%), low Picea and lower Ericales values in comparison to the underlying zone EWI. This assemblage is comparable to zone E6 and reflects the re-establishment of a boreal coniferous woodland (and even some Quercus) near the site, which can be associated with the Amersfoort/Brørup Interstadial (Behre, Reference Behre1989). High Dryopteris fern values and Equisetum are characteristic elements in the peat-forming vegetation (supplement full diagram Fig. S5). Landscape stability increased as reflected by the peat formation in this zone, which contrasts with the sandy character of the previous zone EWI.
Zone PW (9.86-7.27 m; mostly sand with organic laminations). This long interval consists of laminated fine to coarse sands with few thin fine-grained and organic beds from which the pollen samples were taken. This zone is characterised by first a decrease and then an increase of Pinus and by slightly higher values of Picea. The strong increase of Ericales and Sphagnum probably reflects more open coniferous vegetation and moorland development. The two upper spectra show a decrease in Ericales and increase of wetland herbs (Cyperaceae) and Selaginella selaginoides. Upland herbs and Artemisia are present pointing to an open vegetation and a cool climate. The abundance of fresh-water algae (Pediastrum, Botryococcus) in the uppermost samples reflects the local existence of a small lake, which was bordered by Selaginella clubmoss, a situation which also occurred towards the end of the Weichselian at several sites in The Netherlands (Hoek, Reference Hoek1997). This zone has been assigned to the Weichselian Pleniglacial (Bunnik & Cremer, Reference Bunnik and Cremer2011).
Core Den Treek B32D1455 (x = 154501; y = 459086; z = 7.00 m +NAP)
The location of core and pollen diagram Den Treek is shown in Figs 1 and 2B. The core is located at the western margin of the Amersfoort glacial basin, circa 5 km southwest of Amersfoort 1 (Zagwijn, Reference Zagwijn1961). In the lower part of the core till (35.71-30.69 m below surface) and colluvial, paraglacial and fluvioglacial sands (30.69-14.47 m) of the Drente Formation of presumably Late Saalian age are found (Fig. 3). The glacial and fluvioglacial sediments are overlain by organic and clay deposits (14.47-13.46 m; Eem Fm) of Eemian age, circa 1.7 m peat of Late Eemian to Early Weichselian age (13.46-12.73 m; Woudenberg Fm) and 12.7 m of mostly fine to medium-grained sand with intercalated loamy and organic beds (Boxtel Fm) of Weichselian age.
The presumably Eemian and Early Weichselian interval was analysed for its pollen composition (Fig. 6). The following pollen zones are distinguished:
Zone E4b (14.48-14.29 m below surface; sand in lowest spectrum, peat). The lowest spectrum is characterised by high upland herb values (amongst others Helianthemum; supplement full diagram Fig. S6) and Ericales values suggesting open landscape conditions, that could be related to cold conditions of the Late Saalian. This is succeeded by high Betula values, normally associated with zone E1 (Zagwijn, Reference Zagwijn1961). A small increase of Pinus is found in the upper part of this zone, which may indicate the presence of pine in zone E2. However, throughout the zone low values of thermophilous trees Ulmus, Quercus and Corylus and high values of Alnus (60%) are present that are associated with pollen zones E3 and E4a. In addition, even some Taxus pollen was found, characteristic for Eemian zone E4b. It means that pollen zones E1 to E4a are missing or incorporated in zone E4b by low accumulation rates and bioturbation.
Zone E5 (14.29-13.46 m; sand overlain by clay). The base of the zone is marked by a sharp (erosive) boundary to the underlying peat. The lower part of zone E5 (14.29-∼13.60 m) is characterised by a sharp increase and domination of Carpinus (up to 45%). Thermophilous trees Ulmus, Quercus and Corylus are well represented. Alnus (20%) reflects the vegetation at the nearby transition from basin to ice-pushed ridge. Betula and Pinus values are low and Picea is present for the first time (up to 10%). Chenopodiaceae form a continuous curve (∼5%) in this clay unit reflecting basin marginal deposition in brackish water marshes. In accordance with this, dinoflagellates are only present in this zone (Supplement full diagram Fig. S6). The upper part of zone E5 (∼13.60-13.46 m) shows a decrease in Carpinus, Ulmus and Corylus, while Quercus remains present (5%). Chenopodiaceae are still present reflecting the final phase of brackish-water clay deposition. Poaceae show a peak at the top of this pollen zone, which can be related to the gradual clay to peat transition. The peak of Sparganium points to shallow fresh-water conditions. These changes indicate a rapid hydroseral succession from open brackish water to a riparian fresh-water environment.
Zone E6 (13.46-12.92 m below surface; peat) is characterised by high values of Pinus (up to 50%) and Picea (up to 10%). The thermophilous trees Carpinus, Quercus and Ulmus are still present in low values. Alnus shows peak values up to 25%. The lower part of zone E6 (13.46-13.22 m below surface) shows maximum Picea values (10%) and Pinus shows an increase. The upper part of zone E6 (13.22-12.92 m) shows a maximum in Pinus values (50%) and higher Betula values. The Ericales (mostly Calluna) show a first increase and Abies is present for the first time in this diagram. The vegetation composition indicates the establishment of a boreal coniferous forest, probably related to climate cooling and acidification of soils in the final stage of the Eemian.
Zone EWI (12.92-12.00 m below surface; peat, sand and loam). Subzone EWIa is dominated by Pinus, Betula and Picea and high Ericales values. The lower AP values and higher values of Ericales can be related to climate cooling and soil acidification. Thermophilous trees (Quercus, Corylus, Carpinus, Ulmus) are present in low values, especially in the sand and loam beds in this interval. This may be attributed to reworking of pollen from underlying interglacial beds (cf Zagwijn, Reference Zagwijn1961: 28), but it is also possible that some thermophilous trees (with even some Hedera) remained nearby. Coincident with the opening of the vegetation cover, landscape stability declined and local erosion of the ice-pushed ridge and medium coarse sand deposition by shallow streams occurred at the core site. At the end of this zone, a Sphagnum peak followed by a Pediastrum peak point to increasingly wet conditions (Supplement full diagram Fig. S6). Subzone EWIb (12.18-12.00 m; loam changing to peat) shows a strong decrease of Ericales. The upland herbs and Poaceae show peak values and Artemisia is present, reflecting more open steppe-like vegetation conditions related to a cold climate. Local wetland herbs at the core site reach their highest values and most diverse composition of the whole core.
Zone EW II (12.00-∼11.60 m; peat). Upland herbs and Ericales show low values. Pinus shows a strong expansion (up to 80%), which indicates the development of a boreal pine forest. Quercus and Corylus are present in low values and, because of the occurrence in a peat bed, are regarded as autochthonous. The vegetation changes can be interpreted as the response to climate warming during the Amersfoort/Brørup Interstadial (Behre, Reference Behre1989).
Zone EW III (∼11.60-11.48; sand). The zone is dominated by Betula and Pinus. The herbaceous vegetation has increased and Artemisia is a characteristic element of the rather open scrubland vegetation interspersed with Pinus and Betula trees, pointing to colder conditions comparable to zone EWIb.


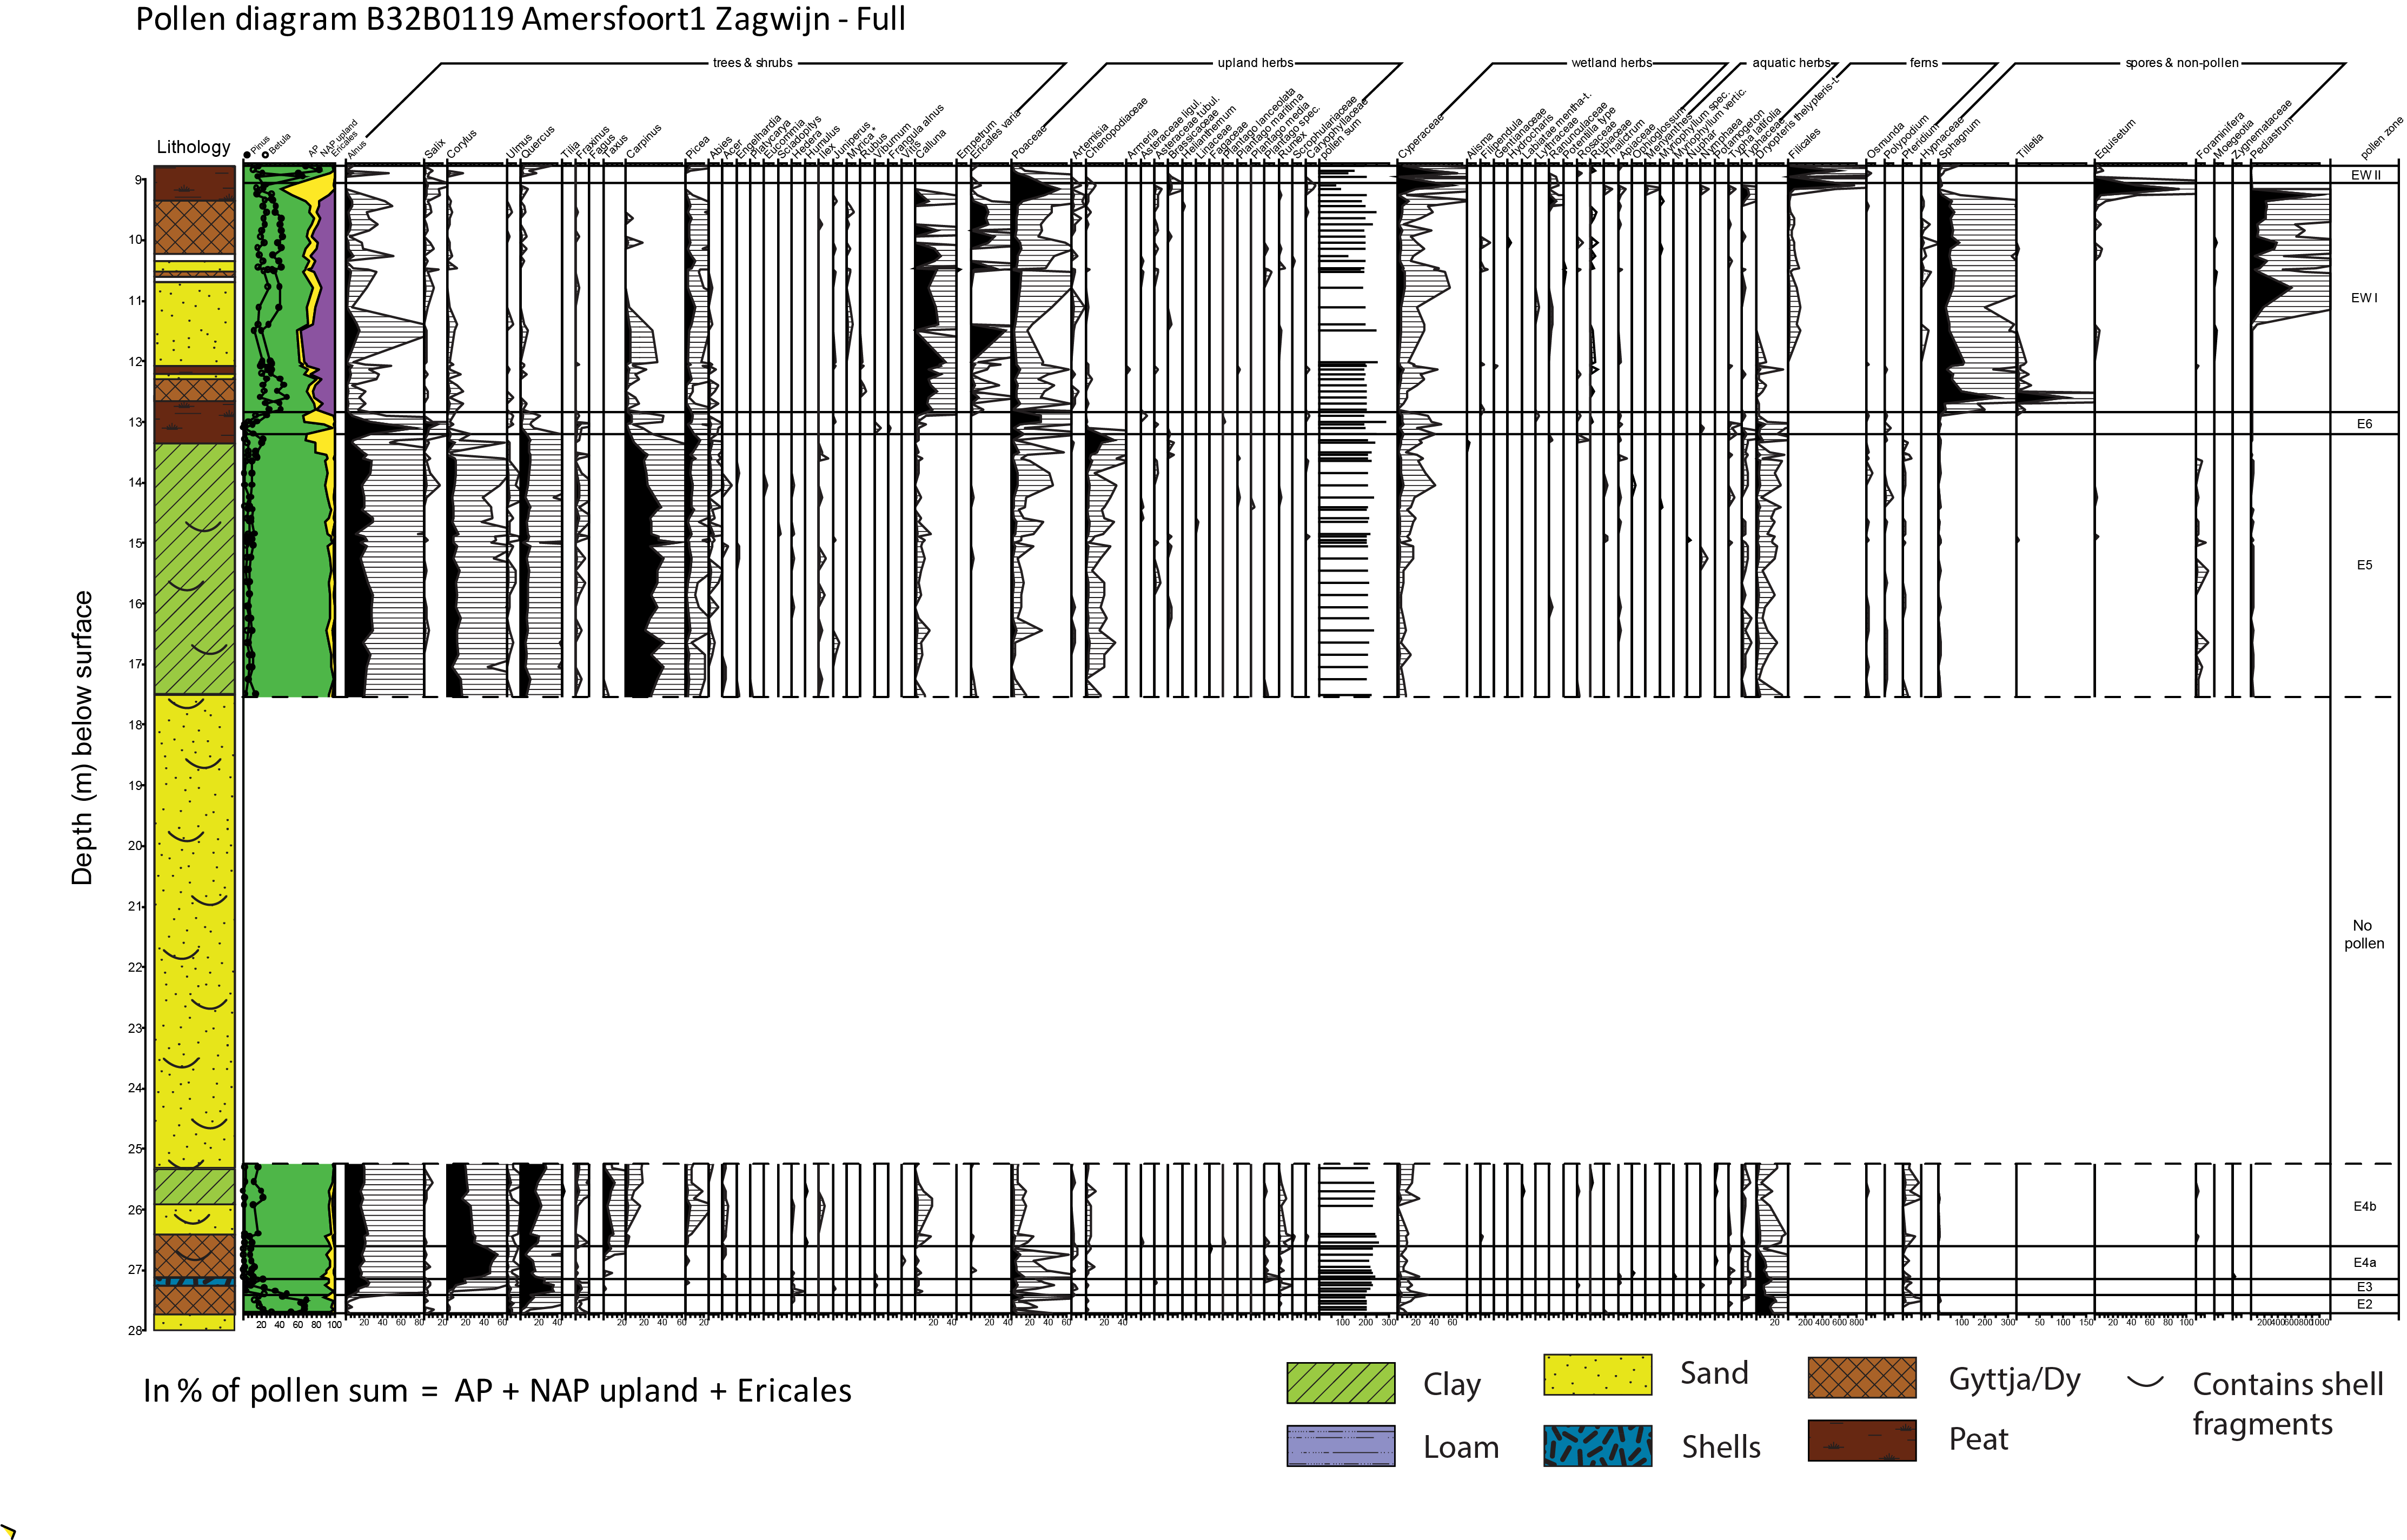
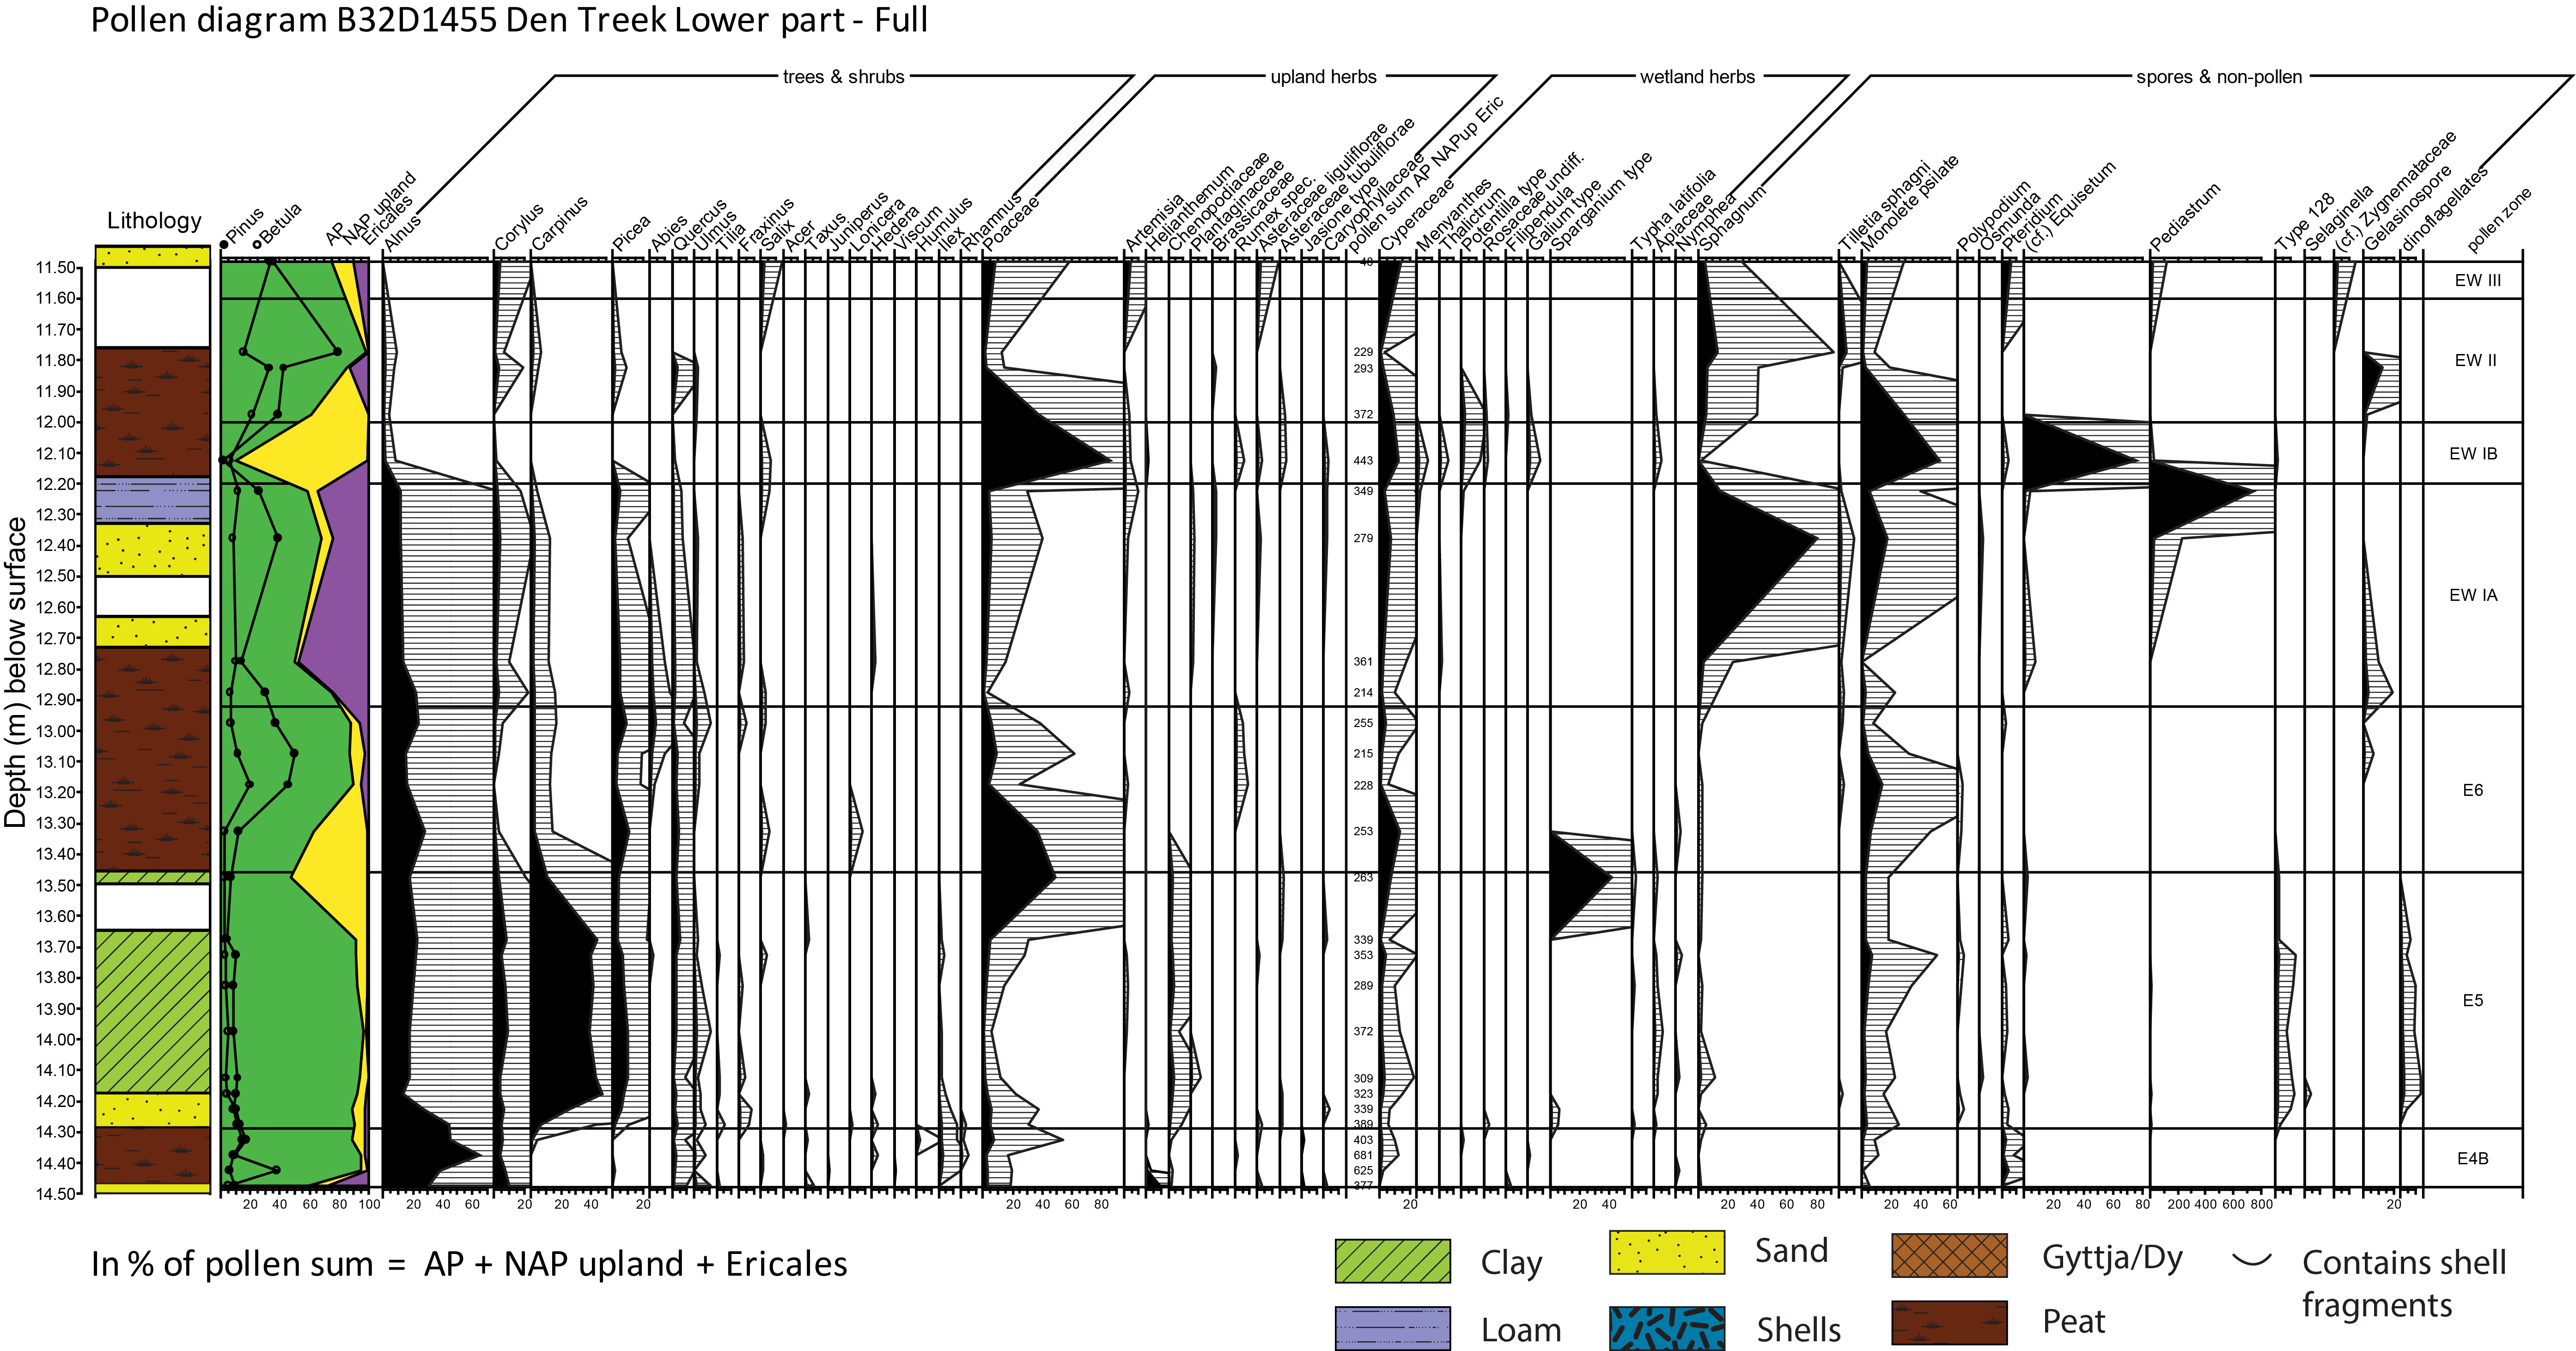
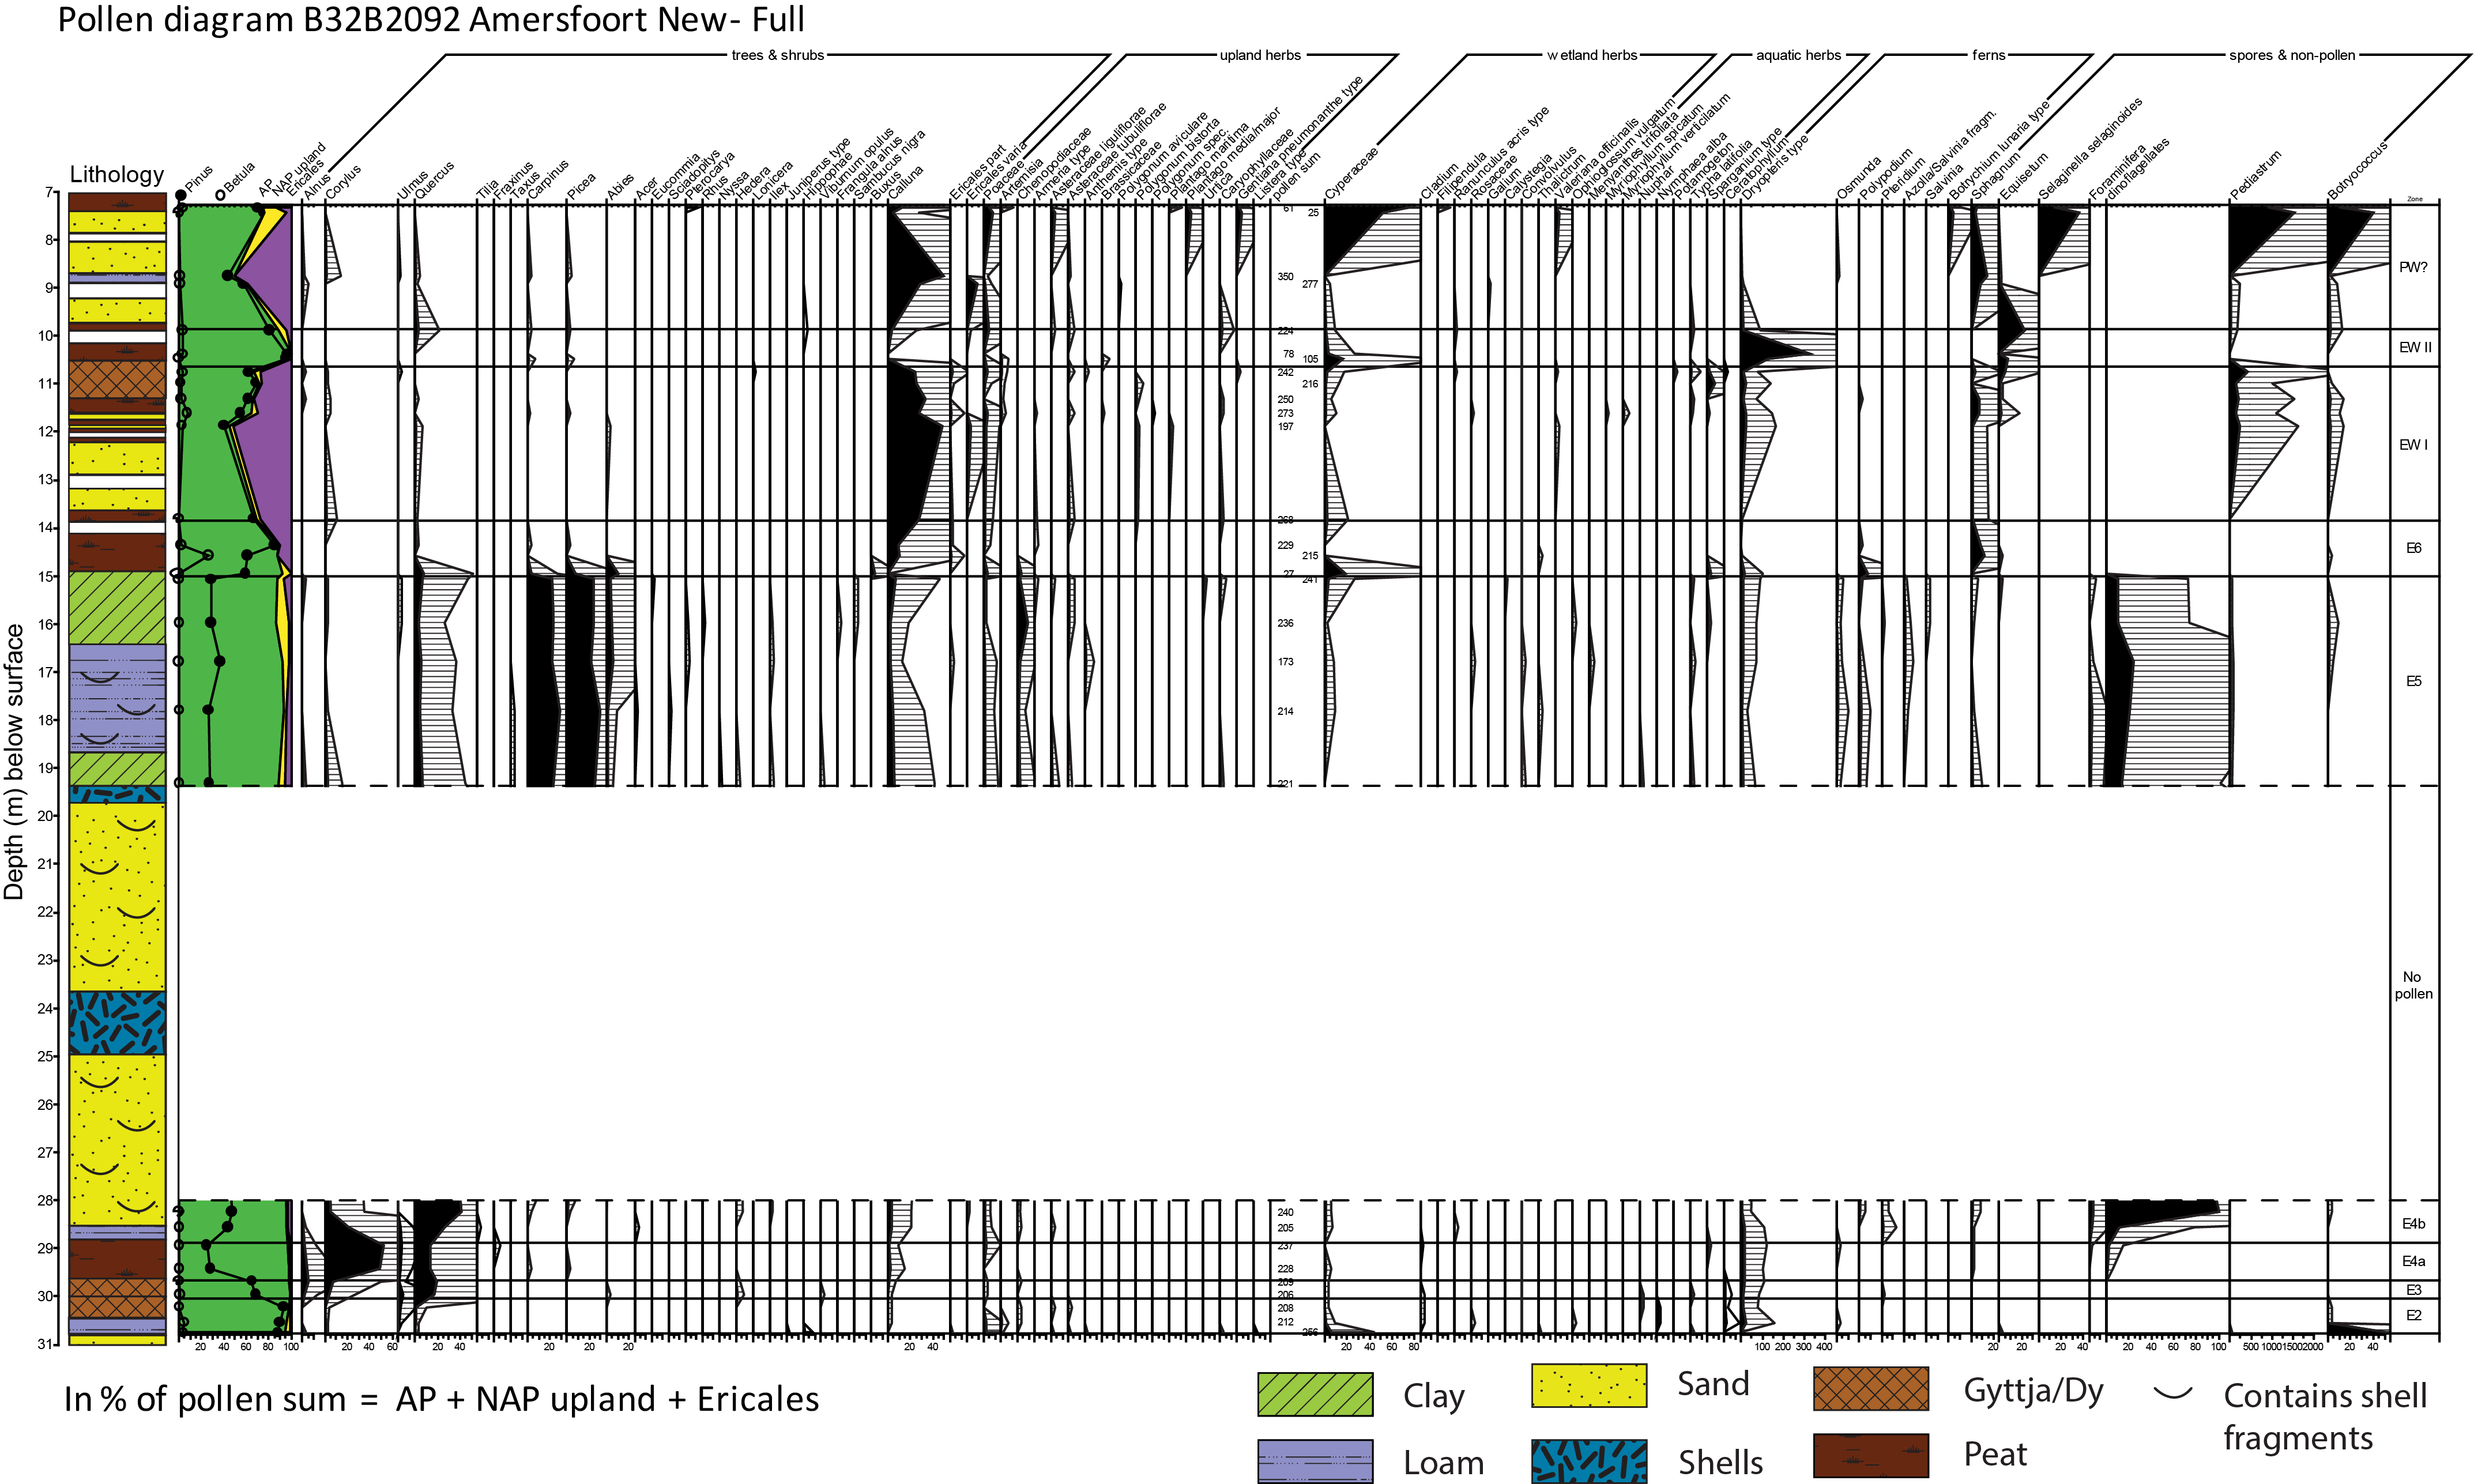

 Open access